

Abstract
In vivo optical imaging using fluorescently labeled self-quenched monoclonal antibodies, activated through binding and internalization within target cells, results in excellent target-to-background ratios. We hypothesized that these molecular probes could be utilized to accurately report on cellular internalization with fluorescence lifetime imaging (FLI). Two imaging probes were synthesized, consisting of the antibody trastuzumab (targeting HER2/neu) conjugated to Alexa Fluor750 in ratios of either 1:8 or 1:1. Fluorescence intensity and lifetime of each conjugate were initially determined at endosomal pHs. Since the 1:8 conjugate is self-quenched, the fluorescence lifetime of each probe was also determined after exposure to the known dequencher SDS. In vitro imaging experiments were performed using 3T3/HER2+ and BALB/3T3 (HER2−) cell lines. Changes in fluorescence lifetime correlated with temperature- and time-dependent cellular internalization. In vivo imaging studies in mice with dual flank tumors [3T3/HER2+ and BALB/3T3 (HER2−)] detected a minimal difference in FLI. In conclusion, fluorescence lifetime imaging monitors the internalization of target-specific activatable antibody–fluorophore conjugates in vitro. Challenges remain in adapting this methodology to in vivo imaging.
Keywords: molecular imaging, fluorescence lifetime, activatable fluorescence probe, cancer, near-infrared
1. INTRODUCTION
One of molecular imaging's potential roles is to distinguish between tumors of differing molecular characteristics (1–3). Optical fluorescence imaging is minimally invasive, low cost and sensitive to low concentrations (picomolar range) of targeted molecular probes; its multicolor capabilities enable simultaneous imaging of several cell surface markers (1–3). In addition, a striking feature of optical imaging is the ability to activate probes, in particular biological and chemical environments (4–6). Currently, optical imaging is largely based on the color and intensity of emitted light or `fluorescence intensity imaging' (FII). Fluorescent proteins have recently demonstrated the power of molecular imaging (7–9). Although these techniques require genetic manipulation, their application to the clinic is coming closer (10). Exogenous contrast agents are closer to clinical application, and therefore we have focused on developing fluorescence intensity-based injectable probes for oncologic imaging. However, another potential optical property that can be utilized for creating images is fluorescence lifetime imaging (FLI).
Fluorescence lifetime is a parameter that describes the average amount of time a fluorophore spends in its excited state before returning to the ground state (11). Images are created by spatially resolved measurements of fluorescence lifetimes across a surface (12). The rate of energy dissipation depends on multiple properties including fluorescence quantum yield, internal conversion, photolysis, Förster resonance energy transfer (FRET), quenching and intersystem crossing among others (13). These processes are independent of fluorophore concentration, excitation laser power and light path length, but depend strongly on the fluorophore's immediate environment such as temperature, pH, oxygen content and bioenergetic status (14–16). Through creative probe design, lifetime imaging has been used to determine tissue pH, oxygen content and viscosity (17–21).
Herein, we have designed a molecular probe to report on cellular internalization through fluorescence lifetime. Among the available fluorophores, near-infrared (NIR) fluorophores have superior tissue penetration in vivo and can be imaged with less autofluorescence; they are therefore the most desirable for in vivo imaging. When multiple NIR fluorophores are conjugated to a single antibody, the fluorophores commonly become self-quenched, but can dequench (or `activate') upon cellular internalization and degradation (5). This method can partially overcome the limitations of the `always on' 1:1 antibody–fluorophore conjugates (low tumor to background ratio secondary to prolonged background clearance time) while taking advantage of the specificity of the antibody. However, non-target tumors with leaky vasculatures can also non-specifically enhance with `always on' agents due to enhanced permeability and retention (EPR) effects (5). Herein, we hypothesize that fluorescence lifetime imaging can be used to determine whether an optical probe has been internalized by a targeted cell after binding to a particular receptor, thus providing an additional `tissue signature'. As fluorescence lifetime is less susceptible to the artifacts induced by variable fluorophore concentration, high light scattering, and absorption, it provides a robust means for the monitoring of a molecular occurrence, such as fluorophore internalization. In this study we utilize a clinically approved monoclonal antibody, trastuzumab, conjugated to the near-infrared (NIR) fluorophore Alexa Fluor 750 in low and high antibody:dye ratios. Trastuzumab targets the HER2/neu receptor, which is overexpressed in numerous cancers (22). Upon binding to HER2, trastuzumab is endocytosed into the cell (23). We measured changes in lifetime with respect to quenching at endosomal pHs (24), and correlated it with the internalization of the trastuzumab–Alexa Fluor 750 conjugate after incubation with HER2+ and HER2− cells.
2. MATERIALS AND METHODS
2.1. Reagents
Trastuzumab, a humanized anti-HER2 antibody, was purchased from Genentech Inc. (South San Francisco, CA, USA). Alexa-Fluor750-NHS ester was purchased from Invitrogen Corporation (Carlsbad, CA, USA). All other chemicals used were of reagent grade.
2.2. Synthesis of Alexa 750-conjugated antibodies
Trastuzumab (1 mg, 6.8 nmol) was incubated with Alexa Fluor 750-NHS (13.6 or 68 nmol) in 0.1 m Na2HPO4 (pH 8.5) at room temperature for 30 min. Then the mixture was purified with a Sephadex G50 column (PD-10; GE Healthcare, Piscataway, NJ, USA). The protein concentrations were determined with Coomassie Plus protein assay kit (Pierce Biotechnology, Rockford, IL, USA) by measuring the absorption at 595 nm with a UV–vis system (8453 Value UV–Visible Value System; Agilent Technologies, Santa Clara, CA, USA). The concentration of Alexa Fluor 750 was measured by absorption with the UV–vis system to confirm the number of fluorophore molecules conjugated to each trastuzumab molecule based on the calculation with the reported ε value of Alexa Fluor 750 at the maximum absorbance wavelength as previously described (25). The ratio of Antibody:Alexa Fluor 750 was 1:1 for the 1:2 reaction condition and 1:8 for 1:10 reaction conditions. Thus, trastuzumab–Alexa Fluor 750 1:1 (trastuzumab–Alexa 1:1) and trastuzumab–Alexa Fluor 750 1:8 (trastuzumab–Alexa 1:8) were prepared. Similar fractions of both preparations bound to the HER2+ cells based on the florescence-based immunopreticipation analysis.
2.3. Determination of quenching in vitro
Solutions, 50 μg/ml, of each conjugate were prepared in PBS at pH 6.0 and 7.2. A set of samples was also treated with 0.4% SDS to investigate the effects of fluorescence dequenching. The fluorescence of each conjugate was obtained with a Maestro in vivo imaging system (CRi, Woburn, MA, USA) utilizing the deep red filter sets [a band pass filter from 671–705 nm (excitation) and a long pass filter over 750 nm (emission)]. A tunable emission filter was automatically stepped in 10 nm increments from 650 to 950 nm, to generate approximately 30 spectral images. The spectral images were then unmixed based on their spectral patterns using commercial software (Maestro, CRi) and intensity values obtained. Studies were repeated four times.
2.4. Determination of in vitro fluorescence lifetime
Samples (50 μg/ml) of each conjugate at pH 6.0 or 7.2, with and without 0.4% SDS, were prepared. The fluorescence lifetimes of unconjugated Alexa Fluor 750 in PBS (pH 7.4) as well as that of both antibody fluorophore conjugate preparations were determined at room temperature (22±2°C) by placing a 50 μg/ml droplet of each sample on a glass slide just prior to imaging. Lifetime values were obtained using time-resolved fluorescence lifetime imaging systems, which have been described elsewhere (12). Briefly, the system was based on a time domain technique, where an advanced time-correlated single-photon counting device was used in conjunction with a high-speed repetition rate tunable laser to detect individual photons. The imager had a laser source for fluorescence excitation (wavelength=750 nm) and an emission filter (wavelength=780 nm) for fluorescence detection. A cooled, charge-coupled device camera was also used to guide the scan to the region of interest (ROI). After marking the ROI, the imager scanned in a raster pattern over the sample surface to produce a 2D image. The fluorescence signal was detected by the photo multiplier tube (PMT) after illuminating the ROI. The output of the PMT was pre-amplified and the distribution of the time-of-flight of the fluorophore was recorded by time correlated single photon counting (TCSPC) and subsequent fitting to a single exponential decay yielded an average fluorescence lifetime over ROI.
2.5. Cell lines
HER2 gene-transfected NIH3T3 (3T3/HER2+) and BALB/3T3 (HER2−) cell lines were grown and maintained in RPMI 1640 (Life Technologies, Carlsbad, CA, USA) containing 10% fetal bovine serum (Life Technologies), 0.03% l-glutamine, 100 units/ml penicillin, and 100 ug/ml streptomycin in 5% CO2 at 37°C. The BALB/3T3 cell line was employed as a negative control, as it does not express HER2 receptor.
2.6. Immunoreactivity of Alexa Fluor 750-conjugated antibody
Alexa Fluor 750-trastuzumab conjugates (1 μg) were incubated with 20 million 3T3/HER2+ cells for 1 h at 4°C. No specific binding were measured with the same sample by incubating together with the 100 μg of non-conjugated trastuzumab. All experiments were performed in duplicate. Specific binding was calculated by subtracting the bound fraction from non-specific binding.
2.7. Fluorescence microscopy studies
3T3/HER2+ cells were plated on a cover glass-bottomed culture well and incubated for less than 48 h. Trastuzumab–Alexa 1:1 or 1:8 conjugation was added to the medium (10 μg/ml), and the cells were incubated for either 1 or 8 h. The 1 h incubation group was performed on ice to minimize receptor internalization prior to microscopy. The 8 h plates were also incubated on ice for the first hour, after which the well's media was replaced, and cells were incubated in 5% CO2 at 37°C for the next 7 h prior to microscopy. Once complete, the cells were washed once with PBS, and fluorescence microscopy was performed using an Olympus BX61 microscope (Olympus America, Center Valley, PA, USA) equipped with the following filters: excitation wavelength 672.5–747.5 nm and emission wavelength 765–855 nm. Transmitted light differential interference contrast images were also acquired. To investigate the receptor specificity, the conjugates were also incubated with BALB/3T3 (HER2−) cells. Studies were repeated 3 times.
2.8. Cell pellet intensity and lifetime studies
3T3/HER2+ cells were plated on a 35 mm diameter culture well and incubated until confluent (approximately 48 h). Then the 1:1 or 1:8 conjugate was added to the media (30 μg/ml), and the cells were incubated for 1 or 8 h, the 1 h group again being incubated on ice. Upon completion of incubation, cells were removed from the well, and centrifuged to obtain pellets. The resulting cell pellets were washed with PBS×3. Then, fluorescence intensity images were obtained with the Maestro imaging system using the deep red filter sets (a band-pass excitation filter from 671 to 705 nm, and a long-pass emission filter over 750 nm). Utilizing a tunable emission filter, images were captured at 10 nm increments from 650 to 950 nm at a constant exposure. The resultant data set, a combination of autofluorescence and fluororphore signal, was unmixed according to their spectral patterns utilizing commercial software (Maestro software; CRi). Utilizing this software, full specimen regions of interest were measured as average intensity per pixel (a.u.). Fluorescence lifetime measurements were also performed. Both measurements were repeated four times under the same conditions at room temperature (22±2°C). These studies were repeated with the HER2− cell line.
2.9. Mouse model
All procedures were carried out in compliance with the Guide for the Care and Use of Laboratory Animal Resources (1996), National Research Council, and approved by the local Animal Care and Use Committee. Nude mice were injected with 2×10⁶ 3T3/HER2+ cells (in PBS) subcutaneously (s.c.) into the left dorsum of the mice, and 2×10⁶ Balb3T3 cells (in PBS) were injected s.c. into the right dorsum. Experiments were performed between 8 and 10 days post injection.
2.10. In vivo lifetime and spectral imaging studies
Trastuzumab–Alexa 1:8 was used for in vivo imaging. Trastuzumab–Alexa 1:8, 50 μg/100 μl, was injected via the tail vein into tumor-bearing (3T3/HER2+ and Balb3T3) mice 24 h prior to imaging. For lifetime measurement, mice were anesthetized under a continual administration of isofluorane through a nose cone. Just prior to imaging, a single mouse was placed on the temperature-controlled stage and an ROI to scan was drawn that encompassed the tumor. Lifetime was calculated as mentioned earlier at each pixel over the ROI by fitting single exponential decay to data. Each tumor was imaged individually. The mouse was then placed in a heated chamber, and allowed to recuperate for 30 min before being returned to its cage. For fluorophore intensity imaging, intraperitoneal (i.p.) sodium pentobarbital (1.2 mg) was used to anesthetize the mice. Images were obtained with the Maestro in vivo imaging system (CRi) using the deep red filter sets decribed above. The FII of each mouse occurred within 30 min of lifetime imaging. Upon completion of spectral imaging, mice were sacrificed using carbon dioxide.
3. RESULTS
3.1. Quenching efficiency and immunoreactivity of trastuzumab–Alexa conjugates
The quenched trastuzumab–Alexa 1:8 conjugate fluoresces approximately as brightly as trastuzumab–Alexa 1:1. The addition of 0.4% SDS to the sample dissociates the fluorophores from each other, effectively causing dequenching. Quenching efficiency (QE) for a particular conjugation is defined as the fluorescence intensity with SDS divided by fluorescence intensity without SDS. Trastuzumab–Alexa 1:1 demonstrated an average QE of about 1.47±0.25 (mean±SD) at pH 6.0, and 1.37±0.29 at pH 7.2. Trastuzumab–Alexa 1:8 conjugate demonstrated a QE of approximately 5±0.79 at pH 6.0, and 3.2±0.62 at pH 7.2 (Fig. 1).
Figure 1.
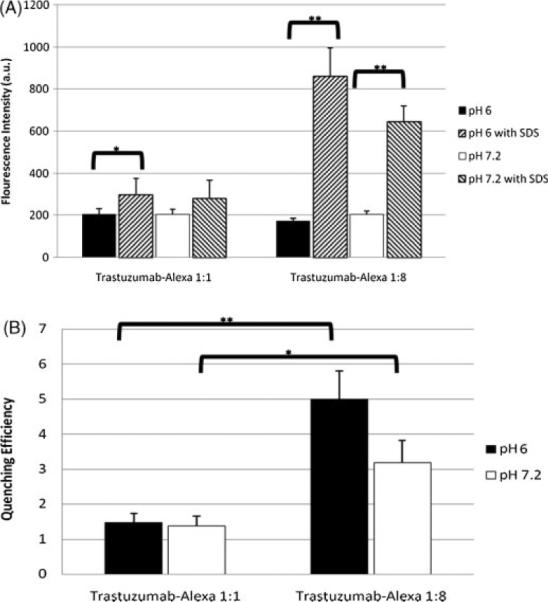
(A) Trastuzumab–Alexa 1:8 demonstrates significant (p < 0.01) dequenching of fluorescence intensity with the addition of SDS, whereas trastuzumab–Alexa 1:1 demonstrates a significant change (p < 0.05) only at the lower pH. (B) Trastuzumab–Alexa 1:8 demonstrates a significantly greater quenching efficiency (quenching efficiency = dequenched conjugate fluorescence intensity/quenched conjugate fluorescence intensity) than trastuzumab–Alexa 1:1 conjugate; n = 4.
Immunoreactivities of all conjugates were >78%, which was similar to the immunoreactivity of both I-125 and In-111 radiolabeled conjugates (78–82%) from the same batch of trastuzumab (26). Therefore, the immunoreactivity of trastuzumab–Alexa conjugates was not compromised by the conjugation reaction.
3.2. Fluorescence lifetime correlates with quenching status of molecular probe
The fluorescence lifetime of unconjugated Alexa Fluor 750 in PBS (pH 7.4) was 0.61 ns, consistent with previously published data (12). Trastuzumab conjugation to Alexa Fluor in 1:1 ratio increased the fluorescence lifetime to an average of 0.89±0.01 ns in pH 6.0, and 0.88±0.02 ns at pH 7.2. The addition of SDS further increased the fluorescence lifetime, to 1.02±0.06 and 1.01±0.03 ns in pH 6.0 and 7.2 respectively, gains of 14 and 15%. The average fluorescence lifetime of the self-quenched trastuzumab–Alexa 1:8 conjugate was 0.58±0.01 ns and 0.61±0.04 ns at pH 6 and 7.2, respectively. The addition of SDS resulted in a larger increase in fluorescence lifetime, to 0.87±0.01 and 0.85±0.03 ns in pH 6 and 7.2, a gain of 50 and 39%. A correlation between quenching efficiency and increases in fluorescence lifetime was observed, demonstrating greater increases in lifetime in fluorophore conjugates with greater quenching efficiencies (Fig. 2).
Figure 2.
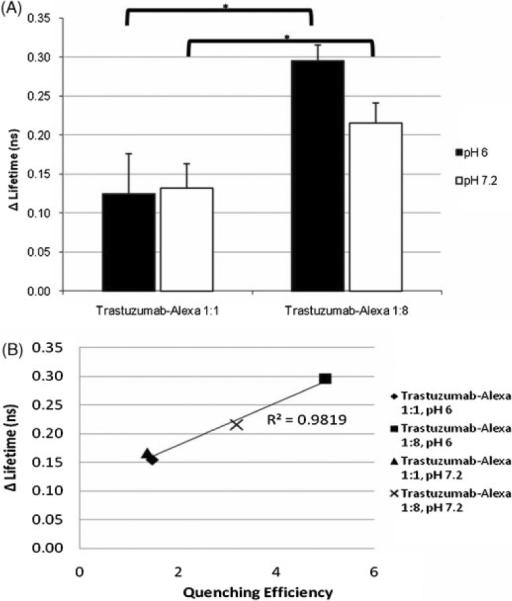
(A) Trastuzumab–Alexa 1:8 demonstrates a larger increase in lifetime with dequenching. (B) A correlation is noted between larger quenching efficiencies and larger lifetime increases; n = 3.
3.3. Fluorescence microscopy demonstrates activation of fluorophores in target cells
Fluorescence microscopy studies were performed to visualize cellular internalization of the conjugate by HER2+ cells, and to observe the fate of the fluorophore following internalization (Fig. 3). In HER2+ cells, fluorescence was demonstrated on the cell surface after 1 h incubation, but was mostly cytoplasmic after 8 h incubation. Furthermore, an increase in fluorescence intensity was noted after internalization of the trastuzumab–Alexa 1:8 conjugation, but was minimal with the trastuzumab–Alexa 1:1 conjugation. These results were not observed in the HER2− cell line, indicating the fluorophore remained unbound after incubation and was washed away.
Figure 3.

Serial DIC and fluorescence microscopy studies. (A) 3T3/HER2+ cells were incubated at 10 μg/ml of either traztuzumab–Alexa 1:1, or traztuzumab–Alexa 1:8 for 1 or 8 h. The fluorescence signal is distributed uniformly on cell surface after 1 h, and can be seen within the cell after 8 h. Self-quenched conjugated demonstrates a higher fluorescence signal following internalization. (B) Conjugates were incubated in BALB/3T3 (HER-2−) cells. No fluorophores appeared to be bound or internalized by the cells. Magnification: 400×. DIC exposure time: 500 μs. Fluorescence exposure time: 100 ms.
3.4. Change in fluorescence lifetime reflects cellular internalization of probe
Cell pellet studies were performed to investigate the effects of cellular internalization on the fluorescence lifetime of the probe. Trastuzumab–Alexa 1:1 conjugate average lifetime was 0.83±0.05 ns when bound by HER2+ cells, which increased to 0.86±0.01 ns upon cellular internalization. Trastuzumab–Alexa 1:8 conjugation demonstrated an average lifetime of 0.55±0.02 ns, increasing to 0.71±0.03 ns upon cellular internalization, a 29% increase in lifetime. Again, molecular probes with larger quenching efficiencies had larger increases in fluorescence lifetime after cellular internalization (Fig. 4). There was no fluorescence signal recorded from the HER2− cell line, indicating that, as expected, HER2− cells did not bind the probe. As a result there are no fluorescence lifetime values for the HER2− cell pellets.
Figure 4.
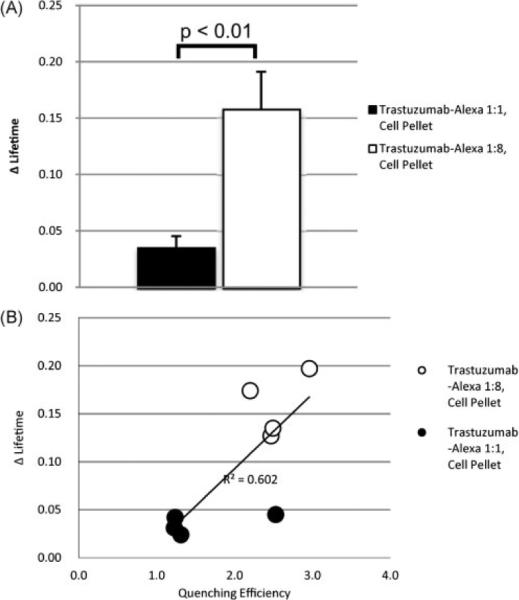
(A) Demonstrates the significantly greater increase (p < 0.01) in lifetime secondary to cellular internalization by HER2+ cells; n=4. (B). A positive correlation between quenching efficiencies and lifetime is again observed.
3.5. In vivo spectral and fluorescence lifetime imaging
Utilizing trastuzumab–Alexa 1:8, spectral and fluorescence lifetime imaging was performed on 7 mice with both HER2+ and HER2− tumors. With the exception of one mouse, there was no significant difference between the HER2+ and HER2− tumors (0.87±0.24 and 0.87±0.28 ns, respectively, when excluding the positive result), although we could observe the fluorescence signal from the HER2+ tumors in the spectral FII. In one mouse, a 0.1 ns increase in lifetime was noted in the HER2+ tumor vs the HER2− tumor (Fig. 5).
Figure 5.
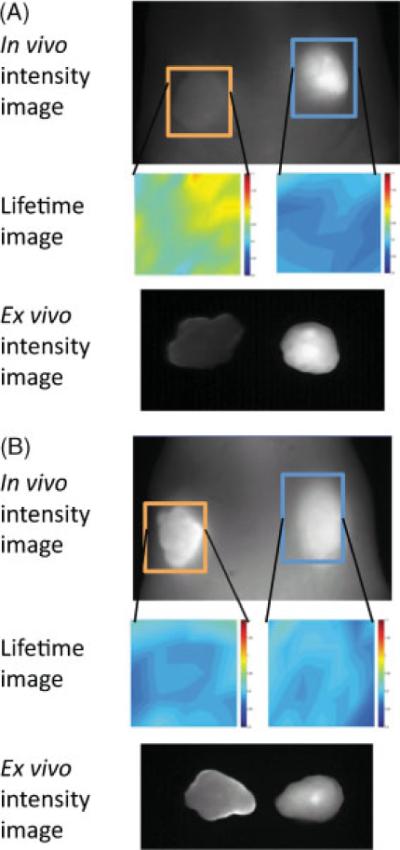
Black and white images are in vivo spectral fluorescence images showing dorsum of tumor-bearing mice and ex vivo resected tumors, unmixed to select for Alexa Fluor 750. The orange box represents the HER-2+ region of interest (ROI), and the blue box represents the HER-2- ROI. Lifetime images corresponding to each ROI are directly beneath the ROI. Lifetimes are displayed on a pseudocolor scale, ranging from 0.8 to 1.1 ns. (A) The one mouse with increase in lifetime in the HER-2+ tumor as opposed to the HER-2−; (B) no difference between the HER-2+ and HER-2- tumors, which was the more consistent finding.
4. DISCUSSION
In vivo fluorescence molecular imaging is capable of distinguishing cancers by their cell surface receptors (27). Research into targeted, activatable molecular probes has led to significant improvements in tumor to background ratios. `Activation' is a distinct advantage of optical imaging over other modalities (nuclear imaging, MRI, US), where probes usually yield the same signal whether bound or unbound to their target, leading to high background signal (from the vasculature or extracellular interstitium) (28). As an alternative to measuring alterations in fluorescence intensity, we have demonstrated the design of a probe, trastuzumab–Alexa 1:8, which reflects cellular internalization through fluorescence lifetime, demonstrating another approach to activatiable probe development.
We have demonstrated that the dequenching upon internalization of a tumor-specific molecular probe, trastuzumab–Alexa 1:8, by HER2+ cells can be monitored by fluorescence lifetime imaging. The lifetimes of the molecular probes in the quenched and unquenched states were initially characterized at pHs representative of that of the endosome following HER2 receptor-mediated internalization. Typically, multiple excited fluorophores conjugated to a single monoclonal antibody will self-quench resulting in a reduced fluorescence quantum yield (6). As quantum yield is directly proportional to fluorescence lifetime, the quenched fluorophores demonstrate shorter fluorescence lifetimes. In vitro the fluorescence lifetimes of the quenched trastuzumab–Alexa 1:8 increased significantly after dequenching with SDS, unlike the 1:1 conjugates. We attribute the increase in lifetime of the activatable probe on dequenching to the loss of the pathway of energy dissipation provided in the quenched status. In cells we were able to detect similar but smaller increase in fluorophore lifetime (lifetime increases of 50 and 39% in pH 6 and 7.2 solutions, down to a 29% increase in cell pellets) by target cells. This successfully demonstrates a robust technique for monitoring molecular probe internalization.
In vivo lifetime imaging was not as successful as the in vitro results. With the exception of the one positive result out of seven animals, the expected increase in lifetime in HER2+ vs the corresponding HER2− tumors was not seen. The fluorescence lifetime of antibody–Alexa conjugates has been previously shown to vary significantly depending on the solvent (12). We suspect that the lifetime value of 0.87 ns for both tumor types is indicative of the lifetime of the native molecular probe volume averaged with the small portion of the conjugate that was internalized within target cells. We speculate that the in vivo results are dominated by intra- or extravascular/extracellular conjugates, and not by the internalized probe. Since a previous study did not use negative control tumors in in vivo imaging studies (12), it is difficult to demonstrate whether their results were positive. Both positive and negative control tumors employed in this study are highly vascularized, with leaky vessels, resulting in some degree of nonspecific enhanced perfusion and retention. To overcome this high background, we also tried to image the mice 2 days after injection; however, the remaining fluorescence signal from the positive tumors was insufficient for analyzing the fluorescence lifetime (data not shown). To achieve a successful in vivo model, it might be necessary to use a more efficient internalizing probe and one that more rapidly clears the body (e.g. after an avidin chase) (29), allowing a larger percentage of the signal to come from internalized fluorophores as opposed to circulating and extravascular, extracellular fluorophores.
Over the past decade, optical fluorescence molecular imaging has grown significantly in capabilities. The shift to NIR fluorophores has allowed greater transmission distances in tissue, as well as reducing autofluorescence. A growing array of diverse, targeted, activateable NIR fluorophores has brought greater sensitivity and specificity. Beyond probe binding and internalization, imaging of fluorescence lifetime has the potential interrogate the physical and chemical environment of target tissues, as well as measure the rate of internalization of receptor–ligand binding pairs. We believe the strategy herein can be applied more broadly to bring the advantages of fluorescence lifetime imaging to small animal and clinical imaging techniques. Fluorescence lifetime imaging is a modality that should be further explored for in vivo activatable molecular probes.
4.1. Disclosure of potential conflicts of interest
Raphael Alford's research year was made possible through the Clinical Research Training Program, a public–private partnership supported jointly by the NIH and Pfizer Inc. (via a grant to the Foundation for NIH from Pfizer Inc.).
Acknowledgements
This research was supported by the Intramural Research Program of the NIH, National Cancer Institute, Center for Cancer Research and the Program in Physical Biology, National Institute of Child Health and Human Development.
References
- 1.Massoud TF, Gambhir SS. Molecular imaging in living subjects: seeing fundamental biological processes in a new light. Genes Dev. 2003;17:545–580. doi: 10.1101/gad.1047403. [DOI] [PubMed] [Google Scholar]
- 2.Ntziachristos V. Fluorescence molecular imaging. Annu Rev Biomed Eng. 2006;8:1–33. doi: 10.1146/annurev.bioeng.8.061505.095831. [DOI] [PubMed] [Google Scholar]
- 3.Weissleder R. Molecular imaging in cancer. Science. 2006;312:1168–1171. doi: 10.1126/science.1125949. [DOI] [PubMed] [Google Scholar]
- 4.Ogawa M, Kosaka N, Longmire MR, Urano Y, Choyke PL, Kobayashi H. Fluorophore-quencher based activatable targeted optical probes for detecting in vivo cancer metastases. Mol Pharm. 2009;6:386–395. doi: 10.1021/mp800115t. [DOI] [PMC free article] [PubMed] [Google Scholar]
- 5.Ogawa M, Regino CA, Choyke PL, Kobayashi H. In vivo target-specific activatable near-infrared optical labeling of humanized monoclonal antibodies. Mol Cancer Ther. 2009;8:232–239. doi: 10.1158/1535-7163.MCT-08-0862. [DOI] [PMC free article] [PubMed] [Google Scholar]
- 6.Ogawa M, Kosaka N, Choyke PL, Kobayashi H. In vivo molecular imaging of cancer with a quenching near-infrared fluorescent probe using conjugates of monoclonal antibodies and indocyanine green. Cancer Res. 2009;69:1268–1272. doi: 10.1158/0008-5472.CAN-08-3116. [DOI] [PMC free article] [PubMed] [Google Scholar]
- 7.Hoffman RM. The multiple uses of fluorescent proteins to visualize cancer in vivo. Nat Rev Cancer. 2005;5:796–806. doi: 10.1038/nrc1717. [DOI] [PubMed] [Google Scholar]
- 8.Hoffman RM, Yang M. Subcellular imaging in the live mouse. Nat Protocols. 2006;1:775–782. doi: 10.1038/nprot.2006.109. [DOI] [PubMed] [Google Scholar]
- 9.Hoffman RM, Yang M. Color-coded fluorescence imaging of tumor–host interactions. Nat Protocols. 2006;1:928–935. doi: 10.1038/nprot.2006.119. [DOI] [PubMed] [Google Scholar]
- 10.Kishimoto H, Zhao M, Hayashi K, Urata Y, Tanaka N, Fujiwara T, Penman S, Hoffman RM. In vivo internal tumor illumination by telomerase-dependent adenoviral GFP for precise surgical navigation. Proc Natl Acad Sci USA. 2009;106:14514–14517. doi: 10.1073/pnas.0906388106. [DOI] [PMC free article] [PubMed] [Google Scholar]
- 11.van Munster EB, Gadella TW. Fluorescence lifetime imaging microscopy (FLIM) Adv Biochem Eng Biotechnol. 2005;95:143–175. doi: 10.1007/b102213. [DOI] [PubMed] [Google Scholar]
- 12.Hassan M, Riley J, Chernomordik V, Smith P, Pursley R, Lee SB, Capala J, Gandjbakhche AH. Fluorescence lifetime imaging system for in vivo studies. Mol Imag. 2007;6:229–236. [PMC free article] [PubMed] [Google Scholar]
- 13.Clegg RM, Holub O, Gohlke C. Fluorescence lifetime-resolved imaging: measuring lifetimes in an image. Meth Enzymol. 2003;360:509–542. doi: 10.1016/s0076-6879(03)60126-6. [DOI] [PubMed] [Google Scholar]
- 14.Gannot I, Ron I, Hekmat F, Chernomordik V, Gandjbakhche A. Functional optical detection based on pH dependent fluorescence lifetime. Lasers Surg Med. 2004;35:342–348. doi: 10.1002/lsm.20101. [DOI] [PubMed] [Google Scholar]
- 15.Schaferling M, Wu M, Wolfbeis OS. Time-resolved fluorescent imaging of glucose. J Fluoresc. 2004;14:561–568. doi: 10.1023/b:jofl.0000039343.02843.12. [DOI] [PubMed] [Google Scholar]
- 16.Lakowicz JR, Szmacinski H, Nowaczyk K, Berndt KW, Johnson M. Fluorescence lifetime imaging. Anal Biochem. 1992;202:316–330. doi: 10.1016/0003-2697(92)90112-k. [DOI] [PMC free article] [PubMed] [Google Scholar]
- 17.Hanson KM, Behne MJ, Barry NP, Mauro TM, Gratton E, Clegg RM. Two-photon fluorescence lifetime imaging of the skin stratum corneum pH gradient. Biophys J. 2002;83:1682–1690. doi: 10.1016/S0006-3495(02)73936-2. [DOI] [PMC free article] [PubMed] [Google Scholar]
- 18.Hille C, Berg M, Bressel L, Munzke D, Primus P, Lohmannsroben HG, Dosche C. Time-domain fluorescence lifetime imaging for intracellular pH sensing in living tissues. Anal Bioanal Chem. 2008;391:1871–1879. doi: 10.1007/s00216-008-2147-0. [DOI] [PubMed] [Google Scholar]
- 19.Lakowicz JR, Szmacinski H, Nowaczyk K, Lederer WJ, Kirby MS, Johnson ML. Fluorescence lifetime imaging of intracellular calcium in COS cells using Quin-2. Cell Calcium. 1994;15:7–27. doi: 10.1016/0143-4160(94)90100-7. [DOI] [PMC free article] [PubMed] [Google Scholar]
- 20.Lakowicz JR, Szmacinski H, Nowaczyk K, Johnson ML. Fluorescence lifetime imaging of calcium using Quin-2. Cell Calcium. 1992;13:131–147. doi: 10.1016/0143-4160(92)90041-p. [DOI] [PMC free article] [PubMed] [Google Scholar]
- 21.Borst JW, Hink MA, van Hoek A, Visser AJ. Effects of refractive index and viscosity on fluorescence and anisotropy decays of enhanced cyan and yellow fluorescent proteins. J Fluoresc. 2005;15:153–160. doi: 10.1007/s10895-005-2523-5. [DOI] [PubMed] [Google Scholar]
- 22.Frangioni JV. In vivo near-infrared fluorescence imaging. Curr Opin Chem Biol. 2003;7:626–634. doi: 10.1016/j.cbpa.2003.08.007. [DOI] [PubMed] [Google Scholar]
- 23.Harari D, Yarden Y. Molecular mechanisms underlying ErbB2/HER2 action in breast cancer. Oncogene. 2000;19:6102–6114. doi: 10.1038/sj.onc.1203973. [DOI] [PubMed] [Google Scholar]
- 24.Murphy RF, Powers S, Cantor CR. Endosome pH measured in single cells by dual fluorescence flow cytometry: rapid acidification of insulin to pH 6. J Cell Biol. 1998;98:1757–1762. doi: 10.1083/jcb.98.5.1757. [DOI] [PMC free article] [PubMed] [Google Scholar]
- 25.Hama Y, Urano Y, Koyama Y, Bernardo M, Choyke PL, Kobayashi H. A comparison of the emission efficiency of four common green fluorescence dyes after internalization into cancer cells. Bioconjug Chem. 2006;17:1426–1431. doi: 10.1021/bc0601626. [DOI] [PMC free article] [PubMed] [Google Scholar]
- 26.Barrett T, Koyama Y, Hama Y, Ravizzini G, Shin IS, Jang BS, Paik CH, Urano Y, Choyke PL, Kobayashi H. In vivo diagnosis of epidermal growth factor receptor expression using molecular imaging with a cocktail of optically labeled monoclonal antibodies. Clin Cancer Res. 2007;13:6639–6648. doi: 10.1158/1078-0432.CCR-07-1119. [DOI] [PubMed] [Google Scholar]
- 27.Longmire M, Kosaka N, Ogawa M, Choyke PL, Kobayashi H. Multicolor in vivo targeted imaging to guide real-time surgery of HER2-positive micrometastases in a two-tumor coincident model of ovarian cancer. Cancer Sci. 2009;100:1099–1104. doi: 10.1111/j.1349-7006.2009.01133.x. [DOI] [PMC free article] [PubMed] [Google Scholar]
- 28.Elias DR, Thorek DL, Chen AK, Czupryna J, Tsourkas A. In vivo imaging of cancer biomarkers using activatable molecular probes. Cancer Biomark. 2008;4:287–305. doi: 10.3233/cbm-2008-4602. [DOI] [PubMed] [Google Scholar]
- 29.Ogawa M, Kosaka N, Choyke PL, Kobayashi H. Tumor-specific detection of an optically targeted antibody combined with a quencher-conjugated neutravidin `quencher-chaser': a dual `quench and chase' strategy to improve target to nontarget ratios for molecular imaging of cancer. Bioconjug Chem. 2009;20:147–154. doi: 10.1021/bc8003765. [DOI] [PMC free article] [PubMed] [Google Scholar]