Abstract
Flavonoids are the polyphenolic compounds with various claimed health benefits, but the extensive metabolism by uridine-5'-diphospho-glucuronosyltransferases (UGTs) and sulfotransferases (SULTs) in liver and intestine led to poor oral bioavailabilities. The effects of structural changes on the sulfonation of flavonoids have not been systemically determined, although relevant effects of structural changes on the glucuronidation of flavonoids had. We performed the regiospecific sulfonation of sixteen flavonoids from five different subclasses of flavonoids, which are represented by apigenin (flavone), genistein (isoflavone), naringenin (flavanone), kaempherol (flavonol), and phloretin (chalcone). Additional studies were performed using 4 mono-hydroxyl flavonoids with –OH group at 3, 4’, 5 or 7 position, followed by 5 di-hydroxyl-flavonoids, and 2 tri-hydroxyl flavonoids by using expressed human SULT1A3 and Caco-2 cell lysates. We found that these compounds were exclusively sulfated at the 7-OH position by SULT1A3 and primarily sulfated at 7-OH position in Caco-2 cell lysates with minor amounts of 4’-O-sulfates formed as well. Sulfonation rates measured using SULT1A3 and Caco-2 cell lysates were highly correlated at substrate concentrations of 2.5 and 10 µM. Molecular docking studies provided structural explanations as to why sulfonation only occurred at the 7-OH position of flavones, flavonols and flavanones. In conclusion, molecular docking studies explain why SULT1A3 exclusively mediates sulfonation at the 7-OH position of flavones/flavonols, and correlation studies indicate that SULT1A3 is the main isoform responsible for flavonoid sulfonation in the Caco-2 cells.
Keywords: Flavonoids, Sulfonation, Sulfation, SULT, SULT1A3, Caco-2, Molecular Docking
Introduction
Flavonoids, a class of phenolic compounds widely distributed in nature, have been postulated to possess significant biological activities in prevention of diseases such as cancer, inflammation, coronary heart diseases and other age-related illnesses (Thomasset et al., 2007; Benavente-Garcia and Castillo, 2008). Currently, chemopreventive agents using this class of compounds are yet to be approved, and their low bioavailabilities is one of the top reasons why their development was impeded(Galijatovic et al., 2001; Lee et al., 2008). Many studies from this and other laboratories have demonstrated that extensive first-pass metabolism by phase II conjugating enzymes including uridine-5'-diphosphoglucuronosyltransferases or UGTs and sulfotransferases or SULTs causes the observed low bioavailabilities (Boutin et al., 1993; Joseph et al., 2007).
Flavonoids including flavones and flavonols are known to have low oral bioavailabilities (Ross and Kasum, 2002). Although flavonols such as kaempferol and quercetin were mainly present as glucuronides after oral administration (de Vries et al., 1998; Moon et al., 2000), significant amounts of sulfates were also found (Moon et al., 2000). In the mouse intestine, a significant portion of the absorbed aglycones such as genistein and apigenin were conjugated and both sulfates and glucuronides were excreted into the lumen (Liu et al., 2003). Thus, the published studies provided strong evidence that rapid conjugation via sulfonation is one of the main reasons for flavonoids’ low bioavailabilities in vivo . Sulfonation reactions are catalyzed by several members of the SULT superfamily, which play important roles in the regulation of the levels and activities of flavonoids.
Mammalian cytosolic SULTs have been divided into several gene families and subfamilies based on their amino acid sequences identity and catalytic properties (Glatt et al., 2001). Human SULT1A3 is one of the most important SULT1 isoforms for the metabolism of phenolic compounds and a good model isoform for investigating structure–activity relationship(Lu et al., 2005). In addition, preliminary data suggested that this isoform is highly active against flavonoids compared to other SULT isoforms such as SULT1A1 and SULT1E1 (not shown). Moreover, expression studies in Caco-2 TC-7 cells showed that SULT1A3 was the most abundant SULT isoform found in these cells (Meinl et al., 2008). Caco-2 TC-7 cells are a model of the human intestinal epithelial cells. Originally derived from human colon cancer, Caco-2 cells possess many of the properties of the normal human small intestinal cells including expression of various phase II enzymes (such as UDP-glucuronosyltransferase, sulfotransferase, etc ) known to be present in normal human enterocytes. Caco-2 cells are a useful and well-accepted tool for studying the metabolic characteristics of flavonoids in vitro (Galijatovic et al., 2001; Murota et al., 2002; Walle and Walle, 2002; Chen et al., 2003; Hu et al., 2003; Zhang and Morris, 2003; Svehlikova et al., 2004)
Previously, many laboratories including ourselves have determined the effects of structural changes on the glucuronidation of flavonoids using the Caco-2 models, animal intestinal models, animal and human microsomes, and expressed human UGTs (Chen et al., 2005; Wang et al., 2006; Tang et al., 2009; Tang et al., 2010). However, there did not appear to be any systematic studies on the effects of structural changes on the sulfonation of flavonoids. In one recent study of 2 catechins and 2 flavanones, it was shown that they inhibited the sulfonation by multiple SULT isoforms including SULT1A3 at very high concentrations, (Huang et al., 2009) not highly relevant to in vivo conditions where the concentrations are much lower.
Therefore, the purpose of this study was to determine how structural changes affect the sulfonation of the flavonoids using SULT1A3 and Caco-2 cell lysates. There were a total of 16 flavonoids used in this study. Five different subclasses of flavonoids are represented by apigenin (flavone), genistein (isoflavone), naringenin (flavanone), kaempherol (flavonol), and phloretin (chalcone) and these five compounds are analogs of apigenin, all with 3 hydroxyl groups at 4’,5,7 positions, although kaempherol also has a 3-OH group. We then determined the sulfonation of 4 mono-hydroxyl flavonoids with –OH group at 3, 4’, 5 or 7 position, followed by 5 di-hydroxyl-flavonoids, and 2 additional tri-hydroxyl flavonoids. Molecular docking techniques were then used to explain the observed positional preference in sulfate formation by examining the potential binding sites of these flavonoids inside active pockets of SULT1A3 crystal structures.
Materials and Methods
Materials
Naringenin, phloretin, genistein, apigenin, kaempferol, 3-hydroxyflavone, 4’-hydroxyflavone, 5-hydroxyflavone, 7-hydroxyflavone, 5,4-dihydroxyflavone, 5,7-dihydroxyflavone, 7,4’-dihydroxyflavone, 3,4’-dihydroxyflavone, 3,7-dihydroxyflavone, 3,5,7-rihydroxyflavone and 3,7,4’-trihydroxyflavone were purchased from Indofine Chemicals (Somerville, NJ). Expresses human SULT isoforms were purchased from XenoTech LLC (Lenexa, KS). 3’-Phosphoadenosine-5’-phosphosulfate (PAPS) and sulfatase from Aerobacter aerogenes were purchased from Sigma-Aldrich (St. Louis, MO). All other materials, analytical grade or better, were used as received.
Sulfonation Activities of Expressed Human SULT1A3
Sulfonation activities of flavonoids in expressed human SULT1A3 were measured using the published procedures with minor modifications (Chen et al., 2005). All experiments were performed in triplicates. Briefly, expressed SULT1A3 (final protein concentration of about 0.00248~0.00493 mg/ml) was mixed with flavonoids (final concentration of 2.5 or 10µM) in 50 mM potassium phosphate buffer (pH 7.4). The cofactor PAPS (0.1 mM, final concentration) was added last to the reaction mixture (total volume 200 µl), and the mixture was incubated in a 37°C shaking water bath (speed=200 rpm) for 5~30 min. The shorter reaction time (5 min) was for compounds that were rapidly metabolized to ensure that percentages metabolized would not exceed 35%, which is the upper linear range in the amount of sulfate formed vs. time curve. The longer reaction time was used to ensure that slowly metabolized compounds will have produced a reasonable peak area for accurate measurement (above the lowest quantifiable concentration in the linear response range). More detailed description of the various reaction time and enzyme quantities were present in Supplemental Materials.
Two substrate concentrations were used for the characterization studies since characterization should be performed at two or more concentration. The low concentration (2.5 µM) was chosen here because it was close to the Km values (reported here or elsewhere) and we did not use a lower concentration much less than 2.5 µM (e.g., 1 µM) because molecular extinction coefficients of some compounds precluded the determination of their metabolite concentrations at a substrate concentration much less than 2.5 µM. The high concentrations were chosen because the rates of formation at this concentration were usually close to the Vmax values. In any rate, at a substrate concentration of 2.5 µM, the final enzyme protein concentration (in the reaction mixture) was 0.00248 mg/ml for 3,7DHF, 3,5,7THF, 0.00493 mg/ml for naringenin, apigenin, kaempferol, 7HF, 5,4’DHF, 5,7DHF, 7,4’DHF, 3,7,4’THF. The incubated time was 5 min for naringenin, apigenin, kaempferol, 7HF, 5,4’DHF, 5,7DHF, 7,4’DHF, 3,7DHF, 3,5,7THF, and 3,7,4’THF, but 30 min for phloretin, genistein, 4’HF, 5HF, 3HF, and 3,4’DHF. Different incubation time was necessary to ensure that percentages of a substrate metabolized did not exceed 35% but enough metabolite was formed to facilitate detection by UV. At the substrate concentration of 10 µM, the final enzyme protein concentration was same as the substrate concentration at 2.5 µM for every compounds, but the incubated time was 10 min for naringenin, apigenin, kaempferol, 7HF, 5,4’DHF, 5,7DHF, 7,4’DHF, 3,7DHF, 3,5,7THF, and 3,7,4’THF, but 30 min for phloretin, genistein, 4’HF, 5HF, 3HF, and 3,4’DHF. The reaction was stopped by the addition of 50 µl solution, consisted of 94% acetonitrile and 6% formic acid containing 100 µM of testosterone or 100 µM of 5-hydroxyflavone as the internal standard. Testosterone was used as internal standard for naringenin, phloretin, genistein, 3HF,4’HF, 5HF, 7HF, 7,4’THF, 3,7,4’THF, 5,7,4’THF (apigenin), and 3,5,7,4’QHF (kaempferol); whereas 5-hydroxyflavone for 3,7DHF. 5,7DHF, 5,4’DHF, and 3,5,7THF. The reaction mixture containing the internal standard was centrifuged at 13,000 rpm for 20 min, and the supernatant was directly subjected to UPLC for analysis.
For the determination of kinetic profile of sufonation, four flavonoids (i.e., 7HF, 7,4’DHF, 3,7DHF, 5,7DHF) in the concentration range of 0.039–20 µM were used. This concentration range was used because of our prior experience with study of sulfonation of apigenin by Caco-2 TC cell lysates (Hu et al., 2003).
Cell Culture
Cloned Caco-2 cells, TC-7 were a kind gift from Dr. Monique Rousset of INSERM U178 (Villejuit, France). The Caco-2 cells have been routinely used in this lab for more than two decades, and in here the culture conditions for growing Caco-2 cells were the same as those described previously (Chen et al., 2005; Tang et al., 2009). The cells were used 14 days after seeding in the current study.
Preparation of Caco-2 cell Lysate for Sulfonation Studies
Cell lysates were prepared using freshly collected Caco-2 cells, and used for measuring rates of sulfates formation. For cell lysate preparation, cells were first washed in ice-cold PBS (pH7.4) and scraped off and put into in a centrifuge tube. After it is centrifuged at 3000rpm for 2 minutes, the supernatant was removed, and cell pellets were mixed with ice-cold mM pH 7.4 potassium phosphate buffer. The cell suspension was sonicated using Aquasonic 150D sonicator (VWR Scientific, Bristol, CT) for 30 min in short pulses at the maximum power (135 average watts) in an ice-cold water bath (the temperature is −0°C). The resulting cell lysate was then harvested and pooled. It was used fresh or frozen at −80°C until use, for measuring the rates of conjugate formation (sulfonation activities were maintained at −80°C with a single defrosting action). The protein concentration of the cell lysate was determined using the BCA protein assay, using the bovine serum albumin as the standard.
Measurement of Sulfonation Activities in Caco-2 Cell Lysates
The incubation procedures for measuring sulfonation activities using Caco-2 cell lysates were similar to those using expressed human SULT1A3 except the concentration of Caco-2 cell lysates in the final reaction mixture was about 0.465~1.86 mg/ml. All reactions were performed in triplicates. The reaction time was adjusted to 5~60 min (except for genistein, where a reaction time of 480 min) for the different flavonoids, and the reason for using different reaction time here is the same as those stated previously when using SULT1A3. The substrate concentrations were again 2.5 and 10 µM, same as those used for SULT1A3. Sulfonation activities are expressed in nanomoles per minute per milligram of protein for Caco-2 cell lysates.
UPLC Analysis of Flavonoids and Their Sulfates
Flavonoids as well as their respective sulfates were analyzed by a common chromatographic method: system, Waters Acquity UPLC with photodiode array detector and Empower software; column, BEH C18, 1.7 µm, 2.1 × 50 mm; mobile phase A, 100% aqueous buffer (2.5mM NH4Ac, pH 7,4 ); mobile phase B, 100% acetonitrile,; flow rate 0.45 ml/min; gradient, 0 to 2.0 min, 10–30% B (or mobile phase B), 2.0 to 3.0 min, 30–40% B, 3.0 to 3.5 min, 40–60% B, 3.5 to 4.0 min, 60–90%, 4.0 to 5.0 min, 90%–10% B, 5.0 to 5.5 min, 10% B and injection volume, 10µl. Naringenin, phloretin and their respective sulfates were analyzed at 286 nm, genistein, kaempferol, 3HF and their respective sulfates were analyzed at 254 nm. Apigenin, 3,4’DHF, 3,7DHF, 5,4’DHF, 7,4’DHF, 3,7,4’THF and their respective sulfates were analyzed at 340 nm. 4’HF, 7HF and their sulfates were analyzed at 320nm and 310nm respectively. 5HF, 5,7DHFand their respective sulfates were analyzed at 268nm. 3,5,7THF and 3,5,7THF-sulfates were analyzed at 263nm. Linearity was established in the range of 0.3–10 µM (a total of 6 concentrations were used) for 5HF and 0.3–20 µM (a total 7 of concentrations were used) for other compounds. Analytical methods for each compound were validated for inter-day and intra-day variation using six samples at three concentrations (20, 5 and 0.625 µM). Precision and accuracy for all compounds were in the acceptable range of 85% to 115%.
Quantification of Flavonoid Sulfates
Since standards of flavonoid sulfates of tested compounds could not be obtained commercially, a previously published method(Singh et al., 2010) was adapted for quantification of sulfates although that method was originally developed to quantify glucuronides. Briefly, the increase in peak area of aglycone was compared with the decrease in the peak area of sulfate after hydrolysis by sulfatase. Because 1 mol metabolite generates 1 mol aglycone as the result of hydrolysis, the change in concentration of aglycone as the result of hydrolysis can be expressed as
| (1) |
where ΔPFS is the change in peak areas of flavonoid sulfate (or FS),ΔPF is the change in the peak area of its corresponding flavonoid aglycone (or F) obtained from the extracted samples before and after hydrolysis, and αF and αFS are the slopes of the corresponding calibration curve that goes through the origin.
Equation 1 can be rearranged so that the term αFS was expressed in term of αF:
| (2) |
where K represents the conversion factor of molar extinction coefficients of sulfates to their corresponding aglycones. To calculate the metabolite concentration (CFS ), CFS should be represented by ΔPFS and ΔPS through the conversion factor K, which be provided as an average value determined at three different substrate concentrations:
| (3) |
where PFS is the peak area of sulfates. Therefore, the concentrations of sulfates could be estimated using the corresponding calibration curve of the aglycones.
Confirmation of Flavonoid Sulfates Structure by LC-MS/MS
An API 3200 QTrap triple quadrupole mass spectrometer (Applied Biosystem/MDS SCIEX, Foster City, CA), operated in negative ion mode, was used for identification of the sulfates of flavonoids. The main working parameters for the mass spectrometers were set as follows: ion spray voltage, −4.0 kV; ion source temperature, 400°; the nebulizer gas (gas 1), zero air, 40 psi; turbo gas (gas 2), zero air, 40 psi; curtain gas, nitrogen, 20 psi. Flavonoids metabolites were identified by MS full scan and MS2 full scan modes. The condition for separating flavonoids and their sulfates were achieved by the same UPLC system and using the same chromatographic conditions stated above. For preparation of concentrated sulfate samples for identification purpose, the sulfates were separated by solid phase extraction from the sulfonation experimental samples, and re-constituted in smaller volume of 30% acetonitrile in water (i.e., concentrated).
Kinetics of Sulfonation
Rates of metabolism in expressed human SULT1A3 were expressed as amounts of metabolites formed per min per mg protein or nmol/min/mg. Kinetic parameters were then obtained based on the fit to various kinetic equations shown below based on profiles of Eadie–Hofstee plots as described previously(Wang et al., 2006). If Eadie-Hofstee plots were linear, formation rates (V) of flavonoids sulfates at various substrate concentrations (C) were fit to the standard Michaelis-Menten equation:
| (4) |
where Km is the Michaelis constant and Vmax is the maximum rate of sulfonation.
When Eadie-Hofstee plots showed characteristic profiles of atypical kinetics (sigmoidal autoactivation and biphasic kinetics), the data from these atypical profiles were fit to Eq. 5 or 6, using the ADAPT II program. To determine the best-fit model, the model candidates were discriminated using the Akaike’s information criterion (AIC), and the rule of parsimony was applied. With regard to data showing sigmoidal kinetics, this model was simply a rewriting of a Hill equation, those formation rates (V) of flavonoids sulfates at various substrate concentrations (C) were fit to the following equation:
| (5) |
where Vmax is the maximum activation of enzyme activity, C is the concentration of substrate and Km is the concentration of substrate to achieve 50% of Vmax, and n is the Hill coefficient.
The following equation (Eq. 6) describes enzyme reactions with biphasic kinetics:
| (6) |
where Vmax1 is the maximum enzyme velocity of the high affinity phase, Vmax2 is the maximum velocity of the low affinity phase, Km1 is concentration of substrate to achieve half of Vmax1 for the high-affinity phase, and Km2 is concentration of substrate to achieve half of Vmax2 for the low-affinity phase.
When the enzymatic reactions showed substrate inhibition kinetics (in which the substrate compound inhibits the sulfonation, especially at higher concentrations), formation rates (V ) of flavonoid sulfates at various substrate concentrations (C ) were fit to the following equation:
| (7) |
where Vmax1 is the maximum formation rate, C is the substrate concentration, Km1 is the concentration of substrate to achieve 50% of (Vmax1), and Ksi is the substrate inhibition constant.
Statistical Analysis
One-way ANOVA with or without Tukey-Kramer multiple comparison (posthoc) tests were used to evaluate statistical differences. Differences were considered significant when p values were less than 0.05 (or p<0.05).
Molecular Docking Analysis
Molecular docking was employed to explain the apparent regiospecificity of SULT1A3. To this end, we docked all flavonoids into the catalytic site of the SULT1A3 crystal structure. These chemical structures were minimized with root mean square gradient of 0.000001 in MOE (Chemical Computing Group, Montreal, CA) based on MMFF94x force field and partial charges. The docking program GOLD (CCDC, Cambridge, UK) was used to perform docking of these compounds against the crystal structure of SULT1A3 (PDB entry code: 2A3R) (Lu et al., 2005). Hydrogen atoms were added in GOLD and default parameters were used unless otherwise stated. The co-crystallized substrate dopamine was removed from the structure, but the PAPS co-factor was kept as part of the protein. No structural water molecules were observed in the active site and hence all water molecules were deleted.
Based on the complex structure and literature reports (Liu et al., 2000; Lu et al., 2005), the active site was defined to include the following residues: Tyr23, Pro47, Lys48, Thr51, Tyr76, Val84, Tyr139, Ala148, Ser168, Tyr169, Leu247, Met248, Phe255, and A3P296 (PAPS). Additional ten residues were also considered as part of the binding site and they were treated as flexible during docking (the maximum number allowed by GOLD: Ile21, Phe24, Phe81, Asp86, Lys106, His108, Phe142, Glu146, His149, and Tyr240. The maximum ligand flexibility and maximum search efficiency was applied during docking runs. To evaluate the regiospecificity of the sulfonation reactions, a distance constraint (5.0Å~6.5Å) from the 7-OH of each substrate was applied to the sulfate group of PAPS. Additionally, two hydrogen bonding constraints were applied from the 7-OH of each ligand to the imidazole of His108 and amine group of Lys106 on SULT1A3, because these hydrogen bonding interactions were observed in the crystal structure and His108 is the catalytic residue for the sulfonation reaction. The top five docked solutions for each ligand were retained for analysis.
RESULTS
Confirmation of flavonoid sulfate structures by LC-MS/MS
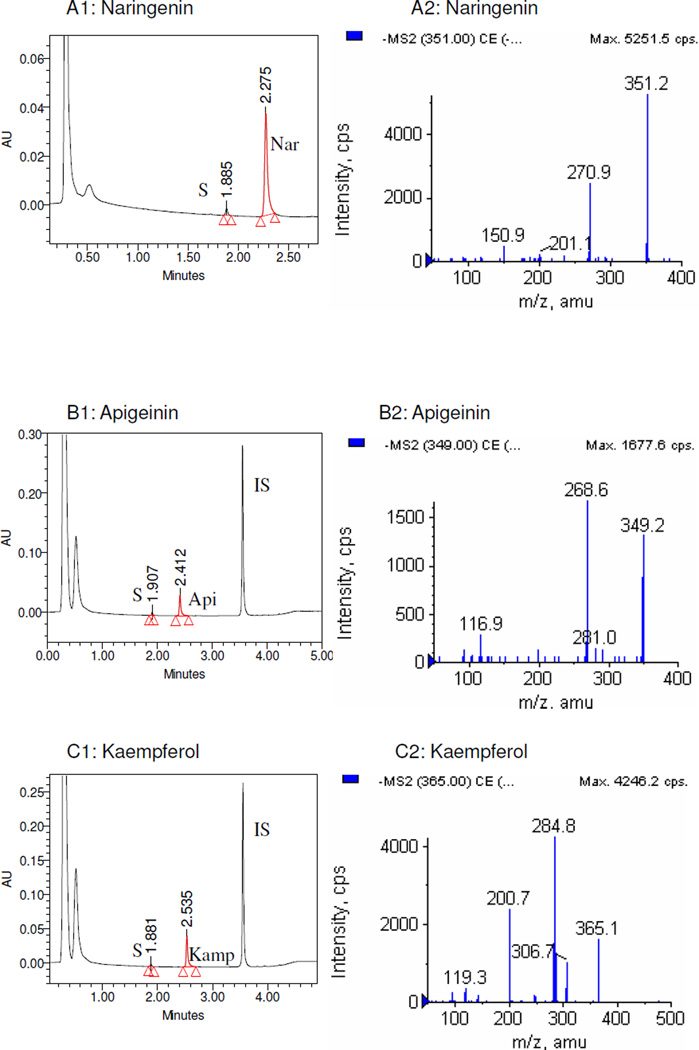
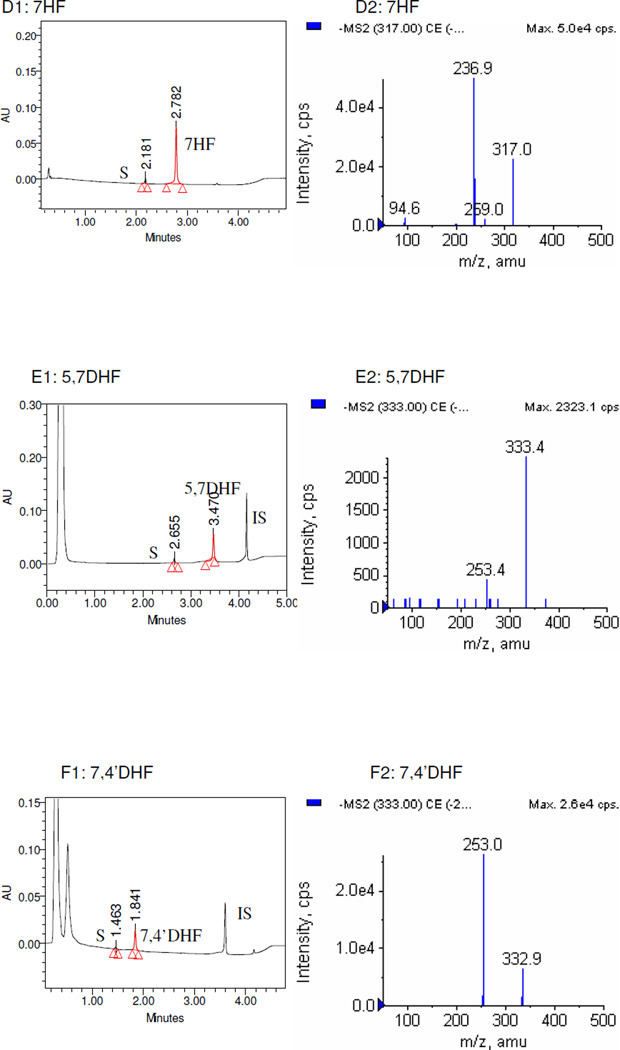
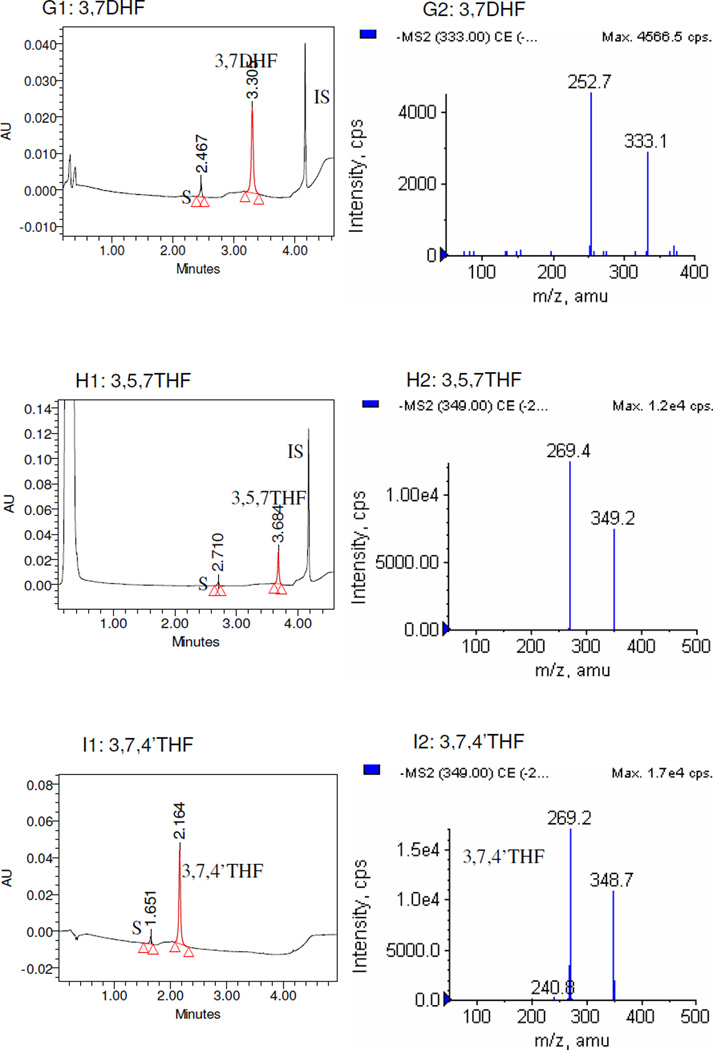
The LC-MS/MS studies of the metabolites showed that all sulfates generated in this study were mono-sulfates (Figure 1), and no disulfates of any flavonoids were found. For 3HF, 4’HF, 5HF, 3,4’DHF and genistein, sulfates were not detected when SULT1A3 was used under the conditions described in the Materials and Method section.
Figure 1. UPLC and LC-MS/MS profile of flavonoids and their mono-O-sulfates.
Only flavonoids with significant amounts of sulfates formed were shown. Left panels (panels A1-I1) of each pair showed the UPLC-UV trace with the retention time of each flavonoid, its respective metabolite(s) (S), and internal standard (IS). Since the chromatograms of Nar, 7HF, and 3,7,4’-THF were collected at 286 nm, 320 nm, and 340 nm respectively, their IS (100 µM testosterone) were not showed in the graph. The right panels (panels A2-I2) of each pair showed MS2 spectra of the corresponding flavonoid-7-O-monosulfates.
Determination of the conversion factors for quantification of sulfates
The conversion factors for individual sulfates of flavonoids were determined in order to quantify the amounts of sulfates formed. The condition at which these conversion factors were generated including the wavelength, types of enzymatic preparation used (Caco-2 cell lysates or SULT1A3), and the conversion factor for each sulfate was listed in Table 2. The conversion factors were in the range of 0.501 (for 3,5,7-THF-7-O-sulfate) to 1.583 (for 3HF-3-O-sulfate).
Table 2.
The conversion factors (K) of various flavonoid-7-O-monosulfates.
| Compounds | conversion factors (K) |
Wavelength (nm) used |
|---|---|---|
| Nar | 1.236 | 286 |
| Phlor | 0.511 | 286 |
| Gen | 1.051 | 254 |
| Api (5,7,4’THF) | 1.190 | 340 |
| Kamp (3,5,7,4’QHF) | 0.806 | 254 |
| 4’HF | 0.824 | 320 |
| 5HF | ND | 268 |
| 7HF | 1.46 | 310 |
| 5,4’DHF | 0.960 | 340 |
| 5,7DHF | 1.198 | 268 |
| 7,4’DHF- | 1.041 | 340 |
| 3HF | 1.583 | 254 |
| 3,4’DHF | 0.873 | 340 |
| 3,7DHF | 1.46 | 340 |
| 3,5,7THF | 0.501 | 263 |
| 3,7,4’THF | 1.044 | 340 |
ND: not determined since no sulfate of 5HF was found.
Sulfonation of flavonoids by expressed human SULT1A3
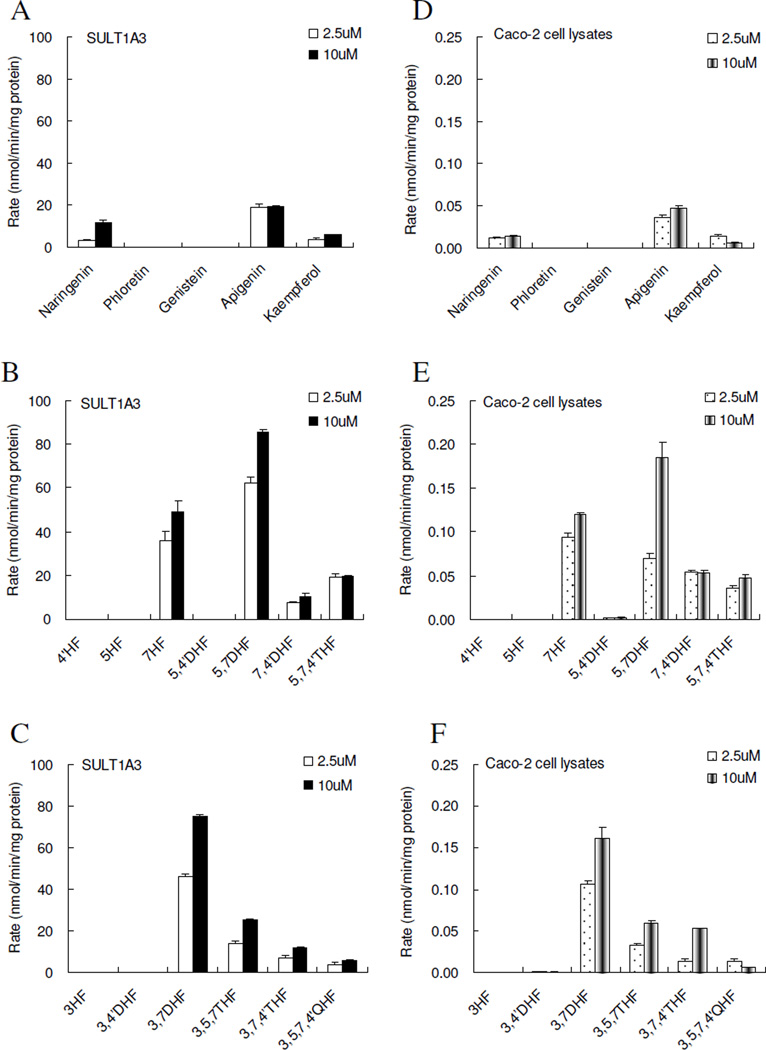
Among the sixteen flavonoids, SULT1A3-mediated sulfonation of 5 flavonoids (naringenin, phloretin, genistein, apigenin and kaempferol), which were from 5 different sub-classes of flavonoids, was used to determine the effects of backbone change. The sulfonation rates of flavonoids at the substrate concentration of 2.5 µM by expressed SULT1A3 followed the following rank order: apigenin (19.00 ± 1.58) > kaempferol (3.78 ± 0.79) ~ naringenin (3.21 ± 0.36)> genistein~ phloretin (0 nmol/hr/mg protein) (Figure 2A). Apigenin which belongs to flavone subclass showed the fastest sulfonation rates, whereas genistein (an isoflavone with phenol at C-3 position) and phloretin (a chalcone with open ring) showed extremely weak or undetectable sulfonation. Addition of a free hydroxyl group at C-3 as in flavonols (kaempferol) or saturation of the double bond at C2–C3 as in flavanones (naringenin) appeared to similarly reduce the sulfonation as compared to flavones (apigenin). The rank order of the sulfonation rates at 10 µM showed slight variation compared to those at 2.5µM: apigenin (19.36 ± 0.41) > naringenin (12.03 ± 0.94) > kaempferol (5.77 ± 0.22) > genistein~ phloretin (0) nmol/hr/mg protein (Figure 2A).
Figure 2. Sulfonation of flavonoids by expressed human SULT1A3 (left three panels) and Caco-2 cell lysates (right three panels).
Flavonoids were from 5 apigenin analogs representing five sub-classes of flavonoids (A, D), 6 flavones (B. E), and 6 flavonols (C, F). Experiments were conducted at the concentration of 2.5 µM (open column) and 10 µM (solid column). Amounts of mono-sulfate(s) formed were measured using UPLC, and quantified using the correction factors shown in Table 2. Rates of sulfonation were calculated as nmol/min/mg of protein. Each bar is the average of three determinations, and the error bars are the standard deviations of the mean (n=3).
The sulfonation rates of a congeneric series of flavonoids in the flavone sub-class (5,4’DHF,5,7DHF, 7,4’DHF and 5,7,4’THF, also included 4’HF, 5HF and 7HF) were used to determine how sulfonation rates would change as a function of the number and position of hydroxyl groups on the same backbone. At 2.5 µM, sulfonation rates of 5,7DHF (62.30 ± 2.54 nmol/hr/mg of protein) was the fastest, followed by 7HF (35.66 ± 4.72), 5,7,4'THF (19.00 ± 1.58), 7,4'DHF (7.54 ± 0.34), 4'HF (0) and 5HF(0) nmol/hr/mg protein (Figure 2B). The sulfonation rates at 10µM showed essentially the same rank order: 5,7DHF(85.37 ± 1.53) > 7HF(48.92 ± 5.18) > 5, 7, 4’, THF(19.36 ± 0.41) > 7,4’DHF(10.30 ± 1.64) nmol/hr/mg protein (Figure 2B ). It is interesting to note that sulfonation rates of flavonols without 7-OH group (4’HF and 5HF) were too slow to be detected.
The sulfonation rates of another congeneric series of flavonoids in the flavonol subclass (3HF, 3,4’DHF, 3,7DHF, 3,5,7THF, 3,7,4’THF, 3,5,7,4'QHF) were also used to determine the effects of changes in number and position of hydroxyl groups on the SULT1A3-mediated reaction rates. At a concentration of 2.5µM, the sulfonation activity followed the rank order of: 3,7DHF (45.84 ± 1.53) > 3,5,7THF (13.88 ± 1.21) > 3,7,4'THF (6.80 ± 1.28) > 3,5,7,4’QHF (3.78 ± 0.79) > 3,4’DHF (0) ~3HF (0) nmol/hr/mg of protein (Figure 2C). At 10 µM, flavonol sulfonation followed the same rank order of: 3,7DHF (74.69 ± 1.05) > 3,5,7THF (24.98 ± 0.49) > 3,7,4’THF (11.79 ± 0.33) > 3,5,7,4'QHF (5.77 ± 0.22) > 3,4’DHF (0) ~3HF (0) nmol/hr/mg of protein (Figure 2C), although the actual rates did change. Here, the sulfonation rate of 3,7 DHF was the fastest, which was highly significant different (p<0.05) from the other compounds in this series. Again, compounds without 7-OH group were not sulfated.
Sulfonation of flavonoids by SULTs in Caco-2 cell lysates
Many investigators have shown that Caco-2 cells can sulfonate flavonoids and secret flavonoid sulfates (Walle et al., 1999; Murota et al., 2002; Hu et al., 2003; Chen et al., 2005; Zhang et al., 2007). Here we performed a systematic study to determine how changes in structure of flavonoids affect their sulfonation in Caco-2 cell lysates, which are known to express high level of SULT1A3 (Meinl et al., 2008).
For the flavonoids from the five sub-classes (naringenin, phloretin, genistein, apigenin and kamperferol), the pattern of metabolism as reflected by the rank order was almost the same as those observed using SULT1A3 (Figure 2D), except that kaempferol was metabolized a bit faster at lower concentration than anticipated from SULT1A3 data (Figure 2D). In addition, the rates were generally much slower than those using expressed human SULT1A3, suggesting that the expression level of the expressed SULT is quite high (>500 fold enrichment), suggesting that the expression system is of high quality.
Correlation of sulfonation rates obtained using SULT1A3 and Caco-2 cell lysates
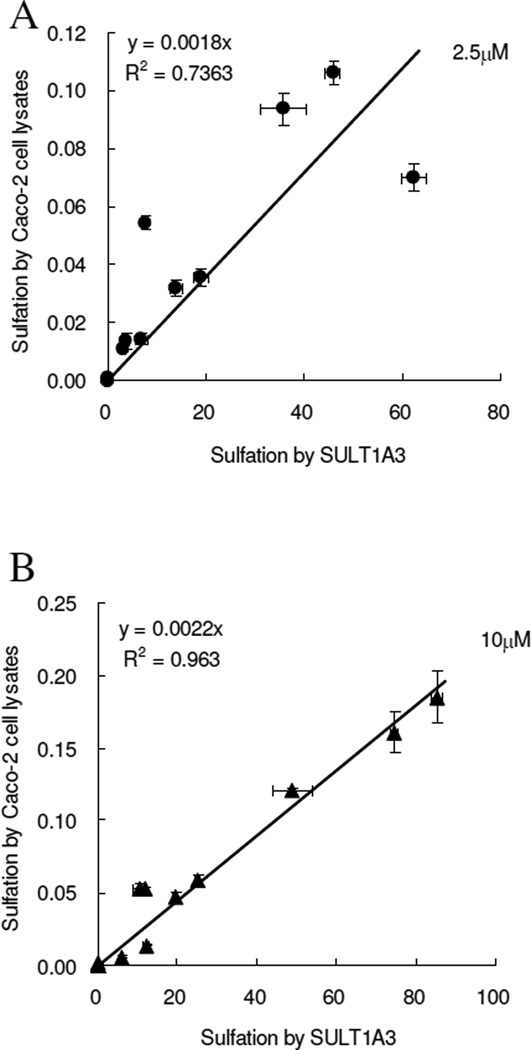
To determine if the SULT1A3 is the major isoform responsible for sulfonation of flavonoids, correlations between the SULT1A3-mediated sulfonation rates and sulfonation rates in Caco-2 cell lysates were established at the substrate concentration of 2.5µM and 10 µM (Figure 3). The results showed the correlation coefficient at 2.5 µM was 0.736 when we set the intercept of the regression line to zero, and was 0.764 when it was not (not shown). At 1µM substrate concentration, the correlation coefficient was 0.963 when the regression line was forced through the origin, and was 0.966 when the line was not forced through the origin (not shown).
Figure 3. Correlation of sulfonation rates obtained from SULT1A3 with those obtained from Caco-2 cell lysates.
Linear regression was used to derive apparent correlations. The sulfonation rates of flavonoids by expressed human SULT1A3 and Caco-2 cell lysates were calculated the same as describes in Figure 2. In panel A, the correlation of sulfonation between SUIT1A3 and Caco-2 cell lysates at the substrate concentration of 2.5 µM (R2=0.7363), and the one of that at the substrate concentration of 10 µM (R2=0.963) is showed in panel B. Each bar is the average of three determinations, and the error bars are the standard deviations of the mean (n=3).
There were strong correlations between formation rates of sulfates derived from Caco-2 cell lysates and those derived from SULT1A3 (Figure 3). The correlation was better at 10 µM than at 2.5 µM, perhaps because reaction rates at higher concentration approached that of the Vmax values, although the exact reason for this is unclear.
Kinetics of flavonoid sulfonation by SULT1A3
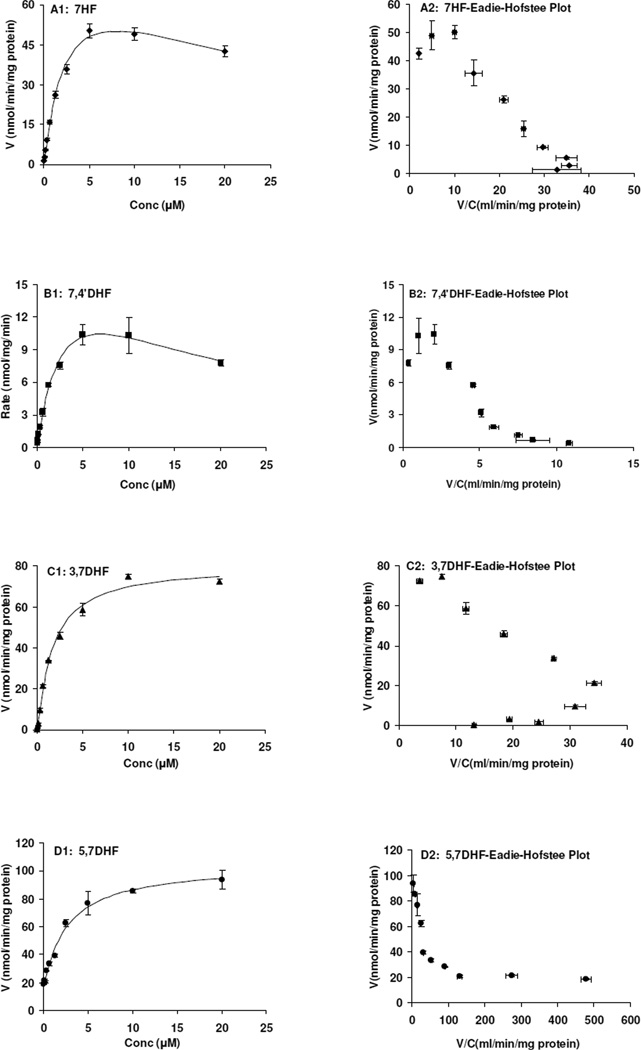
We determined the kinetics of sulfonation of four flavonoids. Starting with 7-HF, we determined how addition of one hydroxyl group at 3, 5, and 4’ position affected the kinetics of sulfonation. This study was conducted because the effects of adding one hydroxyl group had inconsistent effects on sulfonation rates at the two concentrations (2.5 and 10 µM) investigated, in that addition of these groups at 2.5 µM usually decreased the rates (Figure 2), whereas addition of the same groups at 10 µM usually increased the rates (Figure 2).
The results of the kinetic studies showed that sulfonation of 7HF followed substrate inhibition kinetics (Figure 4A1, 4A2), with Km value of 2.80 µM and Vmax of 85.1 nmol/min/mg or an intrinsic clearance (CLint) value of 30.4 ml/min/mg protein (Table 3). Addition of 4’-OH group did not change the binding characteristics (Figure 4B1, 4B2), and resulted in similar Km value (3.42 µM). However, the Vmax values were much smaller, suggesting that addition of 4’-OH really affected the turnover rate of the reaction. In other words, addition of 4’-OH decreased the capacity of SULT1A3 to form flavonoid-7-sulfate. Indeed, addition of 4’-OH group to 5,7-DHF or 3,5,7-THF all decreased the sulfonation rates at 10 µM.
Figure 4. Kinetics of 7HF (A1), 7,4’DHF (B1), 3,7DHF (C1) and 5,7DHF (D1) sulfonation by SULT1A3.
The sulfonation rates were determined at the concentration range of 0.04 to µM. The reaction time was controlled so that substrate concentration did not decrease substantially (usually less than 30%) at the end of experiments, which lasted for of up to 30 min. Each point is the average of three determinations, and the error bars are the standard deviations of the mean (n=3). In the right four panels (panels A2-D2), the Eadie-Hofstee plots which were indicative of the mechanism of reaction kinetics were showed. The apparent kinetic parameters and the fitting kinetic models were listed in Table 3.
Table 3.
Apparent Kinetic Parameters of Metabolism of 7HF, 3,7DHF, 5,7DHF, 7,4DHF by SULT1A3
| Kinetic parameters | 7HF | 7,4’DHF | 3,7DHF | 5,7DHF |
|---|---|---|---|---|
| Km1 (µM) | 2.80 | 3.42 | 1.85 | 2.73 |
| Vmax-1 (nmol min−1 mg−1) |
85.11 | 20.83 | 79.7 | 87.77 |
| Vmax-1/ Km1 (mL min−1 mg−1) |
30.40 | 6.09 | 43.0 | 32.15 |
| Km2 (mM) | 1E-06 | |||
| Vmax-2 (biphasic, nmol min−1 mg−1) |
17.38 | |||
| Vmax-2/ Km2 (mL min−1 mg−1) |
1.74E07 | |||
| Ksi | 23.12 | 13.81 | ||
| R2 | 0.996 | 0.994 | 0.994 | 0.992 |
| AIC | 32.50 | 3.44 | 43.68 | 48.76 |
| Model | Substrate inhibition |
Substrate inhibition |
Sigmoidal kinetics of Hill equation |
Biphasic kinetics |
Kinetic parameters were obtained from using substrate inhibition, sigmoidal kinetics of Hill equation, and biphasic enzyme kinetics models as described under “Materials and Methods”.
Next, we determine how addition of 3-OH group changed the kinetics of sulfonation, and the results showed that both kinetic profile (Figure 4C1, 4C2) and enzyme capacities changed (Table 3). The kinetic profile is now autoactivation, and the Km value is more than 2 folds smaller, and Vmax is more than 4 times higher, resulting in a CLint value that is nearly 7 folds higher. This would suggest that addition of 3-OH would increase the sulfonation rates at both low and high concentrations, at least for this set of compounds.
Effects of 5-OH substitution on kinetics of sulfonation at the 7-OH group are similar to addition of 3-OH position, in that kinetic profile (Figure 4D1, 4D2) and enzyme capacities both changed. The effects of adding a 5-OH group was more pronounced than adding a 3-OH group in that we have larger overall Vmax values. Moreover, sulfonation of these flavonoids did not display substrate inhibition pattern.
Molecular Docking Analysis
We used molecular docking to explain why a flavonoid is a substrate of SULT1A3 and shed some lights on the previously observed differences in sulfonation rates. To this end, three criteria were evaluated: (1) the docking score: we found substrates have higher scores than most non-substrates (usually scores<20); (2) the distance between 7-OH and the phosphate of the co-factor PAPS. A range of 5.0~6.5Å was proposed based on the distance of 5.7Å in crystal structure 2A3R for D-dopamine, a prototypical substrate of SULT1A3; If no 7-OH exists, we would evaluate other -OH groups which are close to His108 as described in the next criterion; and (3) ability of the reactive OH group (e.g., 7-OH) to form hydrogen binding with the catalytic residue His108 which acts as a catalytic base and deprotonates the 7-OH during the sulfate transfer (Liu et al., 2000). The results are listed in Table 4.
Table 4.
Analysis of Parameters for Docked Flavonoids to SUL1A3
| Compound | Docking Score | Distance from 7-OH to PAPS (Å) |
7-OH H-Bonding with His108* |
|---|---|---|---|
| Naringenin | 20.11 | 6.8 | Yes |
| Phloretin | 27.01 | 3.1 | No |
| Genistein | 23.66 | 14 | No |
| Apigenin | 24.63 | 6.1 | Yes |
| Kaempferol | 27.93 | 4.1 | yes |
| 4HF | 15.69 | 13.6 | No |
| 5HF | 15.95 | 4 | No |
| 7HF | 33.34 | 3.3 | Yes |
| 5,4'DHF | 17.92 | 3.4 | No |
| 5,7DHF | 41.10 | 5.8 | Yes |
| 7,4'DHF | 24.14 | 6.6 | yes |
| 3HF | 14.61 | 10.1 | No |
| 3,4'DHF | 16.64 | 4 | No |
| 3,7DHF | 26.01 | 6.1 | Yes |
| 3,5,7THF | 26.93 | 5.7 | Yes |
| 3,7,4'THF | 26.68 | 6.3 | yes |
If 7-OH exists, we evaluated 7-OH; otherwise, we evaluate the all -OH groups and record the one closest to His108 and PAPS.
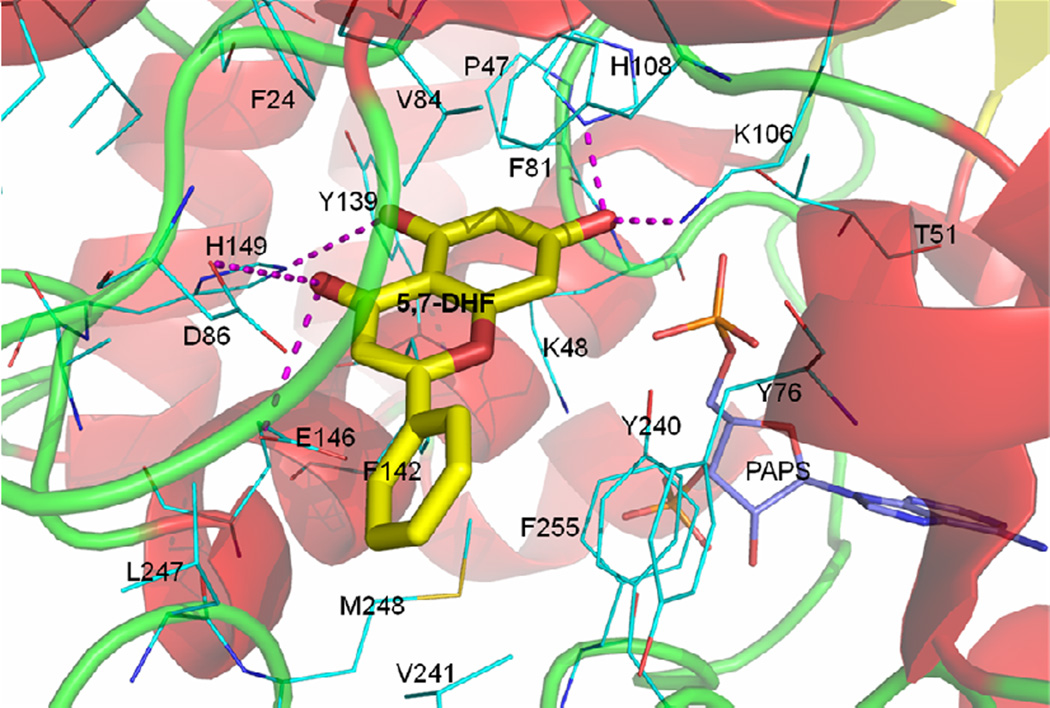
Based on these three criteria, 5,7DHF was interpreted as the most active substrate, in agreement with our experimental observation. First, it has the highest docking score. Second, we found that the 7-OH moiety was oriented correctly towards the co-factor PAPS for the catalytic reaction (Figure 5), with an appropriate distance of 5.8Å from the sulfate group (Lu et al., 2005). Third, the 7-OH group was able to form hydrogen bonds with the basic residue Lys106 as well as with the deprotonated N-3 atom on His108 imidazole ring (N-1 tautomer). Additionally we observed several other hydrogen bonds between His149 and Glu146/Asp86 to the 5-OH and carbonyl groups (Figure 5), respectively, which appears to stabilize the binding site as they did for the binding of dopamine to the SULT1A3 protein (Lu et al., 2005). Also based on the comprehensive evaluation of these parameters and interaction patterns (Table 4), all flavonoids without 7-OH were not SULT1A3 substrates, in agreement with our experimental findings. Similarly, we could explain why isoflavones and chalcones were not substrates either. Although they displayed high docking scores, these compounds did not have correct docking poses as their 7-OH groups could not be positioned appropriately towards the co-factor PAPS and the catalytic residue His108 (Liu et al., 2000), as demonstrated in Table 4. For example, genistein showed a docking with its 7-OH group oriented away from PAPS (the distance to PAPS is 14 Å). This conformation also did not allow H-bonding with the critical residue His108, which precludes sulfonation of genistein by SULT1A3.
Figure 5. The docked pose of 5,7-DHF in SULT1A3.
5,7-DHF (yellow sticks) forms strong hydrogen bonding interactions (magenta dashed lines) with residue Asp86, Lys106, His108, and Glu146. In addition, hydrophobic interactions with Phe24, Phe81, Val84, Tyr139, Phe142, Tyr240 and Phe255 also stabilize the binding. The 7-OH is close to the catalytic residue His108 and orientated towards PAPS (light blue) for sulfonation. The ribbon diagram represents the secondary structure of SULT1A3.
Furthermore, we examined how modification of chemical structures could affect the reaction rates. In our docking study, we found that the phenyl ring attached to the 2-position of the chromone scaffold in flavones affects the binding as it is surrounded by hydrophobic residues including Tyr76, Phe142, Tyr240, Val241, and Leu247 (Figure 5). As a result, the addition of a hydrophilic 4'-OH group reduces the docking score drastically from 41.10 (as in 5,7-DHF) to 24.63 (as in apigenin or 5,7,4'THF in Table 4). This is consistent with our observed sulfonation rate (at 2.5 µM) of 5,7,4'THF (19.00±1.58 nmol/hr/mg) being 3 times slower than 5,7-DHF (62.30±2.54 nmol/hr/mg). Similarly, the 3-OH substitution in flavonols also decreases the sulfonation rate of 3,5,7THF (24.98 ± 0.49 nmol/hr/mg) as the hydroxyl group sterically limits the flexibility of the 2-phenyl group (docking score 26.93) blocking its appropriate interactions with those hydrophobic residues of SULT1A3.
Discussion
We have showed, for the first time, through this systemic study that SULT1A3-mediated sulfonation of flavonoids was highly regiospecific for 7-OH position of flavonoids excluding isoflavones (represented by genistein) and chalcones (represented by phloretin) (Figure 2). This experimental observation could be explained by using the molecular docking study, which provided structural basis as to why 7-OH was the predominant position for sulfonation and why isoflavone and chclcone were not good substrates of SULT1A3. The strong correlation between SULT1A3-mediated sulfonation rates and sulfonation rates determined using the Caco-2 cell lysate lends support to the hypothesis that SULT1A3 is the dominating isoform responsible for sulfonation of 16 tested flavonoids in the Caco-2 cells. Considering the fact that SULT1A3 is mainly expressed by the human enterocytes but not by liver (Teubner et al., 2007; Riches et al., 2009), this makes SULT1A3 the likely major isoform responsible for flavonoid sulfonation in human intestine in vivo.
We have shown convincingly for the first time that SULT1A3 is exclusively for (reasonably rapid) sulfonation at 7-OH position of a structurally diverse group of flavonoids. Previously, SULT1A3 was show to be highly regiospecific and only sulfated 4-OH group of dopamine(Itaaho et al., 2007). This strong regioselective sulfonation is very different from UGT-mediated glucuronidation of flavonoids where one UGT isoform (e.g., UGT1A1) usually could metabolize compounds at multiple –OH groups (Tang et al.). This is consistent with the observation that SULT1A3 has a small pocket size and highly restrictive binding mode, especially for phenols (Dajani et al., 1999; Lu et al., 2005). This restrictive binding theory is supported by the fact that addition of a –OH group at any of the three positions of the flavonoid backbone (5, 3 or 4’) always substantially change the kinetics of sulfonation by affecting the kinetic profiles (5 and 3 substitution) or kinetic parameters (4’ and 5 substitution) (Figure 4 and Table 3). It is also supported by the fact that no disulfates of any flavonoid was found in the present study.
We have shown clearly that flavonoid-7-O-sulfonation in the Caco-2 cells was the result of their metabolism by SULT1A3 expressed in these cells, because of the high degree of correlation between rates of sulfonation in expressed SULT1A3 and in Caco-2 cell lysate. This result is expected since SULT1A3 is the predominant SULT isoform expressed in Caco-2 TC-7 cells (Meinl et al., 2008). For the congeneric series of flavonoids in flavone sub-class, the activity pattern in the Caco-2 cell lysate was again very similar to those seen with SULT1A3, with one notable exception in that a flavone with a 4’-OH but without a 7-OH was also metabolized, albeit at a rate that is almost minimal compared to those flavonoids with a 7-OH group (Figure 2E). The latter is probably because Caco-2 cells also express other SULT isoforms such as SULT1A1 and SULT1E1.
For the congeneric series of flavonoids in flavonol sub-class, the activity pattern was again similar between Caco-2 cell lysates and SULT1A3, and the notable exception is still that a minor metabolite was also formed with flavonols that contained a 4’-OH group but without a 7-OH group (Figure 2F).
Taken together, we determined the sulfonation of same 16 flavonoids both in the expressed human SULT1A3 and in the Caco-2 cell lysates, and found that these compounds were mostly sulfated at the 7-OH group. However, there were some minor differences in that 4’-O-sulfates were formed in the Caco-2 cell lysates, albeit at a much slower rates. Previously, sulfates of genistein was identified in intact Caco-2 cells and Caco-2 cell lysates that were grown for a longer period of time (19–21 days), but the formation rates were slow. However, other isoflavones were metabolized at faster rates. Our own studies have shown that genistein can be metabolized by SULT1A1 and SULT1E1 (Yang et al., 2010), which were expressed at much lower levels in Caco-2 TC-7 cells (Meinl et al., 2008).
Taken together, these three criteria allow us to explain our experimental data as to why a compound is a substrate or not. However, we must point out that these simplified parameters are just some key features for substrates. In order to demonstrate the complex substrate-SULT1A3 interactions, expert knowledge is required to analyze the docking results of each compound and interpreted the modeling data (substrate or non-substrate) case by case.
In conclusion, we have shown the SULT1A3 has a strong and almost exclusive preference for regiospecific metabolism at the 7-OH group of flavonoids (except isoflavones and chalcones) and that SULT1A3-mediated metabolism of flavonoids is mainly responsible for sulfonation of these flavonoids in the Caco-2 cells. This strong preference coupled with strong effects of –OH substitution (at any position) is consistent with the notion that SULT1A3 has small binding pocket for binding flavonoids in limited number of restrictive orientation, as shown by the molecular docking study.
Supplementary Material
Table 1.
Chemical structures of flavonoids used in this study.
| Compound | Abbreviation | Chemical Structure | Sub-classes |
|---|---|---|---|
| Naringenin | Nar |  |
flavanone |
| Phloretin | Phlor |  |
chalcone |
| Genistein | Gen |  |
isoflavone |
| Apigenin 5,7,4'-Trihydroxyflavone |
Api 5,7,4'-THF |
 |
flavone |
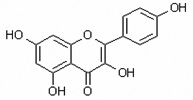
| Kaempferol 3,5,7,4’tetrahydroxyflavone |
Kamp 3,5,7,4’QHF |
 |
flavonol |
| 4'-Hydroxyflavone | 4HF |  |
flavones |
| 5-Hydroxyflavone | 5HF |  |
|
| 7-Hydroxyflavone | 7HF |  |
|
| 5,4'-Dihydroxyflavone | 5,4’DHF |  |
|
| 5,7-Dihydroxyflavone | 5,7DHF |  |
|
| 7,4'-Dihydroxyflavone | 7,4’DHF | 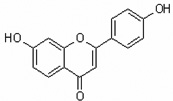 |
|
| 3-Hydroxyflavone | 3HF |  |
flavonols |
| 3,4'-Dihydroxyflavone | 3,4’DHF |  |
|
| 3,7-Dihydroxyflavone | 3,7DHF |  |
|
| 3,5,7-Trihydroxyflavone | 3,5,7THF |  |
|
| 3,7,4'-Trihydroxyflavone | 3,7,4’THF |  |
Acknowledgments
This work is supported by The National Institutes of Health grant GM-70737 to MH, and the National Natural Science Foundation of China (No.81173123) to SM.
ABBREVIATIONS
- 5,7,4'-THF
apigenin, 5,7,4'-trihydroxyflavone
- 3,5,7,4'QHF
Kaempferol 3,5,7,4'tetrahydroxyflavone
- 4'HF
4'-hydroxyflavone
- 5HF
5-hydroxyflavone
- 7HF
7-hydroxyflavone
- 5,4'DHF
5,4'-dihydroxyflavone
- 5,7DHF
5,7-dihydroxyflavone
- 7,4'DHF
7,4'-dihydroxyflavone
- 3HF
3-hydroxyflavone
- 3,4'DHF
3,4'-dihydroxyflavone
- 3,7DHF
3,7-dihydroxyflavone
- 3,5,7THF
3,5,7-trihydroxyflavone
- 3,7,4'THF
3,7,4'-Trihydroxyflavone
- UPLC
ultra performance liquid chromatography
- UGT
UDP-glucuronosyltransferases
- SULT
sulfotransferase
- AIC
Akaike’s information criterion
References
- Benavente-Garcia O, Castillo J. Update on uses and properties of citrus flavonoids: new findings in anticancer, cardiovascular, and anti-inflammatory activity. J Agric Food Chem. 2008;56:6185–6205. doi: 10.1021/jf8006568. [DOI] [PubMed] [Google Scholar]
- Boutin JA, Meunier F, Lambert PH, Hennig P, Bertin D, Serkiz B, Volland JP. In vivo and in vitro glucuronidation of the flavonoid diosmetin in rats. Drug Metab Dispos. 1993;21:1157–1166. [PubMed] [Google Scholar]
- Chen J, Lin H, Hu M. Metabolism of flavonoids via enteric recycling: role of intestinal disposition. J Pharmacol Exp Ther. 2003;304:1228–1235. doi: 10.1124/jpet.102.046409. [DOI] [PubMed] [Google Scholar]
- Chen J, Lin H, Hu M. Absorption and metabolism of genistein and its five isoflavone analogs in the human intestinal Caco-2 model. Cancer Chemother Pharmacol. 2005;55:159–169. doi: 10.1007/s00280-004-0842-x. [DOI] [PubMed] [Google Scholar]
- Dajani R, Cleasby A, M N, Wonacott AJ, Harren J, Hood AM, Modi S, Hersey A, Taskinen J, Cooke RM, Manchee GR, Coughtrie MW. X-ray crystal structure of human dopamine sulfotransferase, SULT1A3. Molecular modeling and quantitative structure-activity relationship analysis demonstrate a molecular basis for sulfotransferase substrate specificity. J Biol Chem. 1999;274:37862–37868. doi: 10.1074/jbc.274.53.37862. [DOI] [PubMed] [Google Scholar]
- de Vries JH, Hollman PC, Meyboom S, Buysman MN, Zock PL, van Staveren WA, Katan MB. Plasma concentrations and urinary excretion of the antioxidant flavonols quercetin and kaempferol as biomarkers for dietary intake. Am J Clin Nutr. 1998;68:60–65. doi: 10.1093/ajcn/68.1.60. [DOI] [PubMed] [Google Scholar]
- Galijatovic A, Otake Y, Walle UK, Walle T. Induction of UDP-glucuronosyltransferase UGT1A1 by the flavonoid chrysin in Caco-2 cells--potential role in carcinogen bioinactivation. Pharm Res. 2001;18:374–379. doi: 10.1023/a:1011019417236. [DOI] [PubMed] [Google Scholar]
- Glatt H, Boeing H, Engelke CE, Ma L, Kuhlow A, Pabel U, Pomplun D, Teubner W, Meinl W. Human cytosolic sulphotransferases: genetics, characteristics, toxicological aspects. Mutat Res. 2001;482:27–40. doi: 10.1016/s0027-5107(01)00207-x. [DOI] [PubMed] [Google Scholar]
- Hu M, Chen J, Lin H. Metabolism of flavonoids via enteric recycling: mechanistic studies of disposition of apigenin in the Caco-2 cell culture model. J Pharmacol Exp Ther. 2003;307:314–321. doi: 10.1124/jpet.103.053496. [DOI] [PubMed] [Google Scholar]
- Huang C, Chen Y, Zhou T, Chen G. Sulfation of dietary flavonoids by human sulfotransferases. Xenobiotica. 2009;39:312–322. doi: 10.1080/00498250802714915. [DOI] [PMC free article] [PubMed] [Google Scholar]
- Itaaho K, Alakurtti S, Yli-Kauhaluoma J, Taskinen J, Coughtrie MW, Kostiainen R. Regioselective sulfonation of dopamine by SULT1A3 in vitro provides a molecular explanation for the preponderance of dopamine-3-O-sulfate in human blood circulation. Biochem Pharmacol. 2007;74:504–510. doi: 10.1016/j.bcp.2007.05.003. [DOI] [PubMed] [Google Scholar]
- Joseph TB, Wang SW, Liu X, Kulkarni KH, Wang J, Xu H, Hu M. Disposition of flavonoids via enteric recycling: enzyme stability affects characterization of prunetin glucuronidation across species, organs, and UGT isoforms. Mol Pharm. 2007;4:883–894. doi: 10.1021/mp700135a. [DOI] [PMC free article] [PubMed] [Google Scholar]
- Lee SC, Chan WK, Lee TW, Lam WH, Wang X, Chan TH, Wong YC. Effect of a prodrug of the green tea polyphenol (-)-epigallocatechin-3-gallate on the growth of androgen-independent prostate cancer in vivo. Nutr Cancer. 2008;60:483–491. doi: 10.1080/01635580801947674. [DOI] [PubMed] [Google Scholar]
- Liu MC, Suiko M, Sakakibara Y. Mutational analysis of the substrate binding/catalytic domains of human M form and P form phenol sulfotransferases. J Biol Chem. 2000;275:13460–13464. doi: 10.1074/jbc.275.18.13460. [DOI] [PubMed] [Google Scholar]
- Liu Y, Liu Y, Dai Y, Xun L, Hu M. Enteric disposition and recycling of flavonoids and ginkgo flavonoids. J Altern Complement Med. 2003;9:631–640. doi: 10.1089/107555303322524481. [DOI] [PubMed] [Google Scholar]
- Lu JH, Li HT, Liu MC, Zhang JP, Li M, An XM, Chang WR. Crystal structure of human sulfotransferase SULT1A3 in complex with dopamine and 3'- phosphoadenosine 5'-phosphate. Biochem Biophys Res Commun. 2005;335:417–423. doi: 10.1016/j.bbrc.2005.07.091. [DOI] [PubMed] [Google Scholar]
- Meinl W, Ebert B, Glatt H, Lampen A. Sulfotransferase forms expressed in human intestinal Caco-2 and TC7 cells at varying stages of differentiation and role in benzo[a]pyrene metabolism. Drug Metab Dispos. 2008;36:276–283. doi: 10.1124/dmd.107.018036. [DOI] [PubMed] [Google Scholar]
- Moon JH, Nakata R, Oshima S, Inakuma T, Terao J. Accumulation of quercetin conjugates in blood plasma after the short-term ingestion of onion by women. Am J Physiol Regul Integr Comp Physiol. 2000;279:R461–R467. doi: 10.1152/ajpregu.2000.279.2.R461. [DOI] [PubMed] [Google Scholar]
- Murota K, Shimizu S, Miyamoto S, Izumi T, Obata A, Kikuchi M, Terao J. Unique uptake and transport of isoflavone aglycones by human intestinal caco-2 cells: comparison of isoflavonoids and flavonoids. J Nutr. 2002;132:1956–1961. doi: 10.1093/jn/132.7.1956. [DOI] [PubMed] [Google Scholar]
- Riches Z, Stanley EL, Bloomer JC, Coughtrie MW. Quantitative evaluation of the expression and activity of five major sulfotransferases (SULTs) in human tissues: the SULT "pie". Drug Metab Dispos. 2009;37:2255–2261. doi: 10.1124/dmd.109.028399. [DOI] [PMC free article] [PubMed] [Google Scholar]
- Ross JA, Kasum CM. Dietary flavonoids: bioavailability, metabolic effects, and safety. Annu Rev Nutr. 2002;22:19–34. doi: 10.1146/annurev.nutr.22.111401.144957. [DOI] [PubMed] [Google Scholar]
- Singh R, Wu B, Tang L, Liu Z, Hu M. Identification of the position of mono-O-glucuronide of flavones and flavonols by analyzing shift in online UV spectrum (lambdamax) generated from an online diode array detector. J Agric Food Chem. 2010;58:9384–9395. doi: 10.1021/jf904561e. [DOI] [PMC free article] [PubMed] [Google Scholar]
- Svehlikova V, Wang S, Jakubikova J, Williamson G, Mithen R, Bao Y. Interactions between sulforaphane and apigenin in the induction of UGT1A1 and GSTA1 in CaCo-2 cells. Carcinogenesis. 2004;25:1629–1637. doi: 10.1093/carcin/bgh169. [DOI] [PubMed] [Google Scholar]
- Tang L, Singh R, Liu Z, Hu M. Structure and concentration changes affect characterization of UGT isoform-specific metabolism of isoflavones. Mol Pharm. 2009;6:1466–1482. doi: 10.1021/mp8002557. [DOI] [PMC free article] [PubMed] [Google Scholar]
- Tang L, Ye L, Singh R, Wu B, Lv C, Zhao J, Liu Z, Hu M. Use of glucuronidation fingerprinting to describe and predict mono- and dihydroxyflavone metabolism by recombinant UGT isoforms and human intestinal and liver microsomes. Mol Pharm. 2010;7:664–679. doi: 10.1021/mp900223c. [DOI] [PMC free article] [PubMed] [Google Scholar]
- Teubner W, Meinl W, Florian S, Kretzschmar M, Glatt H. Identification and localization of soluble sulfotransferases in the human gastrointestinal tract. Biochem J. 2007;404:207–215. doi: 10.1042/BJ20061431. [DOI] [PMC free article] [PubMed] [Google Scholar]
- Thomasset SC, Berry DP, Garcea G, Marczylo T, Steward WP, Gescher AJ. Dietary polyphenolic phytochemicals--promising cancer chemopreventive agents in humans? A review of their clinical properties. Int J Cancer. 2007;120:451–458. doi: 10.1002/ijc.22419. [DOI] [PubMed] [Google Scholar]
- Walle UK, Galijatovic A, Walle T. Transport of the flavonoid chrysin and its conjugated metabolites by the human intestinal cell line Caco-2. Biochem Pharmacol. 1999;58:431–438. doi: 10.1016/s0006-2952(99)00133-1. [DOI] [PubMed] [Google Scholar]
- Walle UK, Walle T. Induction of human UDP-glucuronosyltransferase UGT1A1 by flavonoids-structural requirements. Drug Metab Dispos. 2002;30:564–569. doi: 10.1124/dmd.30.5.564. [DOI] [PubMed] [Google Scholar]
- Wang SW, Chen J, Jia X, Tam VH, Hu M. Disposition of flavonoids via enteric recycling: structural effects and lack of correlations between in vitro and in situ metabolic properties. Drug Metab Dispos. 2006;34:1837–1848. doi: 10.1124/dmd.106.009910. [DOI] [PubMed] [Google Scholar]
- Yang Z, Zhu W, Gao S, Xu H, Wu B, Kulkarni K, Singh R, Tang L, Hu M. Simultaneous determination of genistein and its four phase II metabolites in blood by a sensitive and robust UPLC-MS/MS method: Application to an oral bioavailability study of genistein in mice. J Pharm Biomed Anal. 2010;53:81–89. doi: 10.1016/j.jpba.2010.03.011. [DOI] [PMC free article] [PubMed] [Google Scholar]
- Zhang L, Lin G, Kovacs B, Jani M, Krajcsi P, Zuo Z. Mechanistic study on the intestinal absorption and disposition of baicalein. Eur J Pharm Sci. 2007;31:221–231. doi: 10.1016/j.ejps.2007.04.001. [DOI] [PubMed] [Google Scholar]
- Zhang S, Morris ME. Effect of the flavonoids biochanin A and silymarin on the P-glycoprotein- mediated transport of digoxin and vinblastine in human intestinal Caco-2 cells. Pharm Res. 2003;20:1184–1191. doi: 10.1023/a:1025044913766. [DOI] [PubMed] [Google Scholar]
Associated Data
This section collects any data citations, data availability statements, or supplementary materials included in this article.


