

Abstract
The objective of our study is to introduce a fully automated, computational linguistic technique to quantify semantic relations between words generated on a standard semantic verbal fluency test and to determine its cognitive and clinical correlates. Cognitive differences between patients with Alzheimer’s disease and mild cognitive impairment are evident in their performance on the semantic verbal fluency test. In addition to the semantic verbal fluency test score, several other performance characteristics sensitive to disease status and predictive of future cognitive decline have been defined in terms of words generated from semantically related categories (clustering) and shifting between categories (switching). However, the traditional assessment of clustering and switching has been performed manually in a qualitative fashion resulting in subjective scoring with limited reproducibility and scalability. Our approach uses word definitions and hierarchical relations between the words in WordNet®, a large electronic lexical database, to quantify the degree of semantic similarity and relatedness between words. We investigated the novel semantic fluency indices of mean cumulative similarity and relatedness between all pairs of words regardless of their order, and mean sequential similarity and relatedness between pairs of adjacent words in a sample of patients with clinically diagnosed probable (n=55) or possible (n=27) Alzheimer’s disease or mild cognitive impairment (n=31). The semantic fluency indices differed significantly between the diagnostic groups, and were strongly associated with neuropsychological tests of executive function, as well as the rate of global cognitive decline. Our results suggest that word meanings and relations between words shared across individuals and computationally modeled via WordNet and large text corpora provide the necessary context to account for the variability in language-based behavior and relate it to cognitive dysfunction observed in mild cognitive impairment and Alzheimer’s disease.
Keywords: semantic verbal fluency, Alzheimer’s disease, mild cognitive impairment, semantic similarity, semantic relatedness, computational semantics
1. Introduction
The question of how concepts are represented and associated with each other in the human brain has been the subject of many studies in multiple disciplines including neuroscience (Caramazza and Mahon, 2006; Chan et al, 1993; Mahon and Caramazza, 2009; Patterson et al., 2007; Pylkkanen et al., 2006), neuropsychology (Salmon et al., 1999; Troyer et al., 1998; Weber et al., 2009), psycholinguistics (Levelt, 1989; Tverski and Hemenway, 1984), and computer science (Miller and Fellbaum, 1991; Rada et al., 1989; Resnik, 1999). The pathway to a comprehensive answer to the question of conceptual representation is likely to be found at the intersection of multiple fields of study and approaches. For example, computational modeling of naturally occurring language (e.g., news, books, speeches, conversations) coupled with fMRI has strongly suggested that the patterns of hemodynamic activity in the brain in response to words presented as stimuli are predictable from the distributional co-occurrence statistics of these words in a very large corpus of text (Mitchell et al., 2008). This study has convincingly demonstrated the value of using computational linguistic approaches in the investigation of semantic representations. Our present study further contributes to this investigation by introducing a novel, fully automated, computational linguistic technique based on the standard semantic verbal fluency test (SVF) to characterize the differences in semantic representations of the “animals” category in patients with mild cognitive impairment (MCI) and Alzheimer’s disease (AD). We show that our technique has clear neuropsychological correlates and is related to global cognitive function, as evidenced by diagnostic group differences, correlation with traditional neuropsychological measures, and relation to the rate of cognitive decline in this population.
2. Background
2.1 Test of Semantic Fluency, and Clustering and Switching
The test of Semantic Verbal Fluency (SVF; (Benton et al., 1983) requires naming as many items from a particular category (e.g., animals) as possible within a 60-second time period. The phonemic counterpart of the semantic fluency test requires generating words that start with a certain letter of the alphabet (e.g., F, A, S). These simple tests of verbal fluency have been used extensively as part of standard neuropsychological test batteries to study cognitive effects of dementia (Gorno-Tempini et al., 2004; Hodges et al., 2004; Knopman et al., 2008; Libon et al., 2007). In particular, semantic fluency deficits have been widely reported in patients with various stages of AD and MCI (Chan et al., 2001; Ober et al., 1986; Rosen, 1980; Troyer et al., 1998) and often show early and disproportionate decline relative to other language, attention, and executive abilities (see Lezak (2004) and Henry et al. (2004) for review).
While traditional SVF scores are useful in identifying and quantifying semantic memory deficits, the actual words produced on this test can give us much more detailed and in-depth information about how the patients organize their semantic space. Successful performance on the SVF test depends to a large extent on how well semantic information is organized into conceptually related clusters and whether the patient is able to use an efficient strategy that accesses these clusters during the test (Estes, 1974; Hodges and Patterson, 1995; Laine, 1988). The size of semantic clusters and the efficiency of switching from one cluster (after it has been exhausted) to another have been found to have different neuroanatomical correlates (Rich et al., 1999; Troyer, 2000; Troyer et al., 1997). Semantic cluster size was found to be associated with the left temporal lobe, whereas the processing associated with switching was associated more with the function of the frontal lobe. These studies have found that cluster size and the amount of switching between clusters can measure the strength of associations in the patient’s lexical-semantic networks. Studies of clustering and switching in AD also found smaller and fewer clusters produced on this task (Ober et al., 1986; Rosen, 1980) and significantly fewer switches (Raoux et al., 2008) than by healthy controls. Troyer (2000) also found positive cluster size effects as a function of age, where older adults tended to produce larger clusters on the “animals” category relative to younger adults. These prior studies have also suggested that clustering may be related to more automated cognitive processes such as memory, whereas switching may rely on more effortful processes involved in executive functioning (Troyer et al., 1997). However, the model that relies on clustering and switching to disassociate temporal-semantic from frontal-executive processes remains controversial. Subsequent work by Mayr and colleagues has criticized Troyer’s clustering and switching model by demonstrating that switching in particular is more ambiguous with respect to the underlying cognitive processes (semantic vs. executive) than was previously believed and may not provide clear evidence for disassociating these processes (Mayr, 2002; Mayr and Kliegl, 2000).
Furthermore, prior studies of clustering and switching have relied on subjective assessments of semantic similarity between at least two (Rich et al., 1999; Troyer et al., 1997; Troyer et al., 1998) or three (Laine, 1988) adjacent words to define clusters. For example, the qualitative assessment proposed by Troyer et al. (1997) relies on manual determination if adjacent words belong to a top-level subcategory (e.g., zoological categories, human use, and living environment) with further more fine-grained subcategorizations (e.g. living environment category composed of African, Australian, Arctic/Far North, Farm, North American and Water Animals). In addition to their subjectivity, these manual approaches are time consuming and are difficult to implement and standardize, which may be responsible for some of the conflicting results obtained with these methods (Raoux et al., 2008). Therefore, clustering and switching analysis on verbal fluency tasks has been reserved largely for relatively few and small research studies (or random subsamples) and is not widely used for clinical assessment or larger scale investigations involving hundreds or thousands of patients. To make clustering and switching assessment more objective, reliable, and scalable it is necessary to use computational approaches to the determination of semantic relations between words, which we introduce in the current study.
2.2 Semantic Similarity vs. Relatedness
An established body of work in psycholinguistics focuses on lexical semantics and semantic relatedness (Collins and Loftus, 1975; Ferrand et al., 2006; Thompson-Schill et al., 1998; Tverski and Hemenway, 1984). In addition to the work in psycholinguistics, a variety of computational approaches have been developed to automatically measure the degree of semantic similarity or relatedness between concepts (Lin, 1998; Patwardhan and Pedersen, 2006; Pedersen et al., 2004; Rada et al., 1989; Resnik, 1999). While the notions of semantic similarity and relatedness are sometimes treated as indistinguishable, for computational purposes it is important to make a clear distinction between them. Clarifying this distinction is also important because of a potentially confusing overlap in terminology between the fields of psycholinguistics and computational linguistics.
In psycholinguistics, a distinction is made between semantic relatedness and associative relatedness. Associative relatedness refers to the probability that one word calls to mind another word (e.g., needle-thread), while semantic relatedness reflects the degree of semantic feature overlap between words (e.g., whale-dolphin). This distinction is based on the results of priming experiments in which, for example, a prime word that is either semantically related or unrelated to the target is shown to the subject first and the reading time or another type of response to the presentation of the target word (e.g., eye movements) is measured. These experiments indicate that subjects respond faster to targets primed with words that have common semantic features (i.e., are semantically similar) rather than those that have an associative relationship to the target (i.e., are semantically related; (Ferrand et al., 2006; Thompson-Schill et al., 1998)). In addition to the priming experiments, neuroimaging studies also demonstrated that semantically related words elicit clearly detectable differences in neural response from unrelated words (Mitchell et al., 2008; Weber et al., 2009). In computational linguistics, a distinction is made between the terms semantic similarity and semantic relatedness that roughly correspond to the psycholinguistic terms semantic relatedness and associative relatedness, respectively. To avoid any potential confusion, we will use the computational linguistic terminology throughout the present paper.
Treating semantic similarity as a special case of a more general notion of semantic relatedness is well-established in the field of lexical semantics (Rada et al., 1989; Resnik, 1999). For example, the words “cat” and “tiger” refer to somewhat similar concepts that share many semantic features (e.g., feline, four legs, fur, tail, etc.), while the words “cat” and “bird” refer to semantically dissimilar but functionally related concepts (e.g., cats are known to chase birds). Our own experimental evidence (collected on biomedical terms) shows that the relationship between semantic similarity and relatedness is that of a unidirectional entailment – concepts that are semantically similar are likely to also be judged as related, but not necessarily vice versa (Pakhomov et al., 2010).
In previous work on clustering and switching by Troyer et al. (1997) and subsequent studies relying on their methodology, the investigators collapsed the notions of similarity and relatedness by grouping words into functional subcategories (e.g., farm animals). These functional groupings do not strictly represent taxonomic relations used to define semantic similarity in computational linguistics; however, they also are not strictly associative in that the subcategories are organized into a shallow hierarchy. By using computationally defined notions of similarity and relatedness we are able to examine this distinction, and its relation to cognitive deficits more closely.
3. Materials and methods
3.1 Automatic computation of semantic similarity and relatedness
The distinction between semantic similarity and semantic relatedness is not only conceptual and experimental but also computational, as automated ways of assessing the degree of similarity and relatedness between words and concepts they represent fundamentally differ.
In general English, computing both similarity and relatedness relies on a large electronic and publicly available lexical database called WordNet® (Fellbaum, 1998; Miller, 1995). WordNet is a manually curated compendium of 155,287 unique English words (single words and compounds) organized into 117,659 synsets – groups of orthographically different but synonymous words. Each word is represented in terms of its possible parts of speech (noun, verb, adjective and adverb) as well as various meanings (senses) for polysemous words. WordNet also contains definitions (glosses) for each word. For example, a lexical entry for the word “cat” is represented in WordNet as shown in Figure 1. In addition to part-of-speech, sense and gloss information, each word in WordNet is also annotated with major semantic relations such as synonymy (including synonyms and antonyms), hyponymy (type-of or parent-child relation), meronymy (part-of relation). Both glosses and relations in WordNet are utilized by computational measures of semantic similarity and relatedness but in different ways as described in detail in the following two sections.
Figure 1.

A WordNet entry for the word "cat".
3.2 Computing Semantic Similarity
The simplest and most straightforward computational approach to estimating how semantically similar two words are is to represent WordNet as a hierarchy using only hyponymic (a.k.a., “is-a”) relations between words and, subsequently, calculate the distance between the locations of these words in the hierarchy in terms of the shortest path one would have to take to traverse the hierarchy from one word to the other. For example, Figure 2 shows path traversals between the words “cat” and either “tiger” or “dog.” For the purposes of this study we used an implementation of a programmatic interface to WordNet (WordNet::Similarity (Pedersen et al., 2004)) designed to compute semantic similarity between any pair of words or phrases contained in WordNet.
Figure 2.

A simplified portion of the WordNet hierarchy showing the shortest path between “cat” and “tiger” (length = 4; dotted arrows) and “cat” and “dog” (length = 5; solid arrows).
3.3 Computing Semantic Relatedness
To compute semantic relatedness between pairs of words, we used the Gloss Vectors approach developed by Patwardhan and Pedersen (2006). This approach builds on earlier work by Schütze (1998) and leverages the structure and content of WordNet together with word co-occurrence frequency information obtained from large corpora of English text. A semantic representation of each word in the pair of words being analyzed for relatedness is constructed as a high-dimensional second-order context vector. Each dimension is represented by a single word or a phrase that co-occurs with words or phrases in the definition of the word for which the context vector is being constructed. For example, the WordNet definition of the word “cat” includes the following text: “feline mammal usually having thick fur and no ability to roar.” After removing stop-words (closed class function words such as pronouns, prepositions, articles, conjunctions, and particles), the list of words in the definition will contain “feline”, “mammal”, ”usually”, ”thick”, ”fur”, ”ability“, and “roar.” By the same method, the definition of the word “tiger” will contain “large”, “feline”, “forests”, “Asia”, “tawny”, “coat”, “black”, and “stripes.” Comparing these two relatively sparse definitions directly (a.k.a., the “gloss overlap” method; (Lesk, 1986)) results in only a single word in common – “feline.” The Gloss Vector method addresses the sparseness of the definitions by finding the relatively few words from the definition in a large corpus of text (e.g., the British National Corpus) and using additional words that co-occur in the same context with the words from the definition as part of the context vector representation. For example, the word “fur” in the definition of the word “cat” frequently co-occurs with the word “coat” in most general English language corpora of text including the British National Corpus. Thus, the context vector for the word “cat” would also contain the word “coat”, even though this word is not part of the WordNet definition for “cat.” The same process would result in including the word “fur” as part of the definition of “tiger” thereby reducing the sparseness of the original definitions and increasing the relatedness score between “cat” and “tiger.” The validity of computational approaches to semantic similarity and relatedness between pairs of general English words has been previously demonstrated by correlating these automated measurements to manual assessments (Miller and Charles, 1991; Rubenstein and Goodenough, 1965).
3.4 Cumulative and Sequential Semantic Similarity and Relatedenss
In the present study, we experimented with two approaches to using automatic semantic similarity and relatedness computation for the assessment of clustering and switching on the standard SVF task. The cumulative approach consists of making semantic similarity and relatedness measurements between all pairs of words produced during the test of verbal fluency regardless of the order in which they appear in the test sample. The pair-wise measurements are then averaged to obtain either a cumulative similarity (CuSim) or cumulative relatedness (CuRel) score for the entire sample. The sequential approach consists of computing semantic similarity and relatedness only on adjacent pairs of words, preserving the order in which the words appeared in the sample. The pair-wise measurements are then averaged to obtain either a sequential similarity (SeqSim) or sequential relatedness (SeqRel) score.
The cumulative and sequential approaches are illustrated in Figure 3 in which each test sample is represented as an N × N matrix with the cells containing pair-wise similarity or relatedness values with the exception of the on-diagonal cells. Since the same words are used both in rows and columns, these matrices are symmetrical and thus we do not need to compute values for half of the pairs (represented with blank cells).
Figure 3.

An illustration of computing semantic similarity and relatedness on two actual SVF samples from the dataset used in this study. Highlighted squares represent pair-wise values that are averaged to obtain the final score.
Both SVF samples in Figure 3 produced similar scores for the cumulative similarity measure (CuSim 0.207 vs. 0.217) - but different scores for sequential similarity (SeqSim 0.266 vs. 0.175). This divergence in SeqSim scores is due to the presence of a larger cluster consisting of the words “cat”, ”lion”, and “tiger.” The relatively elevated scores for the transitions between “cat” and “lion” (0.5), and “lion” and “tiger” (0.33) result in a higher overall score that captures not only the presence of a cluster in the sample but also the fact that there are fewer switches between clusters. In the SVF sample 2 in Figure 3, every transition in SeqSim computation has a low similarity score indicative of each word representing its own cluster. The words “poodle” and “dog” have a high similarity score (0.5) and so do the pairs of words “dog” and “fox” (0.33), and “poodle” and “fox” (0.25); however, these words are not adjacent to each other, thus resulting in the divergence of sequential similarity scores while the cumulative similarity scores stay roughly the same. This example illustrates that, like the traditional notions of clustering and switching, cumulative scores reflect the size of semantic subcategories regardless of contiguity (i.e., more related to the size of the semantic store), the sequential scores reflect how closely the individual exemplars of the sub-categories are associated with each other in sequence (i.e., more related to the efficiency of retrieving items from memory). These two types of measures may indicate memory and executive abilities, respectively, however, they are not completely independent and do not have completely dissociable functions. In fact, given samples of exactly the same size, the sequential measurements reflect both the cluster size and the number of switches, as these two notions become an inverse of each other in equal-size samples. Cumulative measures are less sensitive than sequential measurements to unrelated or dissimilar words that may intervene between related or similar words and thus may be able to capture non-contiguous clusters – something that traditional measures of clustering do not capture.
3.6 Study Design
3.6.1 Participants
Clinical data were obtained from the work-up of patients diagnosed with either possible (AD-PS) or probable AD (AD-PR; DSM-IV/NINCDS-ADRDA criteria; (American Psychiatric Association, 1994; McKhann et al., 1984)), or MCI (Petersen, 2004) presenting to the Minneapolis VA Medical Center GRECC (Geriatric, Research, Education, and Clinical Center) Memory Loss Clinic. Diagnoses were determined through a systematic consensus diagnosis process based upon a standardized history, neurological exam, neuropsychological evaluation, occupational therapy evaluation, labs, and MRI protocol. Consensus was obtained from a neurologist, geropsychiatrist, internist, and neuropsychologist. Participants included in the sample had 1) an eligible clinical diagnosis, and 2) completed neuropsychological evaluation including administration of the SVF task (animals).
3.6.3 Cognitive Measures
The subjects were administered a neuropsychological test battery that included the standard SVF task in which the subjects were asked to name animals. The words produced by subjects on this test were written down and subsequently entered into the computer and pre-processed with spellchecking and morphological normalization. Morphological variants of the words were normalized using the Lexical Tools developed at the National Library of Medicine1. For example, nouns in plural form (e.g. “wolves”, “geese”, ”cats”) were normalized to singular form – wolf, goose, cat.
Other neuropsychological tests used to characterize the current study participants included tests of estimated premorbid ability (AMNART (Storandt et al., 1995), Information (Wechsler, 1997)), verbal memory (CVLT-II (Delis et al., 2000), Logical Memory (Wechsler, 1987)), attention (Trail Making part A (US Army, 1944), Digit Span forward (Wechsler, 1997), Stroop (Comalli et al., 1962; Strickland et al., 1997)), language (phonemic verbal fluency (Benton et al., 1983; Gladsjo et al., 1999), Boston Naming (Kaplan et al., 1983)), visuospatial ability (Block Design (Wechsler, 1997), Rey Complex Figure (Meyers and Meyers, 1995)), and executive functioning (Stroop interference, Trail Making part B, Digit Span backward, Digit Symbol (Wechsler, 1997)). These measures (summarized by domain in Table 2) were used to test the relationship between our automated semantic indices, and traditional cognitive domains of function. The Mini-Mental State Exam (Folstein et al., 1975) was administered serially over multiple clinic visits to assess rate of global cognitive decline.
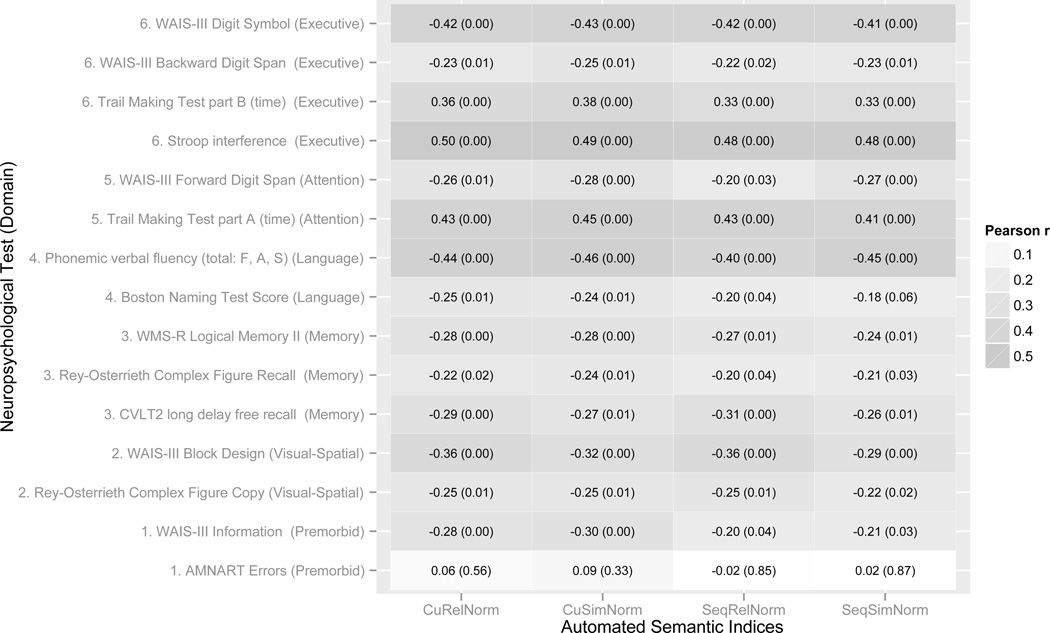
Table 2.
Partial correlations (controlled for age) between the automated semantic verbal fluency indices and neuropsychological test scores. The shade intensity of the cells indicates the effect size of the correlation – darker cells correspond to stronger correlations. The text inside the cells corresponds to the correlation coefficients with p-values in parentheses.
 |
3.6.4 Automated Semantic Fluency Indices
Subsequent to cognitive testing, four measures of cumulative and sequential similarity and relatedness were computed and log-normalized to correct for non-normal distribution of the scores:
CuSimNorm – log-normalized cumulative similarity
CuRelNorm – log-normalized cumulative relatedness
SeqSimNorm – log-normalized sequential similarity
SeqRelNorm – log-normalized sequential relatedness
3.7 Comparison to human similarity ratings
We compared the ratings between pairs of words produced by the WordNet based packages for measuring conceptual similarity and relatedness to manual assessments reported in an independent study by Weber et al. (2009). In their study, Weber and colleagues collected manual rankings produced by twelve participants on all possible pairs of nine animals: bear, camel, cougar, dolphin, elephant, giraffe, hippopotamus, horse, lion. The animal names were presented on 36 stimulus cards along with the photographic images of the animals but the subjects were instructed to rank the pairs based on conceptual rather than visual similarity. No relatedness judgments were obtained as part of that study. The study found that the mean similarity scores computed based on these rankings were correlated with the similarity in hemodynamic response patterns obtained with fMRI imaging using the photographs of the animals as stimuli (r = 0.65, p < 0.001 (p. 863)). Thus, this dataset represents a neurophysiologically validated reference standard that was used in the present study for the purpose of independent testing of the semantic similarity and relatedness measurements. The entire dataset with similarity scores is available in Weber et al.’s publication (2009).
3.8 Statistical Analysis
The relationship between automated semantic fluency indices (similarity and relatedness) and patient clinical characteristics were examined in three ways. (1) Clinical severity was examined by comparing group differences between MCI and AD-PR using analysis of variance (ANOVA). Patients with AD-PS were not included in this comparison to eliminate any potential spurious effects of comorbid diagnoses and/or atypical clinical presentation of AD. As a comparison of mean age by group (MCI vs. AD-PR) was not statistically significant, age was not included in these analyses. (2) Global cognitive progression was examined by using the automated semantic fluency indices and other cognitive testing variables as predictors interacting with time in mixed linear regression models with rate of change in MMSE as the outcome variable. All subjects with two or more MMSE time points available (at least one follow-up) were included in this analysis. (3) Automated semantic fluency indices were cross-sectionally correlated with traditional neuropsychological test scores (including the traditional SVF score) to explore the relative contributions of different domains of cognition function. Pearson’s partial correlations were used controlling for the effects of patient age. The purpose of this analysis was to gain a general understanding of the nature of the cognitive processes that may be measured with the automated semantic fluency indices. Therefore we performed a relatively large number of correlation tests without adjusting the p-values for multiple comparisons as we were more interested in the effect size rather than testing any specific hypotheses. Apart from the diagnostic group comparisons, which were limited to MCI and AD-PR, all available subjects with the necessary data points were included in the mixed models and correlation analyses (AD-PR, AD-PS, and MCI).
4. Results
4.1 Sample Characteristics
One hundred and thirteen patients met initial criteria for inclusion in the study sample (AD-PR N=55, AD-PS N=27, and MCI N=31), 102 of which had two or more time points available for longitudinal analysis. Participants in this longitudinal analysis had an average of 5.2 (3.0 SD) MMSE observations and were followed an average of 3.6 (2.5 SD) years. Their average baseline MMSE was 23.9 (3.5 SD), indicating mild global impairment at the initial evaluation. Group comparisons between MCI and AD were restricted to a subset of eighty six patients diagnosed with either AD-PR or MCI (AD-PR N=31, and MCI N=55). Further exclusions in study samples were based on availability of the testing results because not all subjects completed all of the tests. Sample demographic and follow-up observation characteristics are summarized in Table 1.
Table 1.
Sample characteristics.
| MCI | AD-PR | AD-PS | Total | |||||||||
|---|---|---|---|---|---|---|---|---|---|---|---|---|
| M | SD | N | M | SD | N | M | SD | N | M | SD | N | |
| Age | 76.00 | 7.33 | 31 | 78.20 | 6.87 | 55 | 78.04 | 7.11 | 27 | 77.56 | 7.06 | 113 |
| Education (yrs) | 14.71 | 2.72 | 31 | 12.49 | 2.53 | 55 | 14.19 | 2.50 | 27 | 13.50 | 2.75 | 113 |
| Intake MMSE | 25.84 | 2.41 | 31 | 22.84 | 3.54 | 55 | 25.30 | 3.00 | 27 | 24.25 | 3.41 | 113 |
| Observations* | 5.67 | 2.73 | 30 | 5.79 | 2.86 | 47 | 4.80 | 2.33 | 25 | 5.51 | 2.71 | 102 |
| Follow-up (yrs)* | 4.03 | 1.95 | 30 | 4.01 | 2.45 | 47 | 3.71 | 2.11 | 25 | 3.94 | 2.22 | 102 |
| GDS – 30 item | 7.32 | 3.92 | 28 | 7.59 | 5.81 | 46 | 6.04 | 4.28 | 25 | 7.12 | 4.96 | 99 |
| Information | 17.87 | 4.14 | 30 | 12.72 | 4.65 | 54 | 15.54 | 3.44 | 26 | 14.79 | 4.76 | 110 |
| AMNART errors | 18.27 | 10.19 | 30 | 22.28 | 9.41 | 53 | 20.48 | 8.13 | 27 | 20.75 | 9.41 | 110 |
| Digit Span Fwd. | 6.32 | 1.33 | 31 | 6.02 | 1.19 | 55 | 6.44 | 1.25 | 27 | 6.20 | 1.25 | 113 |
| TMT A time | 42.53 | 16.99 | 30 | 79.20 | 45.08 | 55 | 52.58 | 20.88 | 26 | 63.05 | 38.00 | 111 |
| Block Design | 27.97 | 10.06 | 31 | 17.55 | 8.36 | 55 | 24.38 | 7.59 | 26 | 22.02 | 9.77 | 112 |
| RCFT figure copy | 28.80 | 5.67 | 30 | 18.85 | 8.63 | 53 | 26.54 | 5.01 | 26 | 23.42 | 8.42 | 109 |
| RCFT figure recall | 8.67 | 5.01 | 30 | 2.89 | 2.62 | 53 | 7.19 | 4.76 | 26 | 5.50 | 4.70 | 109 |
| Logical Memory II | 8.87 | 7.39 | 31 | 2.57 | 3.32 | 53 | 6.00 | 5.27 | 27 | 5.16 | 5.83 | 111 |
| CVLT-II free recall | 2.46 | 2.06 | 26 | 0.96 | 1.62 | 46 | 3.25 | 2.97 | 24 | 1.94 | 2.34 | 96 |
| Boston Naming | 50.70 | 5.10 | 30 | 43.91 | 9.91 | 54 | 47.89 | 8.72 | 27 | 46.71 | 8.98 | 111 |
| SVF (animals) | 14.03 | 3.57 | 31 | 10.02 | 4.33 | 55 | 12.93 | 3.46 | 27 | 11.81 | 4.30 | 113 |
| PVF (F + A + S) | 32.97 | 9.93 | 31 | 22.96 | 12.91 | 55 | 34.07 | 12.98 | 27 | 28.36 | 13.19 | 113 |
| Digit Span Back. | 4.19 | 1.11 | 31 | 3.48 | 1.06 | 54 | 3.96 | 1.06 | 27 | 3.79 | 1.11 | 112 |
| Digit Symbol | 47.23 | 10.67 | 31 | 31.08 | 10.17 | 52 | 38.08 | 9.86 | 26 | 37.34 | 12.25 | 109 |
| TMT B time | 116.90 | 49.41 | 30 | 244.69 | 74.76 | 42 | 173.80 | 82.25 | 25 | 186.90 | 88.62 | 97 |
| Stroop interference | 171.83 | 66.84 | 24 | 241.53 | 78.73 | 32 | 190.50 | 57.45 | 22 | 205.69 | 75.42 | 78 |
M/SDs are restricted to those participants in the longitudinal analysis (having two or more MMSE observations).
4.3 Clinical Severity - Group Differences (MCI vs. AD-PR)
ANOVA for differences between MCI and AD-PR patient groups showed that the means for all four semantic fluency indices in these groups were significantly different from each other (CuRelNorm F(1,84)=22.88 p=.000, SeqRelNorm F(1,84)=21.03 p=.000, CuSimNorm F(1,84)=25.27 p=.000, SeqSimNorm F(1,84)=19.91 p=.000; see Figure 4). Patients with AD-PR consistently produced higher values, indicating greater similarity and relatedness of all words (cumulative) and adjacent words (sequential) produced on the semantic fluency task, than those produced by the MCI group. To facilitate comparison with traditional measures, ANOVA also compared MCI and AD-PR patient group performance on the standard SVF score (F(1,84)=19.22 p=.000), CVLT-II delayed recall (F(1,84)=11.74 p=.001), and Trail Making part B (F(1,84)=66.70 p=.000). All group comparisons (automated fluency and traditional measures) survived Bonferroni correction for statistical significance. Effect sizes for the automated measures were strong (Cohen’s d from −1.08 to −1.18) and better than the traditional SVF (1.01) and CVLT (0.81), but not better than that for Trail B (−2.02).
Figure 4.

Performance of MCI and probable AD patients on computerized semantic measures.
Note: the values shown are log-normalized – more negative log values correspond to lower semantic relatedness/similarity scores relative to less negative log values. Thus this graph shows that the AD-PR group had greater relatedness/similarity indices than the MCI group.
4.4 Clinical Characterization – Verbal Memory & Executive Function
To further define the automated semantic fluency indices, associations with known clinical characteristics of AD were investigated by correlating the semantic fluency indices with the scores obtained from the traditional neuropsychological test battery. The results are summarized in Table 2 showing a graphical representation of the strength of relationships by using shading of varying intensity corresponding to the magnitude of the correlation (regardless of the direction). Similarity and relatedness indices were correlated with exemplars of traditional neuropsychological tests assessing both memory and executive functioning. However, the results in Table 2 also illustrate that automated semantic fluency indices are more strongly related to cognitive tests that are typically associated with executive functioning and attention than memory. The results in Table 2 also show that cumulative measures of relatedness and similarity (CuRelNorm and CuSimNorm) are more strongly correlated with other cognitive tests than sequential measures.
4.5 Global Cognitive Progression - MMSE Slope
As expected, the longitudinal sample demonstrated a negative MMSE slope over the observation period, indicating, at minimum, mild clinical progression on a measure of global cognitive decline. The results of mixed modeling using MMSE slope as the outcome and the automated semantic indices as well as other cognitive measures are summarized in Table 3. The cumulative automated semantic similarity and relatedness indices (CuRelNorm and CuSimNorm) demonstrated a consistent association with MMSE slope in mixed models adjusted for age at the intercept. The traditional SVF score as well as the time to complete the Trail Making Part B task also showed a significant association with MMSE slope. CVLT-II delayed recall was not significantly related to the rate of decline, and combining automated semantic fluency indices with traditional neuropsychological test scores did not result in statistically significant associations.
Table 3.
Effects of cognitive measures and automated semantic fluency indices on the rate of cognitive decline. Only predictor interactions with time, the effect on MMSE slope, are shown.
| Predictor | Estimate | Standard Error | p-value |
|---|---|---|---|
| Time * CuRelNorm | −1.447 | 0.662 | 0.032 |
| Time * CuSimNorm | −1.646 | 0.758 | 0.033 |
| Time * SVF score | 0.083 | 0.035 | 0.020 |
| Time * TMT B time | −0.006 | 0.002 | 0.001 |
| Time * CVLT-II delayed recall | 0.050 | 0.077 | 0.520 |
Note. All models also included the effects of both subject age and the predictor of interest (traditional cognitive measure or automated fluency index) on the intercept.
4.6 Comparison of automatic similarity and relatedness measures to manual ratings
The comparison of the semantic similarity scores obtained for the 36 pairs of nine animals in Weber et al.’s study (2009) (manual similarity) with similarity and relatedness the scores obtained using the automated WordNet based methods described in the current study revealed significant correlations. There was a strong and statistically significant correlation between the manual similarity scores and those obtained automatically (rho = 0.65, p < 0.001) and a weaker but also significant correlation between manual similarity scores and automatic relatedness scores (rho = 0.49, p = 0.002).
5. Discussion
We have evaluated a novel and fully automated approach to the assessment of fine-grained semantic characteristics of words produced on a standard neuropsychological test of semantic verbal fluency. Our approach can be thought of as a computer-aided mechanism of estimating the efficiency of cognitive functioning through observations of a relatively simple linguistic behavior. Our results show that the automated computational linguistic assessments of semantic organization produced significantly different means in patients with MCI and probable AD, and were associated with the rate of cognitive decline.
Our findings are consistent with the general view of cognition as driven by large-scale interconnected neurocognitive networks that give rise to individual behavior through the dynamic interactions between different brain areas (Mesulam 1990, McIntosh 2008). According to this view, activations in any specific brain area must be interpreted in the context of its functional interactions with other brain areas. To draw a parallel with language, while arguably an individual word in any given language may have meaning in isolation, this meaning is not static and absolute, but rather is defined through the relationships that hold between the word and other words that represent concepts in the mind of an individual speaker. Previous work on semantic representations of concrete nouns has suggested that neural encoding patterns corresponding to concrete objects are partly shared across individual speakers (Mitchell 2009, Shinkareva 2008). We provide further confirmation of the partially shared nature of word meanings by showing an association between the semantic space representative of the community of English language speakers (WordNet coupled with large corpora of English text) and a limited portion of the semantic space of individual speakers of the language (animal names generated during the SVF test). While some of the meanings of words (concrete nouns in this case) may be shared, substantial variability in how much is shared across individuals is introduced by aging and disease, among many other individual factors. Our findings suggest that shared meanings and relations between words can account for at least some of that variability when they are used to interpret an individual’s ability to name exemplars of a semantic category such as animals. Thus our work represents an important step towards enabling computational modeling of the relationship between human behavior and cognitive function.
5.1 Association with clinical severity and global cognitive progression
All automated semantic fluency measures (similarity and relatedness, cumulative and sequential) were significantly different between patients with MCI and probable AD, demonstrating sensitivity to clinical severity. AD patients produced higher similarity and relatedness scores than patient with MCI. This finding may seem contrary to test performance mediated by the traditional notion of semantic network breakdown (Monsch et al. 1992). However, we believe that the reason for these seemingly surprising results is that exceptionally high relatedness and similarity scores in subjects with AD may be due to subjects with semantic impairment only being able to produce words that are highly semantically related, as they are more likely to resist impairment. As demonstrated by prior research, successful performance on SVF tests depends on the ability to balance between searching within semantic clusters and shifting between clusters (Estes, 1974; Hodges and Patterson, 1995; Laine, 1988). In this way, the task, and specifically our automated measures, are assessing both memory and executive components necessary for the most optimal behavior.
Similar to our interpretation of the differences in performance between MCI and AD, the pattern of partial correlations presented in Table 2 indicates that automated semantic fluency indices are capturing verbal behavior that is related to both memory, and executive function and attention. This finding is consistent with the view that various cognitive functions are closely interrelated and that performance on any given cognitive test typically relies on more than a single function. This finding is also consistent with prior qualitative studies attributing decreased switching in AD with decreased executive function (Raoux et al., 2008; Troyer et al., 1998). However, while Tryoer et al. (Troyer et al., 1998) claim that clustering and switching on a verbal fluency task are dissociable components of this complex behavior, subsequent critical examination by Mayr (Mayr, 2002; Mayr and Kliegl, 2000) suggests that the switching score is ambiguous. Contrary to Tryoer, Mayr and Kliegl’s findings suggest that executive functioning is involved in producing words from within and across semantic categories, whereas switching between categories is predominantly a semantic process. Mayr et al. (2002) demonstrate that in order to be able to correctly associate deficits in clustering and switching behaviors with the deficits in the underlying cognitive processes, one must take into account the word timing information. For example, a relatively long pause between adjacent words that are closely semantically related (i.e., belong to the same cluster) may be indicative of a problem with a semantic process, whereas a long pause between adjacent words that are semantically distant (i.e., belong to different clusters) may be indicative of a problem with an executive process. In the current study, the precise timing information for the semantic verbal fluency tests was not available; however, in our future investigations we plan to focus on audiorecorded tests. Nevertheless, our study has demonstrated and functionally validated a fully automated approach to computing the strength of relatedness between words produced on the SVF test that may subsequently be used in conjunction with timing information to examine the association between clustering and switching behavior and the underlying cognitive processes.
In addition to cross-sectional finding, the longitudinal analysis showed that automated semantic verbal fluency indices were significantly associated with the MMSE slope, indicating sensitivity not only to cross-sectional assessment of clinical severity (as shown in the comparison of MCI to AD), but also to the rate of cognitive decline. Higher cumulative semantic similarity and relatedness indices (which were related to poorer memory and executive performance and more advanced clinical status in our sample) were associated with greater global decline over the observation period (steeper slope). Other examples of traditional cognitive tests also showed a significant association with MMSE slope, including the standard SVF score and Trail Making Part B. The traditional list learning measure (CVLT-II delayed recall) failed to demonstrate a significant association with rate of global cognitive decline, even though list learning is often a sensitive predictor of future outcome in individuals who will go on to develop AD. It may be that our sample of patients who were already diagnosed with MCI or AD had less variability in initial memory ability to serve as a predictor or future change. Although we cannot say at this point that automated semantic fluency indices can help predict the rate of cognitive decline any better than other standard tests, it is notable that it appears the executive component of the automated measures are driving the observed association with rate of cognitive decline, and not the memory component. Future work is required to evaluate the degree to which this finding is dependent on a sample with established memory impairment.
5.2 Comparison to Other Studies of Semantic Organization of SVF Output
Our findings are consistent with those previously obtained by Chan et al. (1993) and Lerner et al. (2009). Chan and colleagues used multidimensional scaling to analyze responses on the semantic verbal fluency test of clinically diagnosed AD patients and controls to derive cognitive map representations of the words produced on this task. The physical proximity of words in the sequences produced by all of the subjects in each study group (probable AD vs. controls in this particular case) was used as a measure of semantic distance between them, resting on the assumption that healthy individuals tend to produce clusters of semantically associated words during the SVF task. These semantic distances were then used in a multidimensional scaling analysis showing that AD patients tended to form conceptual associations markedly different from controls, and that their semantic structure (rather than lexical access) was impaired. The approach developed by Lerner et al. (2009) consisted of using individual words as nodes and adjacent pairs of words produced by subjects in succession to construct the edges of two networks – one for MCI patients and one for AD patients. Network connectivity and topology metrics were found to be different between the groups, thus confirming similar findings reported by Chan et al. (1993).
Our method is fundamentally different from both of those proposed by Chan et al. (1993) and Lerner et al. (2009). The present method relies on calculating distances between the words produced on the semantic fluency test based on lexical and textual resources that are independent of the subjects’ responses and that represent “typical” usage of these words in the English language. Thus our approach can be described as relating the abstract semantic networks generated by the English language users’ community to the networks of individual English speakers including patients with clinically defined MCI and probable or possible AD. Since our approach is independent of the particular groups of patients and/or controls being investigated, it does not require responses from a healthy control reference group in order to interpret the results, and therefore may potentially be used as a predictive tool applied to individual patients rather than patient populations.
5.3 Validity of automated measures of semantic similarity and relatedness
We found strong correlations between similarity and relatedness scores derived automatically using the WordNet based methodology proposed in this paper and the manual similarity scores obtained by Weber et al. (2009) in a completely independent study. Weber and colleagues found that graphical similarity between brain fMRI obtained in response to picture stimuli depicting animals were found to be reflective of behaviorally obtained conceptual similarity between the words referring to these animals. Since our automatically derived similarity scores are strongly correlated with Webber at al.’s manual scores, these findings provide independent evidence in support of the validity of our approach in addition to prior work in computational linguistics (Miller and Charles, 1991; Rubenstein and Goodenough, 1965).
5.4 Limitations and strengths
Several limitations must be acknowledged in order to facilitate the interpretation of our findings. First, the current method for automated assessment of clustering and switching is optimized for the “animals” category due to a rich representation of this category in WordNet. Further development and experimentation is necessary to extend our methods to other widely used categories (fruits, vegetables, clothes, etc.). From a technical standpoint, this is a feasible task requiring possible expansion of WordNet structure and definitions that can be relatively easily accomplished for a limited number of categories typically used in neuropsychological testing. Second, the current methodology relies of the English language ontological (WordNet) and text corpus (British National Corpus) resources; however, multiple international projects have developed lexical resources similar to the original English WordNet (e.g., Japanese, Russian, German, Spanish, Chinese, among many others: http://www.globalwordnet.org/) and may be used in conjunction with large multilingual text corpora available as part of the Linguistic Data Consortium (http://www.ldc.upenn.edu/). Second, the current study sample is relatively small requiring follow up studies in larger populations to test for the generalizability of our results. Third, our subject sample was comprised of mostly male veterans of approximately the same age and education. While these characteristics strengthen the study by making the study sample more homogeneous and better controlled for factors known to be associated with AD, it may also limit the generalization of our findings to other populations. We are currently in the process of expanding the study to include more diverse participants from other medical centers. Fourth, our sample is clinically defined and thus we cannot confirm the presence or quantity of specific AD pathology (i.e., amyloid plaques and neurofribrillary tangles). Finally, although it would have been interesting to include healthy controls in the current study, the distinction in cognitive characteristics between healthy elderly, and groups with AD and MCI is beginning to become well established (Chen et al., 2011; Stam et al., 2009; Stam et al., 2007; Supekar et al., 2008; Yao et al., 2010). The distinction between MCI and AD is less clear and has been more elusive (Chen et al., 2011; Yao et al., 2010). Thus, in this study we focused specifically on severity and progression in MCI and AD.
The present study also has a number of distinct strengths. Automated semantic indices were evaluated with both cross-sectional and longitudinal analyses, enabling an estimation of the indices assessment properties for both clinical description and prediction of cognitive change over time. Our study makes a valuable contribution by offering a reproducible approach to quantifying the semantic aspects of performance on semantic verbal fluency tests. The calculation of semantic relatedness and similarity indices relies on computational approaches and software packages that have been extensively tested and validated in a number of computational linguistic applications. The present study represents a unique cross-disciplinary effort that can be extended to other language-based neuropsychological tests and other disease populations regardless of their size.
-
◦
Automated semantic indices have neuropsychological and neurophysiologic correlates.
-
◦
Automated semantic indices differ between mild cognitive impairment and Alzheimer’s disease.
-
◦
Automated semantic indices are strongly associated with tests of memory and executive function.
Acknowledgements
The work on this study was supported in part by the National Institutes of Health National Library of Medicine Grant [LM00962301 to S.P.]. We also would like to thank Michael Kuskowski for invaluable input on cross-sectional and longitudinal analyses performed in this study.
Footnotes
Publisher's Disclaimer: This is a PDF file of an unedited manuscript that has been accepted for publication. As a service to our customers we are providing this early version of the manuscript. The manuscript will undergo copyediting, typesetting, and review of the resulting proof before it is published in its final citable form. Please note that during the production process errors may be discovered which could affect the content, and all legal disclaimers that apply to the journal pertain.
http://lexsrv3.nlm.nih.gov/LexSysGroup/Projects/lvg/current/web/index.html (last accessed June 25, 2011)
References
- American Psychiatric Association. DSM-IV: Diagnostic and Statistical Manual of Mental Disorders. 4 ed. Washington, DC: American Psychiatric Association; 1994. [Google Scholar]
- Arbuthnott K, Frank J. Trail making test, part B as a measure of executive control: validation using a set-switching paradigm. Journal of Clinical and Experimental Neuropsychology. 2000;22:518–528. doi: 10.1076/1380-3395(200008)22:4;1-0;FT518. [DOI] [PubMed] [Google Scholar]
- Benton AL, Hamsher K, Sivan AB. Multilingual Aphasia Examination. 3rd ed. Iowa City, IA: AJA Associates; 1983. [Google Scholar]
- Caramazza A, Mahon BZ. The organisation of conceptual knowledge in the brain: The future's past and some future directions. Cognitive Neuropsychology. 2006;23:13–38. doi: 10.1080/02643290542000021. [DOI] [PubMed] [Google Scholar]
- Chan AS, Butters N, Salmon DP, McGuire KA. Dimensionality and clustering in the semantic network of patients with Alzheimer's disease. Psychology of Aging. 1993;8:411–419. doi: 10.1037//0882-7974.8.3.411. [DOI] [PubMed] [Google Scholar]
- Chan AS, Salmon DP, De La Pena J. Abnormal semantic network for "animals" but not "tools" in patients with Alzheimer's disease. Cortex. 2001;37:197–217. doi: 10.1016/s0010-9452(08)70568-9. [DOI] [PubMed] [Google Scholar]
- Chen G, Ward BD, Xie C, Li W, Wu Z, Jones JL, et al. Classification of Alzheimer disease, mild cognitive impairment, and normal cognitive status with large-scale network analysis based on resting-state functional MR imaging. Radiology. 2011;259:213–221. doi: 10.1148/radiol.10100734. [DOI] [PMC free article] [PubMed] [Google Scholar]
- Collins AM, Loftus EF. Spreading Activation Theory of Semantic Processing. Psychology Review. 1975;82:407–428. [Google Scholar]
- Comalli PE, Jr, Wapner S, Werner H. Interference effects of Stroop color-word test in childhood, adulthood, and aging. Journal of Genetic Psychology. 1962;100:47–53. doi: 10.1080/00221325.1962.10533572. [DOI] [PubMed] [Google Scholar]
- Estes WK. Learning theory and intelligence. Americal Psychology. 1974;29:740–749. [Google Scholar]
- Fellbaum C, editor. WordNet: An Electronic Lexical Database. Cambridge, MA: MIT Press; 1998. [Google Scholar]
- Ferrand L, Ric F, Augustinova M. Affective priming: A case of semantic priming? Annee Psychologique. 2006;106:79–104. [Google Scholar]
- Folstein MF, Folstein SE, McHugh PR. "Mini-mental state". A practical method for grading the cognitive state of patients for the clinician. Journal of Psychiatric Research. 1975;12:189–198. doi: 10.1016/0022-3956(75)90026-6. [DOI] [PubMed] [Google Scholar]
- Gladsjo JA, Schuman CC, Evans JD, Peavy GM, Miller SW, Heaton RK. Norms for letter and category fluency: demographic corrections for age, education, and ethnicity. Assessment. 1999;6:147–178. doi: 10.1177/107319119900600204. [DOI] [PubMed] [Google Scholar]
- Gorno-Tempini ML, Dronkers NF, Rankin KP, Ogar JM, Phengrasamy L, Rosen HJ, et al. Cognition and anatomy in three variants of primary progressive aphasia. Annals of Neurology. 2004;55:335–346. doi: 10.1002/ana.10825. [DOI] [PMC free article] [PubMed] [Google Scholar]
- Heaton RK, Chelune GJ, Talley JL, Kay GG, Curtiss G. Wisconsin Card Sorting Test Manual–Revised and Expanded. Odessa, FL: Psychological Assessment Resources; 1993. [Google Scholar]
- Henry JD, Crawford JR, Phillips LH. Verbal fluency performance in dementia of the Alzheimer's type: a meta-analysis. Neuropsychologia. 2004;42:1212–1222. doi: 10.1016/j.neuropsychologia.2004.02.001. [DOI] [PubMed] [Google Scholar]
- Hodges JR, Davies RR, Xuereb JH, Casey B, Broe M, Bak TH, et al. Clinicopathological Correlates in Frontotemporal Dementia. Annals of Neurology. 2004;56:399–406. doi: 10.1002/ana.20203. [DOI] [PubMed] [Google Scholar]
- Hodges JR, Patterson H. Is semantic memory consistently impaired early in the course of Alzheimer's disease. Neuroanatomical and diagnostic implications. Neuropsychologia. 1995;33:441–459. doi: 10.1016/0028-3932(94)00127-b. [DOI] [PubMed] [Google Scholar]
- Kaplan EF, Goodglass H, S W. The Boston Naming Test. 2nd ed. Philadelphia: Lea & Febiger; 1983. [Google Scholar]
- Knopman DS, Kramer JH, Boeve BF, Caselli RJ, Graff-Radford NR, Mendez MF, et al. Development of methodology for conducting clinical trials in frontotemporal lobar degeneration. Brain. 2008;131:2957–2968. doi: 10.1093/brain/awn234. [DOI] [PMC free article] [PubMed] [Google Scholar]
- Laine M. Correlates of word fluency performance. In: Koivuselka-Sallinen P, Sarajarvi L, editors. Studies in Languages. Joensuu, Finnland: University of Joensuu; 1988. [Google Scholar]
- Lerner AJ, Ogrocki PK, Thomas PJ. Network graph analysis of category fluency testing. Cognitive and Behavioral Neurology. 2009;22:45–52. doi: 10.1097/WNN.0b013e318192ccaf. [DOI] [PubMed] [Google Scholar]
- Lesk M. Automatic sense disambiguation using machine readable dictionaries: How to tell a pine cone from a ice cream cone. 5th Annual International Conference on Systems Documentation (SIGDOC); Toronto, ON, Canada. 1986. pp. 24–26. [Google Scholar]
- Levelt WJ. Speaking: From Intention to Articulation. Cambridge, MA: MIT Press; 1989. [Google Scholar]
- Lezak MD. Neuropsychological Assessment. 4th ed. Oxford: Oxford University Press; 2004. [Google Scholar]
- Libon DJ, Xie SX, Moore P, Farmer J, Antani S, McCawley G, et al. Patterns of neuropsychological impairment in frontotemporal dementia. Neurology. 2007;68:369–375. doi: 10.1212/01.wnl.0000252820.81313.9b. [DOI] [PubMed] [Google Scholar]
- Lin D. Fifteenth International Conference on Machine Learning; 1998 of Conference. Madison, WI: ICML; 1998. An Information Theoretic Definition of Similarity; pp. 296–304. [Google Scholar]
- Mahon BZ, Caramazza A. Concepts and categories: a cognitive neuropsychological perspective. Annual Review of Psychology. 2009;60:27–51. doi: 10.1146/annurev.psych.60.110707.163532. [DOI] [PMC free article] [PubMed] [Google Scholar]
- Mayr U. On the dissociation between clustering and switching in verbal fluency: comment on Troyer, Moscovitch, Winocur, Alexander and Stuss. Neuropsychologia. 2002;40:562–566. doi: 10.1016/s0028-3932(01)00132-4. [DOI] [PubMed] [Google Scholar]
- Mayr U, Kliegl R. Complex semantic processing in old age: does it stay or does it go? Psychology of Aging. 2000;15:29–43. doi: 10.1037//0882-7974.15.1.29. [DOI] [PubMed] [Google Scholar]
- McKhann G, Drachman D, Folstein M, Katzman R, Price D, Stadlan EM. Clinical diagnosis of Alzheimer's disease: report of the NINCDS-ADRDA Work Group under the auspices of Department of Health and Human Services Task Force on Alzheimer's Disease. Neurology. 1984;34:939–944. doi: 10.1212/wnl.34.7.939. [DOI] [PubMed] [Google Scholar]
- Monsch A, Bondi M, Butters N, Salmon D, Katzman R, Thal L. Comparisons of Verbal Fluency Tasks in the Detection of Dementia of the Alzheimer Tyoe. Archives of Neurology. 1992;40:1253–1258. doi: 10.1001/archneur.1992.00530360051017. [DOI] [PubMed] [Google Scholar]
- Meyers JE, Meyers KR. Rey Complex Figure Test and Recognition Trial. Odessa, FL: Psychological Assessment Resources; 1995. [Google Scholar]
- Miller G. WordNet: A Lexical Database for English. Communications of the Association for Computing Machinery (ACM) 1995;38:39–41. [Google Scholar]
- Miller G, Charles W. Contextual Correlates of Semantic Similarity. Language and Cognitive Processes. 1991;6:1–28. [Google Scholar]
- Miller G, Fellbaum C. Semantic Networks of English. Cognition. 1991;41:197–229. doi: 10.1016/0010-0277(91)90036-4. [DOI] [PubMed] [Google Scholar]
- Mitchell TM, Shinkareva SV, Carlson A, Chang KM, Malave VL, Mason RA, et al. Predicting human brain activity associated with the meanings of nouns. Science. 2008;320:1191–1195. doi: 10.1126/science.1152876. [DOI] [PubMed] [Google Scholar]
- Ober BA, Dronkers NF, Koss E, Delis DC, Friedland RP. Retrieval from semantic memory in Alzheimer-type dementia. Journal of Clinical and Experimental Neuropsychology. 1986;8:75–92. doi: 10.1080/01688638608401298. [DOI] [PubMed] [Google Scholar]
- Pakhomov S, McInnes B, Adam T, Liu Y, Pedersen T, Melton GB. Semantic Similarity and Relatedness between Clinical Terms: An Experimental Study; AMIA Annual Symposium Proceedings; 2010. pp. 572–576. [PMC free article] [PubMed] [Google Scholar]
- Patterson K, Nestor PJ, Rogers TT. Where do you know what you know? The representation of semantic knowledge in the human brain. Nature Review Neuroscience. 2007;8:976–987. doi: 10.1038/nrn2277. [DOI] [PubMed] [Google Scholar]
- Patwardhan S, Pedersen T. Using WordNet-based Context Vectors to Estimate the Semantic Relatedness of Concepts. EACL 2006 Workshop on Making Sense of Sense: Bringing Computational Linguistics and Psycholinguistics Together; Trento, Italy. 2006. pp. 1–8. [Google Scholar]
- Pedersen T, Patwardhan S, Michelizzi J. WordNet::Similarity - Measuring the Relatedness of Concepts. Fifth Annual Meeting of the North American Chapter of the Association for Computational Linguistics; 2004 of Conference; Boston, MA. 2004. pp. 38–41. [Google Scholar]
- Petersen R. Mild cognitive impairment as a diagnostic entity. Journal of Internal Medicine. 2004;256:183–194. doi: 10.1111/j.1365-2796.2004.01388.x. [DOI] [PubMed] [Google Scholar]
- Pylkkanen L, Llinas R, Murphy GL. The representation of polysemy: MEG evidence. Journal of Cognitive Neuroscience. 2006;18:97–109. doi: 10.1162/089892906775250003. [DOI] [PMC free article] [PubMed] [Google Scholar]
- Rada R, Mili F, Bicknell E, Blettner AM. Development and application of a metric on semantic nets; IEEE Transaction on Systems, Man, and Cybernetics; 1989. pp. 17–30. [Google Scholar]
- Raoux N, Amieva H, Le Goff M, Auriacombe S, Carcaillon L, Letenneur L, et al. Clustering and switching processes in semantic verbal fluency in the course of Alzheimer's disease subjects: results from the PAQUID longitudinal study. Cortex. 2008;44:1188–1196. doi: 10.1016/j.cortex.2007.08.019. [DOI] [PubMed] [Google Scholar]
- Resnik P. Semantic Similarity in a Taxonomy: An Information-Based Measure and its Application to Problems of Ambiguity in Natural Language. Journal of Artificial Intelligence Research. 1999;11:95–130. [Google Scholar]
- Rich JB, Troyer AK, Bylsma FW, Brandt J. Longitudinal analysis of phonemic clustering and switching during word-list generation in Huntington's disease. Neuropsychology. 1999;13:525–531. doi: 10.1037//0894-4105.13.4.525. [DOI] [PubMed] [Google Scholar]
- Rosen WG. Verbal fluency in aging and dementia. Journal of Clinical Neuropsychology. 1980;2:135–146. [Google Scholar]
- Rubenstein H, Goodenough JB. Contextual Correlates of Synonymy. Computational Linguistics. 1965;8:627–633. [Google Scholar]
- Salmon DP, Butters N, Chan AS. The deterioration of semantic memory in Alzheimer's disease. Canadian Journal of Experimental Psychology. 1999;53:108–117. doi: 10.1037/h0087303. [DOI] [PubMed] [Google Scholar]
- Schütze H. Automatic Word Sense Discrimination. Computational Linguistics. 1998;24:97–123. [Google Scholar]
- Smith GE, Pankratz VS, Negash S, Machulda MM, Petersen RC, Boeve BF, et al. A plateau in pre-Alzheimer memory decline: evidence for compensatory mechanisms? Neurology. 2007;69:133–139. doi: 10.1212/01.wnl.0000265594.23511.16. [DOI] [PubMed] [Google Scholar]
- Stam CJ, de Haan W, Daffertshofer A, Jones BF, Manshanden I, van Cappellen van Walsum AM, et al. Graph theoretical analysis of magnetoencephalographic functional connectivity in Alzheimer's disease. Brain. 2009;132:213–224. doi: 10.1093/brain/awn262. [DOI] [PubMed] [Google Scholar]
- Stam CJ, Jones BF, Nolte G, Breakspear M, Scheltens P. Small-world networks and functional connectivity in Alzheimer's disease. Cerebral Cortex. 2007;17:92–99. doi: 10.1093/cercor/bhj127. [DOI] [PubMed] [Google Scholar]
- Stern Y. Cognitive reserve. Neuropsychologia. 2009;47:2015–2028. doi: 10.1016/j.neuropsychologia.2009.03.004. [DOI] [PMC free article] [PubMed] [Google Scholar]
- Storandt M, Stone K, LaBarge E. Deficits in reading performance in very mild dementia of the Alzheimer’s type. Neuropsychology. 1995;9 [Google Scholar]
- Strickland TL, d’Elia LF, James R, Stein R. Stroop Color-Word performance of African Americans. The Clinical Neuropsychologist. 1997;11:87–90. [Google Scholar]
- Supekar K, Menon V, Rubin D, Musen M, Greicius MD. Network analysis of intrinsic functional brain connectivity in Alzheimer's disease. PLoS Computational Biology. 2008;4 doi: 10.1371/journal.pcbi.1000100. e1000100. [DOI] [PMC free article] [PubMed] [Google Scholar]
- Thompson-Schill SL, Kurtz KJ, Gabrieli JDE. Effects of semantic and associative relatedness on automatic priming. Journal of Memory and Language. 1998;38:440–458. [Google Scholar]
- Troyer AK. Normative data for clustering and switching on verbal fluency tasks. Journal of Clinical and Experimental Neuropsychology. 2000;22:370–378. doi: 10.1076/1380-3395(200006)22:3;1-V;FT370. [DOI] [PubMed] [Google Scholar]
- Troyer AK, Moscovitch M, Winocur G. Clustering and switching as two components of verbal fluency: evidence from younger and older healthy adults. Neuropsychology. 1997;11:138–146. doi: 10.1037//0894-4105.11.1.138. [DOI] [PubMed] [Google Scholar]
- Troyer AK, Moscovitch M, Winocur G, Alexander MP, Stuss D. Clustering and switching on verbal fluency: the effects of focal frontal- and temporal-lobe lesions. Neuropsychologia. 1998;36:499–504. doi: 10.1016/s0028-3932(97)00152-8. [DOI] [PubMed] [Google Scholar]
- Troyer AK, Moscovitch M, Winocur G, Leach L, Freedman M. Clustering and switching on verbal fluency tests in Alzheimer's and Parkinson's disease. Journal of Internationa; Neuropsychological Society. 1998;4:137–143. doi: 10.1017/s1355617798001374. [DOI] [PubMed] [Google Scholar]
- Tverski B, Hemenway K. Objects, parts and categories. Journal of Experimental Psychology. 1984;113:169–197. [PubMed] [Google Scholar]
- US Army. Army Individual Test Battery. Washington, DC: US Army War Department, Adjutant General's Office; 1944. [Google Scholar]
- Weber M, Thompson-Schill SL, Osherson D, Haxby J, Parsons L. Predicting judged similarity of natural categories from their neural representations. Neuropsychologia. 2009;47:859–868. doi: 10.1016/j.neuropsychologia.2008.12.029. [DOI] [PMC free article] [PubMed] [Google Scholar]
- Wechsler D. Wechsler Adult Intelligence Scale-III. San Antonio: The Psychological Corporation; 1997. [Google Scholar]
- Wechsler D. Wechsler Memory Scale-Revised Manual. San Antonio, TX: The Psychological Corporation; 1987. [Google Scholar]
- Yao Z, Zhang Y, Lin L, Zhou Y, Xu C, Jiang T. Abnormal cortical networks in mild cognitive impairment and Alzheimer's disease. PLoS Computational Biology. 2010;6 doi: 10.1371/journal.pcbi.1001006. e1001006. [DOI] [PMC free article] [PubMed] [Google Scholar]