Abstract
Previously, we proposed a new paradigm to explain the compartment-specific role of autophagy in tumor metabolism. In this model, autophagy and mitochondrial dysfunction in the tumor stroma promotes cellular catabolism, which results in the production of recycled nutrients. These chemical building blocks and high-energy “fuels” would then drive the anabolic growth of tumors, via autophagy resistance and oxidative mitochondrial metabolism in cancer cells. We have termed this new form of stromal-epithelial metabolic coupling: “two-compartment tumor metabolism.” Here, we stringently tested this energy-transfer hypothesis, by genetically creating (1) constitutively autophagic fibroblasts, with mitochondrial dysfunction or (2) autophagy-resistant cancer cells, with increased mitochondrial function. Autophagic fibroblasts were generated by stably overexpressing key target genes that lead to AMP-kinase activation, such as DRAM and LKB1. Autophagy-resistant cancer cells were derived by overexpressing GOLPH3, which functionally promotes mitochondrial biogenesis. As predicted, DRAM and LKB1 overexpressing fibroblasts were constitutively autophagic and effectively promoted tumor growth. We validated that autophagic fibroblasts showed mitochondrial dysfunction, with increased production of mitochondrial fuels (L-lactate and ketone body accumulation). Conversely, GOLPH3 overexpressing breast cancer cells were autophagy-resistant, and showed signs of increased mitochondrial biogenesis and function, which resulted in increased tumor growth. Thus, autophagy in the tumor stroma and oxidative mitochondrial metabolism (OXPHOS) in cancer cells can both dramatically promote tumor growth, independently of tumor angiogenesis. For the first time, our current studies also link the DNA damage response in the tumor microenvironment with “Warburg-like” cancer metabolism, as DRAM is a DNA damage/repair target gene.
Keywords: AMP kinase (AMPK), DNA damage response, DRAM, GOLPH3, LKB1, autophagy, cancer metabolism, cancer-associated fibroblasts, glycolysis, oxidative mitochondrial metabolism (OXPHOS), tumor stroma
Introduction
Autophagy is a conserved process of “self-eating” of both proteins and cell organelles. This process is triggered as an adaptation to cellular stress, which is caused by several factors, such as starvation, hypoxia, oxidative stress and DNA damage. Autophagy is initiated when the autophagosome, a double-membrane vesicle, engulfs cytoplasmic organelles. Autophagosomes fuse with lysosomes, which digests the vesicle’s contents.1 If excessive numbers of autophagic vacuoles accumulate, programmed cell death may be initiated.1
The complex role of autophagy in tumorigenesis has led many researchers to recognize that autophagy exhibits both tumor-promoting, as well as tumor-suppressing, activities.2-5 To resolve this long-standing paradox, our laboratory has offered a new model to better explain the compartment-specific role of autophagy in tumor progression. In this simplistic model, we have proposed autophagy acts as a tumor suppressor when it takes place in epithelial cancer cells; conversely, autophagy acts as a tumor promoter when it occurs in cancer-associated fibroblasts (CAFs).6
Our previous studies indicate that during tumor growth, cancer cells release reactive oxygen species (ROS) into the tumor microenvironment.7 This has been shown to initiate a loss of caveolin-1 (Cav-1) protein expression via the onset of autophagy and mitophagy in stromal fibroblasts.8,9 Subsequently, these autophagic cancer-associated fibroblasts, with reduced number of mitochondria, shift their metabolism toward glycolysis and produce high-energy mitochondrial fuels, including L-lactate, ketone bodies (3-hydroxy-butyrate), glutamine and free fatty acids.10-12
Eventually, these secreted metabolites are consumed by neighboring cancer cells, which use these metabolites to “fuel” mitochondrial oxidative metabolism (OXPHOS).11,13 We have termed this energy-transfer model: (1) the “autophagic tumor stroma model of cancer” or (2) “two-compartment tumor metabolism”.11,14
Moreover, we and other laboratories have established that a loss of stromal caveolin-1 (Cav-1) expression in cancer-associated fibroblasts is a biomarker for poor prognosis in human breast and prostate cancers as well as in patients with melanoma.15-20 As Cav-1 undergoes lysosomal degradation during autophagy in fibroblasts, a loss of stromal Cav-1 is a functional marker for autophagy, mitophagy and mitochondrial dysfunction in the tumor microenvironment.9 As stated above, this catabolic microenvironment would then provide energy to sustain the anabolic growth of aggressive cancer cells, explaining its strong association with a poor prognosis.6,20,21
A key component of the cellular stress response is p53, which is mutated and/or deleted in > 50% of human cancers.22,23 Nuclear p53 can transactivate an array of autophagy inducers, such as damage-regulated autophagy modulator (DRAM).22 DRAM is a recently discovered lysosomal protein that is highly conserved and induces p53-dependent autophagy.24 DRAM-deficient cells show a loss of p53-dependent autophagy. Moreover, DRAM expression was found to be silenced by hyper-methylation at its CpG islands in multiple tumor types.24 Recently, other regulators of DRAM, such as p73, JNK and E2F1, have been identified.25-27
Another critical regulator of cellular stress and the autophagic response is liver kinase B1 (LKB1), a serine/threonine kinase that is mutated in Peutz-Jeghers Syndrome.28 Peutz-Jeghers is rare autosomal-dominant harmatoma syndrome; carriers can also develop gastrointestinal, pancreatic and lung tumors.29 LKB1 activates AMP-activated protein kinase (AMPK) by phosphorylation at the AMP-kinase theronine residue (T172). AMP-kinase functions as an energy sensor and tightly controls a variety of catabolic processes.28,30 In mammals, AMPK is a hetero-trimer consisting of three subunits: α (catalytic), β and γ (non-catalytic parts).31,32 Upon activation, AMP kinase induces autophagy via two main signaling pathways: (1) inhibition of the mammalian target of rapamycin-1 (mTOR1) complex, an autophagy inhibitor, and (2) interaction with unc-51-like kinase 1 (ULK1), a key initiator of autophagy.28,33
GOLPH3/MIDAS/GPP34 is a mitochondrial protein which critically regulates mitochondrial lipid biogenesis and, hence, mitochondrial mass.34 It is normally upregulated in skeletal muscle cells in response to mitochondrial dysfunction as a compensatory mechanism to promote mitochondrial biogenesis.34 GOLPH3 shuttles between the Golgi apparatus and mitochondria to increase the delivery of mitochondrial phospho-lipids (such as cardiolipin), thereby increasing overall mitochondrial mass.34 Recently, Scott et al. have found that GOLPH3 is amplified in multiple types of human cancer.35 Also, they proposed that GOLPH3 may function as an oncogene, via activation of the mTOR1 signaling pathway.35
Here, we genetically manipulated the expression of DRAM, LKB1 and GOLPH3 to dissect the compartment-specific role of autophagy and mitochondrial biogenesis in tumor growth. Autophagic fibroblasts, overexpressing DRAM or LKB1, showed AMP-kinase activation and promoted tumor growth in a paracrine fashion that could not be accounted for by neo-vascularization. In addition, autophagy-resistant cancer cells, overexpressing GOLPH3, showed mTOR-activation and an increase in mitochondrial function, resulting in a significant increase in tumor growth. Thus, our current results are consistent with the idea that (1) catabolism in the tumor microenvironment (e.g., autophagy and mitochondrial dysfunction) and (2) mitochondrial biogenesis/autophagy resistance in epithelial cancer cells, both enhance anabolic tumor growth.
In summary, autophagy functions as a tumor promoter or a tumor suppressor, depending on its compartmental or cellular localization. Our findings indicate that autophagy is a tumor promoter when it occurs in cancer-associated fibroblasts; conversely, autophagy functions as a tumor suppressor when it takes place in cancer cells.
This general model is also consistent with our previous findings showing that activated HIF1-α (a major positive regulator of autophagy) functions as a tumor promoter in cancer-associated fibroblasts and as a tumor suppressor in epithelial cancer cells,36 both independently of tumor angiogenesis.
Results
DRAM activates autophagy in fibroblasts, resulting in a loss of Cav-1 protein expression and mitochondrial dysfunction, driving AMP-kinase activation
We previously established that a loss of caveolin-1 (Cav-1) in the tumor stroma correlates with poor prognosis in human breast cancers. Interestingly, genome-wide transcriptional profiling of Cav-1-deficient tumor stroma reveals the induction of an autophagic program. Thus, one hypothesis is that autophagic fibroblasts may enhance tumor growth.
To test this hypothesis directly, we generated fibroblasts with a constitutive autophagic phenotype. For this purpose, we chose to use DRAM (damage-regulated autophagy modulator) to upregulate autophagy in stromal fibroblasts. DRAM is a lysosomal protein that is trans-activated by p53 and is critical for p53-dependent autophagy.
Briefly, immortalized human fibroblasts (hTERT-BJ1 cells) were stably transfected with DRAM (Fig. 1A). Then, we examined the expression of a panel of autophagy markers in DRAM-overexpressing fibroblasts. Figure 1B shows that four autophagy markers (BNIP3, Beclin1, LAMP1 and Cathepsin B) were all upregulated in response to DRAM expression, consistent with the induction of autophagy. Similar results were also obtained when fibroblasts were co-cultured with human breast cancer cells (MDA-MB-231-GFP+); DRAM-expressing fibroblasts clearly showed increased expression of autophagy markers (LAMP1 and Beclin1) by immuno-fluorescence (Fig. 2). Importantly, DRAM-overexpressing fibroblasts also showed a loss of Cav-1 expression as predicted, likely due to the induction of autophagy (Fig. 3).
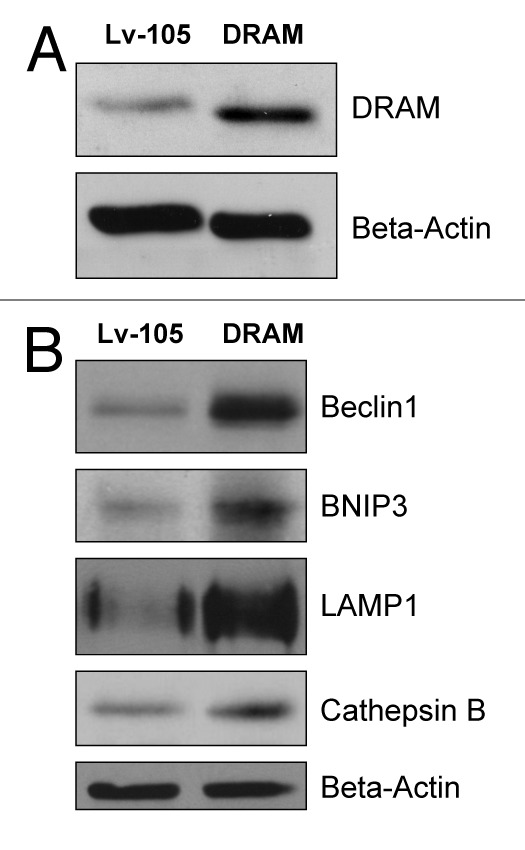
Figure 1. DRAM-overexpressing fibroblasts show the induction of autophagy: Immunobotting. hTERT-BJ1 immortalized human fibroblasts were transduced with a lentiviral vector encoding DRAM, or the vector-alone control (Lv-105). After selection for puromycin resistance, the stable fibroblast cell lines were used to prepare protein lysates which were then subjected to immunoblot analysis with specific antibody probes. (A) Immunoblot analysis validates the expression of DRAM. (B) Note that four autophagy markers (BNIP3, Beclin1, LAMP1 and Cathepsin B) were all upregulated in response to DRAM expression, consistent with the induction of autophagy. In panels A and B, immunoblotting with β-actin is shown as a control for equal protein loading.
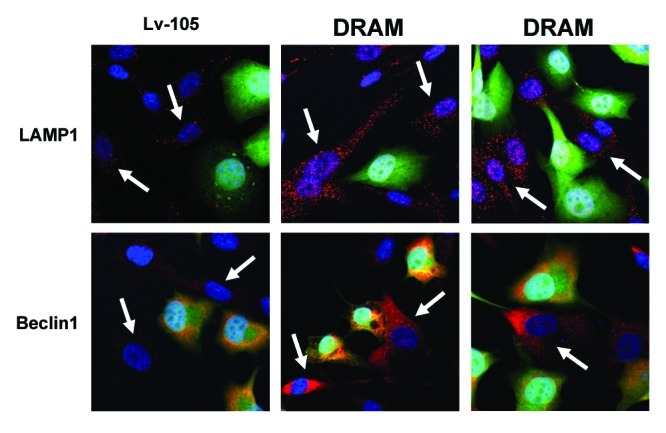
Figure 2. DRAM-overexpressing fibroblasts show the induction of autophagy: Immuno-fluorescence during co-culture. DRAM-overexpressing fibroblasts or the corresponding vector-alone control fibroblasts (Lv-105), were co-cultured with MDA-MB-231-GFP+ cells (GREEN) for a period of 3 d. Note that DRAM-expressing fibroblasts clearly showed increased expression of autophagy markers (LAMP1 and Beclin1) by immuno-fluorescence microscopy (RED; indicated by white arrows). Nuclei were visualized by counter-staining with Hoechst-33258 (BLUE).
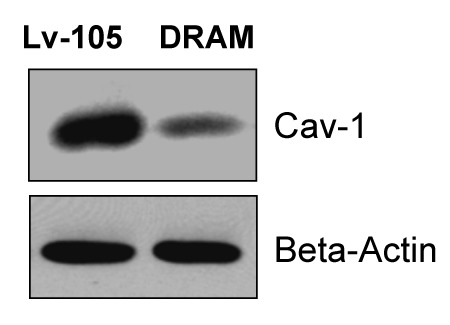
Figure 3. DRAM activates autophagy in fibroblasts, resulting in loss of Cav-1 protein expression. Note that DRAM-overexpressing fibroblasts also showed a loss of Cav-1 expression, as predicted, likely due to the induction of autophagy. Immunoblotting with β-actin is shown as a control for equal protein loading.
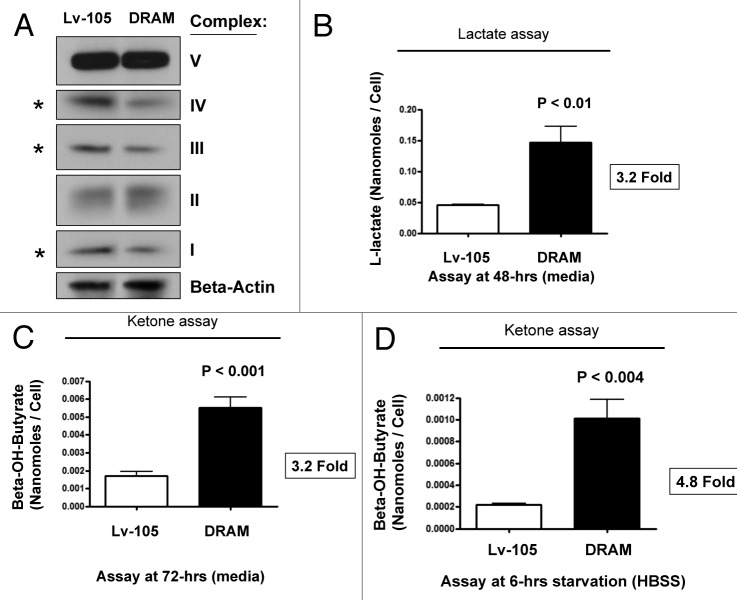
As BNIP3 is a marker of mitophagy, we also investigated the status of mitochondrial OXPHOS (complexes I-V). Interestingly, DRAM-overexpressing fibroblasts showed significant reductions in components of complex I, III, and IV (Fig. 4A) by immunoblotting, consistent with a mitophagy phenotype. Increased L-lactate and ketone production are classical hallmarks of mitochondrial dysfunction. Similarly, DRAM-overexpressing fibroblasts showed dramatic increases in L-lactate (> 3-fold) and β-hydroxy-butyrate (~3–5-fold) production, which was further accentuated by starvation (Fig. 4B–D).
Figure 4. DRAM activates autophagy in fibroblasts, driving mitochondrial dysfunction. (A) OXPHOS immunoblotting. Given the upregulation of BNIP3 (a marker of mitophagy), we also investigated the status of mitochondrial OXPHOS (complexes I-V). Note that DRAM-overexpressing fibroblasts showed significant reductions in components of OXPHOS complexes I, III, and IV, consistent with a mitophagy phenotype. Immunoblotting with β-actin is shown as a control for equal protein loading. (B) L-lactate production. hTERT fibroblasts were plated in 12-well dishes in complete media, at a cell density of 1 × 10⁵ fibroblasts per well. The next day, the media was changed to fresh DMEM supplemented with 2% FBS. After 48h, the media was collected and L-lactate was immediately assayed using the EnzyChrom L-lactate assay kit (BioAssay, Inc.), according to the manufacturer’s protocol. Cells were then washed, trypsinized and counted using a hemocytometer. Note that DRAM-overexpressing fibroblasts show a > 3-fold increase in L-lactate accumulation in the tissue culture media. (C and D) Ketone production. hTERT fibroblasts were plated in 12-well dishes in complete media, at a cell density of 1 x 10⁵ fibroblasts per well. The next day, the media was changed to fresh DMEM supplemented with 2% FBS. After 72h, the media was collected and ketones were immediately assayed using a β-hydroxy-butyrate (β-HB) Assay Kit (Biovision, Inc.), according to the manufacturer’s protocol. Alternatively, cells were starved for 6h by adding warm HBSS-supplemented with 40 mM HEPES. After starvation, the HBSS was collected and ketones were measured. Cells were washed, trypsinized and counted using a hemocytometer. Note that DRAM-overexpressing fibroblasts show a > 3-fold increase in ketone body accumulation in the tissue culture media (C), and this effect was accentuated further by starvation (D).
Since mitochondrial dysfunction leads to increases in AMP levels (due to decreased ATP), we checked the status of AMP-kinase activation. Figure 5 shows that AMP kinase is indeed hyperactivated in DRAM-overexpressing fibroblasts, indicative of a loss of mitochondrial function.
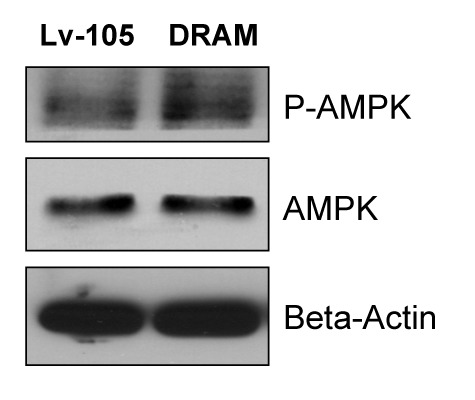
Figure 5. DRAM-overexpressing fibroblasts show AMP-kinase activation. Mitochondrial dysfunction leads to increases in AMP levels (due to decreased ATP), Thus, we examined the status of AMP-kinase activation. Note that AMP-kinase is indeed hyperactivated in DRAM-overexpressing fibroblasts, consistent with a loss of mitochondrial function. Immunoblotting with β-actin is shown as a control for equal protein loading.
Thus, DRAM fibroblasts show the induction of autophagy, mitophagy and mitochondrial dysfunction with AMP-kinase activation. Consistent with our findings, AMP-kinase activation is also known to serve as a feed-forward mechanism for the induction of autophagy, perpetuating a vicious cycle of autophagy and mitochondrial dysfunction.
DRAM-overexpressing fibroblasts enhance tumor growth
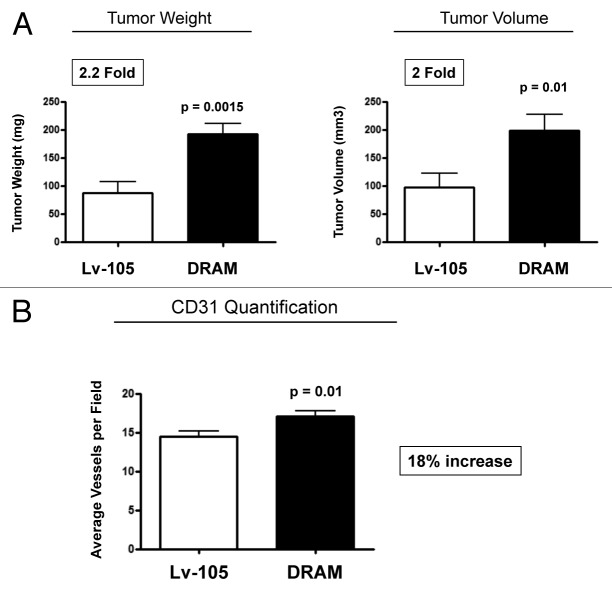
We hypothesized that autophagic fibroblasts will actively promote tumor growth via the production of recycled nutrients and chemical building blocks derived from cellular catabolism. To test this hypothesis, DRAM-overexpressing fibroblasts were co-injected with breast cancer cells (MDA-MB-231-GFP+) into the flanks of athymic nude mice flank. At 4 weeks post-injection, tumors grown in the presence of DRAM fibroblasts showed a ~2-fold increase in tumor growth (as measured by either tumor weight or volume) (Fig. 6A).
Figure 6. DRAM-overexpressing fibroblasts enhance tumor growth, without a dramatic increase in angiogenesis. (A) DRAM-overexpressing fibroblasts were co-injected together with breast cancer cells (MDA-MB-231-GFP+) into the flanks of athymic nude mice flank. At 4 weeks post-injection, tumors grown in the presence of DRAM fibroblasts showed an ~2-fold increase in tumor growth (as measured by either tumor weight or volume). p- values are as shown. n = 10 per experimental group. (B) Although tumors grown with DRAM fibroblasts show a slight increase in CD31-positive vessel density (~18%), this small difference could not account for the observed 2-fold increase in tumor growth. Thus, our data are more consistent with the hypothesis that catabolism in the tumor stroma can “fuel” the anabolic growth of cancer cells, via stromal-epithelial metabolic coupling.
To examine the possible contribution of angiogenesis to increase the tumor growth, we next immunostained frozen tumor sections with anti-CD31 antibodies, and then selected 8–10 random fields from four tumors (of each experimental group) to quantify tumor vascularization. Although tumors grown with DRAM fibroblasts show a slight increase in vessel density (Fig. 6B), this small difference could not account for the observed 2-fold increase in tumor growth.
Thus, our data are more consistent with the hypothesis that catabolism in the tumor stroma can “fuel” the anabolic growth of cancer cells, via stromal-epithelial metabolic coupling.
LKB1-mediated AMP-kinase activation in cancer-associated fibroblasts drives autophagy and promotes tumor growth
AMP kinase is a master regulator of cell metabolism.28 AMP-kinase activation triggers numerous catabolic pathways, such as glycolysis, autophagy and mitophagy. LKB1 is an upstream kinase that directly phosphorylates AMP kinase, resulting in its activation, which then drives autophagy when AMP levels rise due to mitochondrial dysfunction.30
To assess whether AMP-kinase activation in stromal fibroblasts is sufficient to promote tumor growth, we next generated hTERT-BJ1 fibroblasts overexpressing wild-type LKB1. As critical negative controls, we also generated matched fibroblast cell lines overexpressing a kinase-dead (KD) form of LKB1(K78I) or the vector-alone control (pBABE-puro). Kinase-dead LKB1 may be expected to show a dominant-negative phenotype, as it should retain the ability to bind to and sequester its substrate, AMP kinase.
Figure 7A shows that both forms of LKB1 (WT and KD) were well expressed in hTERT-BJ1 fibroblasts, although the KD mutant (K78I) showed higher steady-state expression levels. Importantly, wild-type LKB1 functionally induced the activation of AMP-kinase phosphorylation as seen by immunoblot analysis, with phospho-specific antibody probes (Fig. 7B), and was sufficient to upregulate autophagy markers (such as BNIP3 and LC3-I/II) (Fig. 7C).
Figure 7. LKB1 activates AMP-kinase in fibroblasts, resulting in the onset of autophagy. To determine if AMP-kinase activation in stromal fibroblasts is sufficient to promote tumor growth, we generated hTERT-BJ1 fibroblasts overexpressing wild-type LKB1. As critical negative controls, we also generated matched fibroblast cell lines overexpressing a kinase-dead (KD) form of LKB1(K78I), or the vector-alone control (pBABE-puro). (A) Note that both forms of LKB1 (WT and KD) were well expressed in hTERT-BJ1 fibroblasts, although the KD-mutant (K78I) showed higher steady-state expression levels. (B) Wild-type LKB1 functionally induced the activation of AMP-kinase phosphorylation as seen by immunoblot analysis, with phospho-specific antibody probes. (C) Wild-type LKB1 was sufficient to upregulate autophagy markers (such as BNIP3 and LC3-I/II). In panels A-C, immunoblotting with β-actin is shown as a control for equal protein loading.
To determine whether autophagic fibroblasts with constitutive AMP-kinase activation can promote tumor growth, LKB1-overexpressing fibroblasts were co-injected with MDA-MB-231-GFP+ cells into the flanks of athymic nude mice (Fig. 8A). As predicted, autophagic fibroblasts overexpressing wild-type LKB1 significantly promoted tumor growth (by ~2-fold), while fibroblasts expressing kinase-dead LKB1 dramatically retarded tumor growth (by > 2.5-fold) (Fig. 8B). Moreover, if we compare wild-type vs. kinase-dead LKB1 fibroblast-driven tumor growth, there was a ~3–5-fold reduction in tumor growth in the absence of stromal activation of AMP kinase. Importantly, these striking changes in tumor growth did not correlate with large increases or decreases in neo-vascularization, as measured by CD31 immunostaining, ruling out angiogenesis as the primary cause (Fig. 8C).
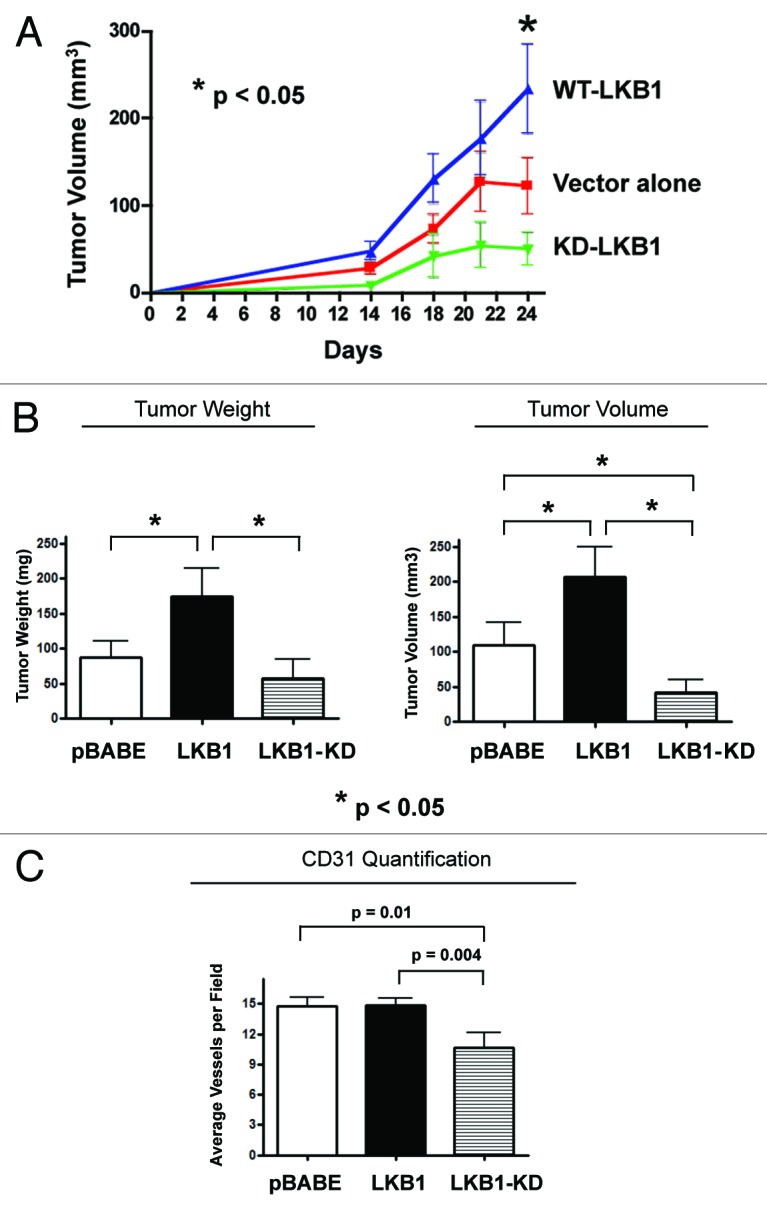
Figure 8. LKB1-mediated AMP-kinase activation in cancer-associated fibroblasts drives autophagy and promotes tumor growth. To determine whether autophagic fibroblasts, with constitutive AMP-kinase activation, can promote tumor growth, LKB1 overexpressing fibroblasts were co-injected with MDA-MB-231-GFP+ cells into the flanks of athymic nude mice. As predicted, autophagic fibroblasts overexpressing wild-type (WT) LKB1 significantly promoted tumor growth (by ~2-fold), while fibroblasts expressing kinase-dead (KD) LKB1 dramatically retarded tumor growth (by > 2.5-fold) (A and B). p- values are as shown. n = 10 per experimental group. (A) The time course of tumor growth (volume) is shown up to 3.5 weeks post-injection. (B) Tumor growth (weight and volume) is shown after tumor excision, on day 25 post-injection. (C) These striking changes in tumor growth did not correlate with large increases or decreases in neo-vascularization, as measured by CD31 immunostaining, ruling out angiogenesis as the primary cause.
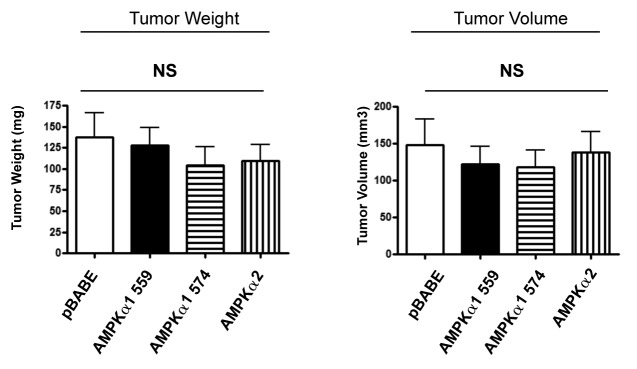
Consistent with the idea that AMP-kinase activation in cancer-associated fibroblasts is strictly required to promote tumor growth, recombinant expression of AMP-kinase isoforms (AMPK α1 or α2) alone in hTERT fibroblasts was not sufficient to promote tumor growth (Fig. 9). Thus, AMP-kinase activation, mediated by LKB1, is specifically required to generate this phenotype.
Figure 9. Overexpression of AMP-kinase isoforms in fibroblasts is not sufficient to promote tumor growth. AMP-kinase overexpressing fibroblasts were co-injected with MDA-MB-231-GFP+ cells into the flanks of athymic nude mice. Note that recombinant expression of AMP-kinase isoforms (AMPK α1 or α2) alone in hTERT fibroblasts was not sufficient to promote tumor growth. Thus, AMP-kinase activation, mediated by LKB1, is specifically required to enhance tumor growth. The functional effects of expression of two different isoforms of AMPK α1 was examined (559 amino acids vs. 574 amino acids). NS, not significant. n = 10 per experimental group.
GOLPH3 confers autophagy resistance and promotes mitochondrial biogenesis in breast cancer cells, enhancing anabolic tumor growth
GOLPH3 shuttles between the Golgi apparatus and mitochondria to functionally promote mitochondrial biogenesis34,35 Recently, Scott et al. identified GOLPH3 as an oncoprotein, which is genetically amplified in several tumors.35 Moreover, GOLPH3 activates the autophagy inhibitor, mTOR.35 mTOR is a direct regulator of mitochondria function, and rapamycin (an mTOR1 inhibitor) decreases mitochondrial capacity and oxygen consumption,37 likely via the induction of autophagy.
Here, we overexpressed GOLPH3 in MDA-MB-231 breast cancer cells to examine the functional effects of autophagy resistance and enhanced mitochondrial biogenesis on tumor growth. Figure 10A shows that GOLPH3 was successfully stably expressed, as detected using antibodies directed against the HA-epitope tag. Then, we validated that GOLPH3 overexpression activates mTOR-signaling (Fig. 10B) and confers autophagy resistance (Fig. 10B and C) using three autophagy markers (namely, cathepsin B, BNIP3 and LC3). Finally, GOLPH3 overexpression in MDA-MB-231 cells also increased MitoTracker staining by > 2-fold, consistent with an increase in mitochondrial biogenesis and/or function (Fig. 11A).
Figure 10. GOLPH3 overexpression in breast cancer cells confers mTOR activation and autophagy resistance. We overexpressed GOLPH3 in MDA-MB-231 breast cancer cells, to examine its functional effects on mTOR activation and autophagy resistance. (A) Note that GOLPH3 was successfully stably expressed in MDA-MB-231 cells, as detected using antibodies directed against the HA-epitope tag. (B) Under basal cell culture conditions, GOLPH3 activates mTOR hyper-phosphorylation, and a loss of cathepsin B expression. (C) Under conditions of starvation [4 h in HBSS (40 mM HEPES, pH 7.2, in Hank’s Balanced Salt Solution)], GOLPH3 confers autophagy resistance, as evidenced by a loss of BNIP3 and LC3-I/II expression. In panels A-C, immunoblotting with β-actin is shown as a control for equal protein loading.
Figure 11. GOLPH3 overexpression promotes mitochondrial biogenesis in breast cancer cells, enhancing anabolic tumor growth. (A) GOLPH3 overexpression in MDA-MB-231 cells increased MitoTracker staining by > 2-fold, consistent with an increase in mitochondrial biogenesis and/or function. (B) We injected GOLPH3 overexpressing MDA-MB-231 cells into the flanks of athymic nude mice. At 4 weeks post-injection, GOLPH3 tumors showed a 3-fold increase in growth, relative to the vector-alone control. p- values are as shown. n = 10 per experimental group. (C) No significant increases in angiogenesis were noted, as visualized by CD31 immunostaining.
Finally, we injected GOLPH3-overexpressing cancer cells into the flanks of athymic nude mice. At 4 weeks post-injection, GOLPH3 tumors showed a 3-fold increase in growth, relative to the vector-alone control (Fig. 11B). However, no significant increases in angiogenesis were noted, as visualized by CD31 immunostaining (Fig. 11C).
Importantly, the effects of GOLPH3 on tumorigenesis are compartment-specific, as overexpression of GOLPH3 in hTERT fibroblasts increased MitoTracker activity by > 1.5-fold but did not significantly affect tumor growth when GOLPH3-fibroblats were co-injected with MDA-MB-231 breast cancer cells (Fig. S1).
Thus, we conclude that the tumor-promoting and tumor-suppressing effects of autophagy are cell type-specific and are not intrinsic property of the process itself. Also, tumor suppressors (such as LKB1 and AMP-kinase) could function as tumor promoters when activated in cancer-associated fibroblasts Therefore, the compartment-specific role of tumor suppressor and promoter genes should be carefully studied in both cancer cells and adjacent stromal cells.
Discussion
Autophagy in the tumor microenvironment: Does stromal catabolism fuel anabolic tumor growth?
Recently, we showed that a loss of Cav-1 expression in the tumor stroma predicts early tumor recurrence, lymph-node metastasis, tamoxifen resistance and overall poor clinical outcome in women with breast cancer.17,18 Molecular profiling of Cav-1-deficient tumor microenvironment in breast cancer patients demonstrates the induction of target genes associated with aging, DNA damage, inflammation and especially autophagy, all of which are known to be associated with exposure to hydrogen peroxide (due to activation of key transcription factors, namely, HIF1 and NFkB).38 Thus, one idea is that oxidative stress-induced catabolism in the tumor microenvironment fuels the anabolic growth of cancer cells. We previously termed this new model of stromal-epithelial metabolic coupling the “autophagic tumor stroma model of cancer.” In accordance with this hypothesis, other laboratories have shown that the expression of autophagy-associated genes in the tumor stroma is associated with more aggressive tumor behavior and poor clinical outcome.39-41
Here, to genetically test this hypothesis, we chose to generate various pre-clinical models of autophagic cancer-associated fibroblasts via the overexpression of autophagy genes and AMP-kinase activators (DRAM and LKB1).
Autophagy (Beclin1, LAMP1 and Cathepsin B) and mitophagy (BNIP3) genes were specifically upregulated by DRAM expression in hTERT-immortalized fibroblasts. Cav-1 protein expression and mitochondrial OXPHOS complexes were also downregulated in DRAM-overexpressing fibroblasts, reflecting the onset of autophagy/mitophagy and mitochondrial dysfunction. AMP-kinase activation was also observed, indicative of the onset of metabolic dysfunction. Most importantly, consistent with our hypothesis, DRAM-overexpressing fibroblasts co-injected with MDA-MB-231 breast cancer cells showed a 2-fold increase in tumor growth relative to vector-alone control fibroblasts.
Quantitatively similar results were obtained by constitutive activation of AMP kinase via overexpression of LKB1, its upstream activator. LKB1 normally phosphorylates AMP-kinase-α on Thr-172, which initiates the activation of several metabolic pathways, such as autophagy, mitophagy and glycolysis, during cellular stress.28,42 Here, we generated constitutively autophagic fibroblasts by overexpressing wild-type (WT) LKB1. As two critical negative control(s), we also generated (1) fibroblasts overexpressing a kinase-dead (KD) form of LKB1, as well as (2) vector-alone fibroblasts. Strikingly, fibroblasts overexpressing WT-LKB1 increased tumor growth by ~2-fold, relative to the vector-alone control. Conversely, fibroblasts overexpressing KD-LKB1 reduced tumor growth by ~2.5-fold. Thus, we show for the first time that LKB1 acts as a tumor promoter in cancer-associated fibroblasts.
These findings indicate that the specific role of tumor suppressors needs be re-evaluated according to their expression in a given cell-type or metabolic tumor compartment (e.g., stromal cells vs. epithelial cancer cells).
Mitochondrial biogenesis and autophagy resistance in cancer cells promotes increased tumor growth
Next, we tested the hypothesis that mitochondrial biogenesis and autophagy resistance in epithelial cancer cells would also enhance anabolic tumor growth. For this purpose, we chose to overexpress GOLPH3 in human breast cancer cells (MDA-MB-231-GFP+). GOLPH3 is a recently discovered oncoprotein that activates the mTOR-signaling pathway.35 As predicted, GOLPH3-overexpressing MDA-MB-231 cells showed increased mTOR phosphorylation and significant reductions in both autophagy and mitophagy markers (LC3, Cathepsin B and BNIP3), consistent with the onset of autophagy resistance. In addition, GOLPH3-overexpressing MDA-MB-231 cells also showed a 2.3-fold increase in MitoTracker activity, indicative of an increase in mitochondrial biogenesis and/or function. In support of the hypothesis that mitochondrial biogenesis and autophagy resistance will promote tumor aggressiveness, GOLPH3-overexpressing MDA-MB-231 cells showed a 3-fold increase in tumor growth. Thus, we demonstrate for the first time that GOLPH3 regulates both autophagy and mitochondrial activity. As such, increased mitochondrial biogenesis or function may protect cancer cells against the induction of autophagy, by preventing AMP-kinase activation.
Our current hypothesis is also consistent with the general consensus view that cancer cells benefit from evading the autophagy (self-eating) response.43-45 There are two known molecular mechanism(s) that cancer cells use to drive autophagy resistance: (1) hyperactivation of mTOR signaling, which is a central network or pathway that can inhibit autophagy and (2) the deletion and/or suppression of autophagy-inducing genes, such as LKB1, Beclin1, PTEN, tuberous sclerosis complex (TSC) 1 and 2, DAPK-1 and wild-type p53.43-45
A schematic diagram summarizing our new findings is presented in Figure 12. Thus, targeting autophagy and/or mitochondrial function in cancer cells and the tumor microenvironment is an important strategy for the development of new prognostic markers and novel therapeutic interventions. However, it is important to note that tumor suppressor genes can also promote tumor growth when overexpressed in the tumor stromal microenvironment. Thus, interfering with “stromal-epithelial metabolic coupling” will help in the fight against cancer, as it will “cut-off the fuel supply” to cancer cells.
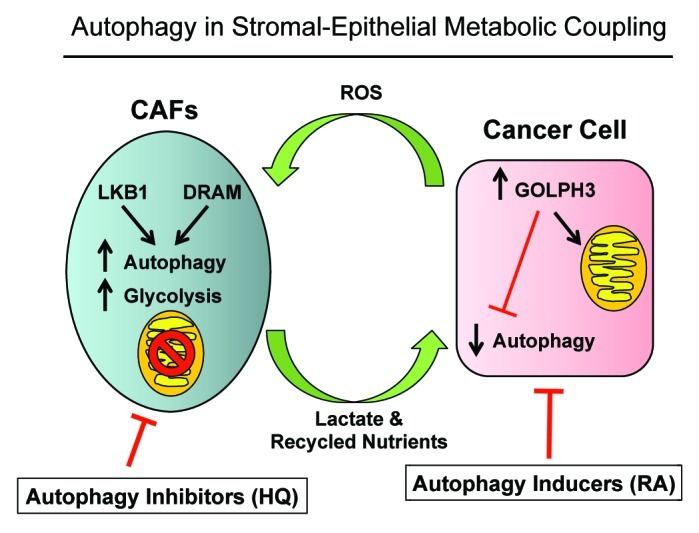
Figure 12. Autophagy and two-compartment tumor metabolism: Defining the roles of DRAM, LKB1, and GOLPH3. DRAM and LKB1 activate AMP-kinase in cancer-associated fibroblasts, driving autophagy, mitophagy, and mitochondrial dysfunction. Conversely, GOLPH3 expression in cancer cells mediates autophagy resistance, likely via the induction of mitochondrial biogenesis, or the enhancement of mitochondrial function. Thus, compartment-specific regulation of autophagy results in a “parasitic” form of stromal-epithelial metabolic coupling. HQ, hydroxy-chloroquine; RA, Rapamycin analogs. Both chloroquine and rapamycin analogs could functionally disrupt metabolic coupling, by simultaneously turning “on” or “off” autophagy in both cellular compartments (cancer cells and stromal fibroblasts). CAFs, cancer-associated fibroblasts.
Developing autophagy-based therapies for the treatment of cancer patients
The idea of targeting autophagy as a treatment for human cancers has now been embraced by the medical oncology community. However, we show here that the regulation of autophagy in tumors is highly cell type- and compartment-specific.
More specifically, our current findings show that autophagy induction in the tumor microenvironment promotes tumor growth, while autophagy resistance in cancer cells also enhances tumor growth. Thus, inhibition of autophagy in the tumor microenvironment should reduce tumor growth, while induction of autophagy in cancer cells should also inhibit tumor growth. These findings explain the well-known “autophagy paradox” of cancer therapy, that both autophagy inhibitors (chloroquine) and autophagy inducers (rapamycin) can prevent or significantly reduce tumor growth.8,9
Rapamycin is an antibiotic that has been found to inhibit mTOR1 and induce autophagy.46,47 Analogs of rapamycin, temsirolimus and everolimus, have been approved to treat renal cell carcinoma and mantle cell lymphoma.48 Also, GDC-0941 and NVP-BEZ235 are dual inhibitors of mTOR1 and PI3K, which block the feedback loop resulting from mTOR1 inhibition.49 These two promising drugs have now entered phase II trials for breast cancer treatment.49 Interestingly, temsirolimus and hydroxychloroquine (HCQ) have been used in a phase I trial for treating refractory metastatic solid tumors (http://clinicaltrials.gov/ct2/show/NCT00909831).
Hydroxy-chloroquine (HCQ; an anti-malarial drug) inhibits autophagy by disturbing the vacuolar H+ ATPase responsible for lysosomes acidification.50 A chloroquine-based clinical trial for the treatment of early human breast cancers (DCIS lesions) is now ongoing: http://clinicaltrials.gov/ct2/show/NCT01023477.
Materials and Methods
Materials
Antibodies were purchased from the following commercial sources: Anti-DRAM [# sc-98654 (H-128); Santa Cruz Biotech], anti-Cav-1 [#sc-894 (N-20); Santa Cruz Biotech], anti-Beclin1 (for immuno-blot #NBP1–00085, Novus; for immunostaining #2026–1, Epitomics), anti-LAMP1 [#sc-17768 (E-5); Santa Cruz Biotech], anti-BNIP-3 (#ab10433; Abcam), anti-Cathepsin B (#sc-13985 (FL-339); Santa Cruz Biotech), anti-OXPHOS (#MS601; Mitosciences), anti-β actin (#A5441, Sigma), anti-phospho-AMPK (#2531, Cell Signaling), anti-AMPK (#2532, Cell Signaling), anti-LKB (#sc-32245 (Ley 37D/G6); Santa Cruz Biotech), anti-mTOR (#2983; Cell Signaling), anti-phospho-mTOR (#2971; Cell Signaling) and anti-HA (#16B12; Covance). Other reagents were purchased as follows: Hoechst-33258 nuclear stain was from Sigma and Anti-fade reagent (#S2828) was from Invitrogen.
Cell cultures
MDA-MB-231 cells (a human breast triple negative cell line) and hTERT-BJ1 cells (an immortalized fibroblast cell line) were cultured in Dulbecco’s modified Eagle’s medium (DMEM), supplemented with 10% fetal bovine serum in a 37°C humidified atmosphere containing 5% CO2, unless otherwise noted.
Cell line derivation
Lentiviral vectors
Lentiviral particles were produced after 48 h of transfecting the GeneCopoeia 293Ta lentiviral packaging cell line with lentiviral plasmids [EX-NEG-Lv105 (puro)] (empty vector), DRAM (EX-W1855-Lv105), AMPK-alpha1 559-a.a. (EX-H0271-Lv105), AMPK-alpha1 574-a.a. (EX-T8424-Lv105), or AMPK-alpha2 (EX-C0433-Lv105) (all obtained from GeneCopoeia, Inc.), using the Lenti-Pac HIV Expression Packing Kit (GeneCopoeia.Inc.), according to manufacturer’s recommendations. Human immortalized fibroblasts were transduced by lentivirus particles in the presence of 5 μg/ml of Polybrene (Santa Cruz Biotech). Transduced cells were selected with 1.5 μg/ml of puromycin.
Retroviral vectors
Retroviral plasmids pBABE-puro (empty vector), LKB1 (pBABE-FLAG-LKB1, Plasmid #8592), LKB1-KD (pBABE-FLAG-KD LKB1, Plasmid #8593) and GOLPH3 (pBABE-HA-GOLPH3, Plasmid #21687) (all obtained from Addgene Inc.) were transfected into the Phoenix Amphotropic packaging cell line using the FuGene6 reagent (Roche Molecular Biochemicals) according to the manufacturer’s instructions. After 48 h, virus-containing medium was passed through a 0.45 μm filter and added to hTERT-BJ1 or MDA-MB-231-GFP cells, in the presence of 5 μg/ml Polybrene. Transduction was repeated the next day. Transduced cells were selected in the presence of 1.5 μg/ml (for hTERT-BJ1) and 2.0 μg/ml (for MDA-MB-231-GFP+) puromycin.
Immunoblot assays
Protein lysates were obtained by cell scraping into lysis buffer (10 mM Tris, pH 7.5, 150 mM NaCl, 1% Triton X-100 and 60 mM n-octylglucoside) containing protease inhibitors (Boehringer Mannheim). Samples were then incubated on a rotating platform at 4°C and were centrifuged at 12,000 × g for 10 min (at 4°C) to remove insoluble debris. Protein concentrations were analyzed using the BCA reagent (Pierce). Samples were separated by SDS-PAGE (10%-acrylamide) and transferred to nitrocellulose. All subsequent wash buffers contained 10 mM Tris, pH 8.0, 150 mM NaCl, 0.1% Tween 20, which was supplemented with 5% nonfat dry milk (Carnation) for the blocking solution and 1% bovine serum albumin (Sigma) for the antibody diluent. Horseradish peroxidase-conjugated secondary antibodies were used to visualize bound primary antibodies with an ECL detection kit (Pierce).
Immunofluorescence
Cancer cells (MDA-MB-231) and fibroblasts (hTERT-BJ1) were plated onto coverslips in 12-well plates for 48 h in DMEM supplemented with 10% Nu serum. Then, cells were rinsed with PBS containing 0.1 mM CaCl2 and 1mM MgCl2 (PBS/CM) and fixed with 2% paraformaldehyde in PBS/CM for 30 min. After fixation, cells were washed three times with PBS/CM and permeabilized with IF buffer (PBS/CM with 0.1% Triton-X100 and 0.2% bovine serum albumin) for 10 min. Then, fixed cells were quenched with 50 mM NH4Cl in PBS/CM for 10 min, rinsed and incubated with anti-beclin-1 or anti-LAMP1 antibodies for 1 h at room temperature. Cells were washed with IF buffer and incubated with fluorescent secondary antibodies (Molecular Probes) for 30 min. After washing, cells were incubated with Hoechst-33258 for nuclear staining, rinsed and mounted with ProLong Gold anti-fade (Molecular Probes). Images were acquired with a Zeiss LSM510 Meta confocal microscope system and analyzed with Zeiss LSM Browser.
Mitochondrial activity studies
We stained cell lines with MitoTracker Orange (CMTMRos; cat #M7510, Invitrogen, Inc.) to measure mitochondrial activity, as stain accumulation is dependent upon an intact mitochondrial membrane potential. Cells were cultured for 2 d in DMEM supplemented with 10% Nu serum. After 2 d, the cells were then incubated with pre-warmed MitoTracker staining solution (diluted in serum-free DMEM to a final concentration of 25 nM) for 10 min at 37°C. All subsequent steps were performed in the dark. Cells were washed in PBS, trypsinized and re-suspended in 300 μL of Binding Buffer (BD Biosciences). Cells were then analyzed by FACS. Data analysis was performed using FlowJo 8.8 software.
Pre-clinical animal studies
All animals were maintained in a pathogen-free environment/barrier facility at the Kimmel Cancer Center at Thomas Jefferson University under National Institutes of Health (NIH) guidelines. All animal protocols were approved by the Institutional Animal Care and Use Committee (IACUC). Tumor cells (MDA-MB-231-GFP+; 1 × 10⁶ cells) were injected alone or co-injected with hTERT-BJ1 fibroblasts (3 × 10⁵ cells) in 100 μl of sterile PBS into the flanks of athymic NCr nude mice (NCRNU; Taconic Farms; 6–8 weeks of age). Mice were sacrificed at 3–4 weeks post-injection; tumors were excised to determine their weight and size, using electronic calipers. Tumor volumes were calculated using the formula V = (x2y)/2, where V is the tumor volume, x is the length of the short axis, and y is the length of the long axis.
Measuring tumor angiogenesis
Tumor-frozen sections were prepared and processed, as we described previously.51 To quantify tumor angiogenesis, CD31-positive vessels were counted in 8–10 fields from four tumors of a given experimental group (within the central area of each tumor), using a 20× objective lens and an ocular grid (0.25 mm2 per field). The total numbers of vessel per unit area was calculated using ImageJ, and the data was represented graphically.
L-lactate assays
L-lactate levels were assessed according to the manufacturer’s instructions, using the EnzyChromTM L-Lactate Assay Kit (cat #ECLC-100, BioAssay Systems). For this purpose, cells were seeded in 12-well plates in complete media. The next day, the media was switched to DMEM containing 2% FBS. After 48 h, the media was collected, and the concentration of L-lactate was measured. Results were normalized for total cell number.
Ketone body production
Cells were seeded in 12-well plates in DMEM supplemented with 10% FBS. The next day, the media was switched to DMEM without red-phenol, containing 2% FBS. After 72 h, the media was collected, and the keto-acid concentration was measured according the manufacturer’s instructions using the β-Hydroxy-butyrate (β-HB) Assay Kit (Biovision, #K632). Results were normalized for either total cell number. In some experiments, Hank’s balanced salt solution (HBSS) supplemented with 40 mM Hepes was used to initiate cell starvation.
Statistical analysis
Statistical significance was examined using the Student t-test. Values of p < 0.05 were considered significant.
Supplementary Material
Acknowledgments
F.S. and her laboratory were supported by grants from the Breast Cancer Alliance (BCA) and the American Cancer Society (ACS). U.E.M. was supported by a Young Investigator Award from the Margaret Q. Landenberger Research Foundation. M.P.L. was supported by grants from the NIH/NCI (R01-CA-080250; R01-CA-098779; R01-CA-120876; R01-AR-055660), and the Susan G. Komen Breast Cancer Foundation. R.G.P. was supported by grants from the NIH/NCI (R01-CA-70896, R01-CA-75503, R01-CA-86072, and R01-CA-107382) and the Dr. Ralph and Marian C. Falk Medical Research Trust. The Kimmel Cancer Center was supported by the NIH/NCI Cancer Center Core grant P30-CA-56036 (to R.G.P.). Funds were also contributed by the Margaret Q. Landenberger Research Foundation (to M.P.L.). This project is funded, in part, under a grant with the Pennsylvania Department of Health (to M.P.L. and F.S.). The Department specifically disclaims responsibility for any analyses, interpretations or conclusions. This work was also supported, in part, by a Centre grant in Manchester from Breakthrough Breast Cancer in the UK (to A.H.) and an Advanced ERC Grant from the European Research Council.
Disclosure of Potential Conflicts of Interest
No potential conflicts of interest were disclosed.
Supplemental Material
Supplemental materials can be found at: www.landesbioscience.com/journals/cc/article/20920
Footnotes
Previously published online: www.landesbioscience.com/journals/cc/article/20920
References
- 1.Baehrecke EH. Autophagy: dual roles in life and death? Nat Rev Mol Cell Biol. 2005;6:505–10. doi: 10.1038/nrm1666. [DOI] [PubMed] [Google Scholar]
- 2.Yang S, Wang X, Contino G, Liesa M, Sahin E, Ying H, et al. Pancreatic cancers require autophagy for tumor growth. Genes Dev. 2011;25:717–29. doi: 10.1101/gad.2016111. [DOI] [PMC free article] [PubMed] [Google Scholar]
- 3.Degenhardt K, Mathew R, Beaudoin B, Bray K, Anderson D, Chen G, et al. Autophagy promotes tumor cell survival and restricts necrosis, inflammation, and tumorigenesis. Cancer Cell. 2006;10:51–64. doi: 10.1016/j.ccr.2006.06.001. [DOI] [PMC free article] [PubMed] [Google Scholar]
- 4.Qu X, Yu J, Bhagat G, Furuya N, Hibshoosh H, Troxel A, et al. Promotion of tumorigenesis by heterozygous disruption of the beclin 1 autophagy gene. J Clin Invest. 2003;112:1809–20. doi: 10.1172/JCI20039. [DOI] [PMC free article] [PubMed] [Google Scholar]
- 5.Gorzalczany Y, Gilad Y, Amihai D, Hammel I, Sagi-Eisenberg R, Merimsky O. Combining an EGFR directed tyrosine kinase inhibitor with autophagy-inducing drugs: a beneficial strategy to combat non-small cell lung cancer. Cancer Lett. 2011;310:207–15. doi: 10.1016/j.canlet.2011.07.002. [DOI] [PubMed] [Google Scholar]
- 6.Pavlides S, Vera I, Gandara R, Sneddon S, Pestell RG, Mercier I, et al. Warburg meets autophagy: cancer-associated fibroblasts accelerate tumor growth and metastasis via oxidative stress, mitophagy, and aerobic glycolysis. Antioxid Redox Signal. 2012;16:1264–84. doi: 10.1089/ars.2011.4243. [DOI] [PMC free article] [PubMed] [Google Scholar]
- 7.Martinez-Outschoorn UE, Lin Z, Trimmer C, Flomenberg N, Wang C, Pavlides S, et al. Cancer cells metabolically “fertilize” the tumor microenvironment with hydrogen peroxide, driving the Warburg effect: implications for PET imaging of human tumors. Cell Cycle. 2011;10:2504–20. doi: 10.4161/cc.10.15.16585. [DOI] [PMC free article] [PubMed] [Google Scholar]
- 8.Martinez-Outschoorn UE, Trimmer C, Lin Z, Whitaker-Menezes D, Chiavarina B, Zhou J, et al. Autophagy in cancer-associated fibroblasts promotes tumor cell survival: Role of hypoxia, HIF1 induction and NFκB activation in the tumor stromal microenvironment. Cell Cycle. 2010;9:3515–33. doi: 10.4161/cc.9.17.12928. [DOI] [PMC free article] [PubMed] [Google Scholar]
- 9.Martinez-Outschoorn UE, Whitaker-Menezes D, Pavlides S, Chiavarina B, Bonuccelli G, Casey T, et al. The autophagic tumor stroma model of cancer or “battery-operated tumor growth”: A simple solution to the autophagy paradox. Cell Cycle. 2010;9:4297–306. doi: 10.4161/cc.9.21.13817. [DOI] [PMC free article] [PubMed] [Google Scholar]
- 10.Martinez-Outschoorn UE, Lin Z, Ko YH, Goldberg AF, Flomenberg N, Wang C, et al. Understanding the metabolic basis of drug resistance: therapeutic induction of the Warburg effect kills cancer cells. Cell Cycle. 2011;10:2521–8. doi: 10.4161/cc.10.15.16584. [DOI] [PMC free article] [PubMed] [Google Scholar]
- 11.Martinez-Outschoorn UE, Sotgia F, Lisanti MP. Power surge: supporting cells “fuel” cancer cell mitochondria. Cell Metab. 2012;15:4–5. doi: 10.1016/j.cmet.2011.12.011. [DOI] [PubMed] [Google Scholar]
- 12.Whitaker-Menezes D, Martinez-Outschoorn UE, Lin Z, Ertel A, Flomenberg N, Witkiewicz AK, et al. Evidence for a stromal-epithelial “lactate shuttle” in human tumors: MCT4 is a marker of oxidative stress in cancer-associated fibroblasts. Cell Cycle. 2011;10:1772–83. doi: 10.4161/cc.10.11.15659. [DOI] [PMC free article] [PubMed] [Google Scholar]
- 13.Whitaker-Menezes D, Martinez-Outschoorn UE, Flomenberg N, Birbe RC, Witkiewicz AK, Howell A, et al. Hyperactivation of oxidative mitochondrial metabolism in epithelial cancer cells in situ: visualizing the therapeutic effects of metformin in tumor tissue. Cell Cycle. 2011;10:4047–64. doi: 10.4161/cc.10.23.18151. [DOI] [PMC free article] [PubMed] [Google Scholar]
- 14.Ertel A, Tsirigos A, Whitaker-Menezes D, Birbe RC, Pavlides S, Martinez-Outschoorn UE, et al. Is cancer a metabolic rebellion against host aging? In the quest for immortality, tumor cells try to save themselves by boosting mitochondrial metabolism. Cell Cycle. 2012;11:253–63. doi: 10.4161/cc.11.2.19006. [DOI] [PMC free article] [PubMed] [Google Scholar]
- 15.Sloan EK, Ciocca DR, Pouliot N, Natoli A, Restall C, Henderson MA, et al. Stromal cell expression of caveolin-1 predicts outcome in breast cancer. Am J Pathol. 2009;174:2035–43. doi: 10.2353/ajpath.2009.080924. [DOI] [PMC free article] [PubMed] [Google Scholar]
- 16.Di Vizio D, Morello M, Sotgia F, Pestell RG, Freeman MR, Lisanti MP. An absence of stromal caveolin-1 is associated with advanced prostate cancer, metastatic disease and epithelial Akt activation. Cell Cycle. 2009;8:2420–4. doi: 10.4161/cc.8.15.9116. [DOI] [PMC free article] [PubMed] [Google Scholar]
- 17.Witkiewicz AK, Casimiro MC, Dasgupta A, Mercier I, Wang C, Bonuccelli G, et al. Towards a new “stromal-based” classification system for human breast cancer prognosis and therapy. Cell Cycle. 2009;8:1654–8. doi: 10.4161/cc.8.11.8544. [DOI] [PubMed] [Google Scholar]
- 18.Witkiewicz AK, Dasgupta A, Nguyen KH, Liu C, Kovatich AJ, Schwartz GF, et al. Stromal caveolin-1 levels predict early DCIS progression to invasive breast cancer. Cancer Biol Ther. 2009;8:1071–9. doi: 10.4161/cbt.8.11.8874. [DOI] [PubMed] [Google Scholar]
- 19.Wu KN, Queenan M, Brody JR, Potoczek M, Sotgia F, Lisanti MP, et al. Loss of stromal caveolin-1 expression in malignant melanoma metastases predicts poor survival. Cell Cycle. 2011;10:4250–5. doi: 10.4161/cc.10.24.18551. [DOI] [PubMed] [Google Scholar]
- 20.Witkiewicz AK, Whitaker-Menezes D, Dasgupta A, Philp NJ, Lin Z, Gandara R, et al. Using the “reverse Warburg effect” to identify high-risk breast cancer patients: stromal MCT4 predicts poor clinical outcome in triple-negative breast cancers. Cell Cycle. 2012;11:1108–17. doi: 10.4161/cc.11.6.19530. [DOI] [PMC free article] [PubMed] [Google Scholar]
- 21.Sotgia F, Martinez-Outschoorn UE, Howell A, Pestell RG, Pavlides S, Lisanti MP. Caveolin-1 and cancer metabolism in the tumor microenvironment: markers, models, and mechanisms. Annu Rev Pathol. 2012;7:423–67. doi: 10.1146/annurev-pathol-011811-120856. [DOI] [PubMed] [Google Scholar]
- 22.Maiuri MC, Galluzzi L, Morselli E, Kepp O, Malik SA, Kroemer G. Autophagy regulation by p53. Curr Opin Cell Biol. 2010;22:181–5. doi: 10.1016/j.ceb.2009.12.001. [DOI] [PubMed] [Google Scholar]
- 23.Maiuri MC, Zalckvar E, Kimchi A, Kroemer G. Self-eating and self-killing: crosstalk between autophagy and apoptosis. Nat Rev Mol Cell Biol. 2007;8:741–52. doi: 10.1038/nrm2239. [DOI] [PubMed] [Google Scholar]
- 24.Crighton D, Wilkinson S, O’Prey J, Syed N, Smith P, Harrison PR, et al. DRAM, a p53-induced modulator of autophagy, is critical for apoptosis. Cell. 2006;126:121–34. doi: 10.1016/j.cell.2006.05.034. [DOI] [PubMed] [Google Scholar]
- 25.Lorin S, Borges A, Ribeiro Dos Santos L, Souquère S, Pierron G, Ryan KM, et al. c-Jun NH2-terminal kinase activation is essential for DRAM-dependent induction of autophagy and apoptosis in 2-methoxyestradiol-treated Ewing sarcoma cells. Cancer Res. 2009;69:6924–31. doi: 10.1158/0008-5472.CAN-09-1270. [DOI] [PubMed] [Google Scholar]
- 26.Polager S, Ofir M, Ginsberg D. E2F1 regulates autophagy and the transcription of autophagy genes. Oncogene. 2008;27:4860–4. doi: 10.1038/onc.2008.117. [DOI] [PubMed] [Google Scholar]
- 27.Crighton D, O’Prey J, Bell HS, Ryan KM. p73 regulates DRAM-independent autophagy that does not contribute to programmed cell death. Cell Death Differ. 2007;14:1071–9. doi: 10.1038/sj.cdd.4402108. [DOI] [PubMed] [Google Scholar]
- 28.Alexander A, Walker CL. The role of LKB1 and AMPK in cellular responses to stress and damage. FEBS Lett. 2011;585:952–7. doi: 10.1016/j.febslet.2011.03.010. [DOI] [PubMed] [Google Scholar]
- 29.Hemminki A, Markie D, Tomlinson I, Avizienyte E, Roth S, Loukola A, et al. A serine/threonine kinase gene defective in Peutz-Jeghers syndrome. Nature. 1998;391:184–7. doi: 10.1038/34432. [DOI] [PubMed] [Google Scholar]
- 30.Hardie DG. AMP-activated protein kinase: an energy sensor that regulates all aspects of cell function. Genes Dev. 2011;25:1895–908. doi: 10.1101/gad.17420111. [DOI] [PMC free article] [PubMed] [Google Scholar]
- 31.Mu J, Brozinick JT, Jr., Valladares O, Bucan M, Birnbaum MJ. A role for AMP-activated protein kinase in contraction- and hypoxia-regulated glucose transport in skeletal muscle. Mol Cell. 2001;7:1085–94. doi: 10.1016/S1097-2765(01)00251-9. [DOI] [PubMed] [Google Scholar]
- 32.Hawley SA, Ross FA, Chevtzoff C, Green KA, Evans A, Fogarty S, et al. Use of cells expressing gamma subunit variants to identify diverse mechanisms of AMPK activation. Cell Metab. 2010;11:554–65. doi: 10.1016/j.cmet.2010.04.001. [DOI] [PMC free article] [PubMed] [Google Scholar]
- 33.Sanchez AM, Csibi A, Raibon A, Cornille K, Gay S, Bernardi H, et al. AMPK promotes skeletal muscle autophagy through activation of forkhead FoxO3a and interaction with Ulk1. J Cell Biochem. 2012;113:695–710. doi: 10.1002/jcb.23399. [DOI] [PubMed] [Google Scholar]
- 34.Nakashima-Kamimura N, Asoh S, Ishibashi Y, Mukai Y, Shidara Y, Oda H, et al. MIDAS/GPP34, a nuclear gene product, regulates total mitochondrial mass in response to mitochondrial dysfunction. J Cell Sci. 2005;118:5357–67. doi: 10.1242/jcs.02645. [DOI] [PubMed] [Google Scholar]
- 35.Scott KL, Kabbarah O, Liang MC, Ivanova E, Anagnostou V, Wu J, et al. GOLPH3 modulates mTOR signalling and rapamycin sensitivity in cancer. Nature. 2009;459:1085–90. doi: 10.1038/nature08109. [DOI] [PMC free article] [PubMed] [Google Scholar]
- 36.Chiavarina B, Whitaker-Menezes D, Migneco G, Martinez-Outschoorn UE, Pavlides S, Howell A, et al. HIF1-alpha functions as a tumor promoter in cancer-associated fibroblasts, and as a tumor suppressor in breast cancer cells: Autophagy drives compartment-specific oncogenesis. Cell Cycle. 2010;9:3534–51. doi: 10.4161/cc.9.17.12908. [DOI] [PMC free article] [PubMed] [Google Scholar]
- 37.Ramanathan A, Schreiber SL. Direct control of mitochondrial function by mTOR. Proc Natl Acad Sci USA. 2009;106:22229–32. doi: 10.1073/pnas.0912074106. [DOI] [PMC free article] [PubMed] [Google Scholar]
- 38.Witkiewicz AK, Kline J, Queenan M, Brody JR, Tsirigos A, Bilal E, et al. Molecular profiling of a lethal tumor microenvironment, as defined by stromal caveolin-1 status in breast cancers. Cell Cycle. 2011;10:1794–809. doi: 10.4161/cc.10.11.15675. [DOI] [PMC free article] [PubMed] [Google Scholar]
- 39.Nomura H, Uzawa K, Yamano Y, Fushimi K, Ishigami T, Kouzu Y, et al. Overexpression and altered subcellular localization of autophagy-related 16-like 1 in human oral squamous-cell carcinoma: correlation with lymphovascular invasion and lymph-node metastasis. Hum Pathol. 2009;40:83–91. doi: 10.1016/j.humpath.2008.06.018. [DOI] [PubMed] [Google Scholar]
- 40.Kleer CG, Bloushtain-Qimron N, Chen YH, Carrasco D, Hu M, Yao J, et al. Epithelial and stromal cathepsin K and CXCL14 expression in breast tumor progression. Clin Cancer Res. 2008;14:5357–67. doi: 10.1158/1078-0432.CCR-08-0732. [DOI] [PMC free article] [PubMed] [Google Scholar]
- 41.Nadji M, Fresno M, Nassiri M, Conner G, Herrero A, Morales AR. Cathepsin D in host stromal cells, but not in tumor cells, is associated with aggressive behavior in node-negative breast cancer. Hum Pathol. 1996;27:890–5. doi: 10.1016/S0046-8177(96)90214-2. [DOI] [PubMed] [Google Scholar]
- 42.Emerling BM, Weinberg F, Snyder C, Burgess Z, Mutlu GM, Viollet B, et al. Hypoxic activation of AMPK is dependent on mitochondrial ROS but independent of an increase in AMP/ATP ratio. Free Radic Biol Med. 2009;46:1386–91. doi: 10.1016/j.freeradbiomed.2009.02.019. [DOI] [PMC free article] [PubMed] [Google Scholar]
- 43.Liang XH, Jackson S, Seaman M, Brown K, Kempkes B, Hibshoosh H, et al. Induction of autophagy and inhibition of tumorigenesis by beclin 1. Nature. 1999;402:672–6. doi: 10.1038/45257. [DOI] [PubMed] [Google Scholar]
- 44.Maiuri MC, Tasdemir E, Criollo A, Morselli E, Vicencio JM, Carnuccio R, et al. Control of autophagy by oncogenes and tumor suppressor genes. Cell Death Differ. 2009;16:87–93. doi: 10.1038/cdd.2008.131. [DOI] [PubMed] [Google Scholar]
- 45.Morselli E, Galluzzi L, Kepp O, Vicencio JM, Criollo A, Maiuri MC, et al. Anti- and pro-tumor functions of autophagy. Biochim Biophys Acta. 2009;1793:1524–32. doi: 10.1016/j.bbamcr.2009.01.006. [DOI] [PubMed] [Google Scholar]
- 46.Kunz J, Henriquez R, Schneider U, Deuter-Reinhard M, Movva NR, Hall MN. Target of rapamycin in yeast, TOR2, is an essential phosphatidylinositol kinase homolog required for G1 progression. Cell. 1993;73:585–96. doi: 10.1016/0092-8674(93)90144-F. [DOI] [PubMed] [Google Scholar]
- 47.Loewith R, Jacinto E, Wullschleger S, Lorberg A, Crespo JL, Bonenfant D, et al. Two TOR complexes, only one of which is rapamycin sensitive, have distinct roles in cell growth control. Mol Cell. 2002;10:457–68. doi: 10.1016/S1097-2765(02)00636-6. [DOI] [PubMed] [Google Scholar]
- 48.Ciuffreda L, Di Sanza C, Incani UC, Milella M. The mTOR pathway: a new target in cancer therapy. Curr Cancer Drug Targets. 2010;10:484–95. doi: 10.2174/156800910791517172. [DOI] [PubMed] [Google Scholar]
- 49.Babcock JT, Quilliam LA. Rheb/mTOR activation and regulation in cancer: novel treatment strategies beyond rapamycin. Curr Drug Targets. 2011;12:1223–31. doi: 10.2174/138945011795906589. [DOI] [PubMed] [Google Scholar]
- 50.Amaravadi RK, Lippincott-Schwartz J, Yin XM, Weiss WA, Takebe N, Timmer W, et al. Principles and current strategies for targeting autophagy for cancer treatment. Clin Cancer Res. 2011;17:654–66. doi: 10.1158/1078-0432.CCR-10-2634. [DOI] [PMC free article] [PubMed] [Google Scholar]
- 51.Chiavarina B, Whitaker-Menezes D, Martinez-Outschoorn UE, Witkiewicz AK, Birbe RC, Howell A, et al. Pyruvate kinase expression (PKM1 and PKM2) in cancer-associated fibroblasts drives stromal nutrient production and tumor growth. Cancer Biol Ther. 2011;12:1101–13. doi: 10.4161/cbt.12.12.18703. [DOI] [PMC free article] [PubMed] [Google Scholar]
Associated Data
This section collects any data citations, data availability statements, or supplementary materials included in this article.


