Abstract
Background
Ascorbic acid demonstrates a cytotoxic effect by generating hydrogen peroxide, a reactive oxygen species (ROS) involved in oxidative cell stress. A panel of eleven human cancer cell lines, glioblastoma and carcinoma, were exposed to serial dilutions of ascorbic acid (5-100 mmol/L). The purpose of this study was to analyse the impact of catalase, an important hydrogen peroxide-detoxifying enzyme, on the resistance of cancer cells to ascorbic acid mediated oxidative stress.
Methods
Effective concentration (EC50) values, which indicate the concentration of ascorbic acid that reduced the number of viable cells by 50%, were detected with the crystal violet assay. The level of intracellular catalase protein and enzyme activity was determined. Expression of catalase was silenced by catalase-specific short hairpin RNA (sh-RNA) in BT-20 breast carcinoma cells. Oxidative cell stress induced apoptosis was measured by a caspase luminescent assay.
Results
The tested human cancer cell lines demonstrated obvious differences in their resistance to ascorbic acid mediated oxidative cell stress. Forty-five percent of the cell lines had an EC50 > 20 mmol/L and fifty-five percent had an EC50 < 20 mmol/L. With an EC50 of 2.6–5.5 mmol/L, glioblastoma cells were the most susceptible cancer cell lines analysed in this study. A correlation between catalase activity and the susceptibility to ascorbic acid was observed. To study the possible protective role of catalase on the resistance of cancer cells to oxidative cell stress, the expression of catalase in the breast carcinoma cell line BT-20, which cells were highly resistant to the exposure to ascorbic acid (EC50: 94,9 mmol/L), was silenced with specific sh-RNA. The effect was that catalase-silenced BT-20 cells (BT-20 KD-CAT) became more susceptible to high concentrations of ascorbic acid (50 and 100 mmol/L).
Conclusions
Fifty-five percent of the human cancer cell lines tested were unable to protect themselves against oxidative stress mediated by ascorbic acid induced hydrogen peroxide production. The antioxidative enzyme catalase is important to protect cancer cells against cytotoxic hydrogen peroxide. Silenced catalase expression increased the susceptibility of the formerly resistant cancer cell line BT-20 to oxidative stress.
Background
Ascorbic acid (vitamin C), an essential nutrient for mammalian cells, acts as a cofactor of different enzymatic reactions, e.g. collagen synthesis. In addition, ascorbic acid has an important impact on oxidative stress caused by reactive oxygen species (ROS). Some of the most common ROS are superoxide anion, hydroxide radical and hydrogen peroxide [1]. The production of ROS is an inevitable outcome of aerobic respiration in mitochondria where oxygen acts as electron acceptor. Disturbances in aerobic respiration can lead to oxidative stress by the production of ROS, resulting in cellular senescence and apoptosis [2,3]. Antioxidant enzymes, part of the physiological defence mechanisms in mammalian cells against high concentrations of ROS, detoxify ROS into less toxic or inert molecules [4,5]. One prominent hydrogen peroxide-detoxifying enzyme is catalase.
Different studies showed a toxic effect of extracellular ascorbic acid on a variety of cancer cell lines [6]‐[9]. The key to the anti-tumour effect of ascorbic acid is the production of cytotoxic hydrogen peroxide [10,11]. Ascorbic acid has many known interactions with metal ions, catalysing its oxidation with concomitant formation of hydrogen peroxide, among other things. [12,13]. Chen et al. analysed the anticancer effect of extracellular ascorbic acid in pharmacological concentrations (up to 20 mmol/L), with the result that most cancer cells, but not normal cells, were affected by 20 mmol/L ascorbic acid, a concentration easily obtainable by intravenous injection [9].
In this paper we present a panel of 11 human cancer cell lines, carcinomas and glioblastomas, in which 55% of the cell lines were more susceptible (EC50 ≤ 20 mmol/L) and 45% were more resistant (EC50 >20 mmol/L) to the incubation with ascorbic acid. In addition, the two benign cell types (endothelial cells and fibroblasts) belong to the more resistant cell group. The reason for the resistance of some tumour cell lines and the benign cells to ascorbic acid mediated hydrogen peroxide production may be due to efficient antioxidant defences. Immunohistochemistry has shown that cancer cells can have elevated levels of antioxidant enzymes [14], but many of them seem to be deficient in catalase protein or catalase activity [15]. Therefore, the impact of intracellular catalase on preventing oxidative stress mediated by hydrogen peroxide must be analysed in more detail. We found that the 3 glioblastoma cell lines are extremely susceptible to ascorbic acid revealed reduced activity of intracellular catalase. In contrast, ascorbic acid resistant cancer cell lines, for example the breast carcinoma cell line BT-20, exhibited increased catalase protein and enzymatic activity. A catalase knockdown in BT-20 cells sensitized them to the toxic effect of extracellular ascorbic acid. The results indicate that catalase is important for the resistance of cancer cells to oxidative stress mediated by hydrogen peroxide.
Material and methods
Cell lines and reagents
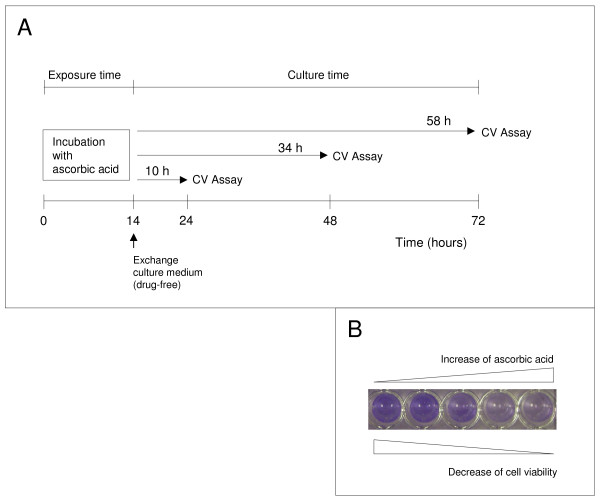
Eleven malignant and 2 benign human cell lines were tested (Table 1). Cells were cultured at a cell density of 1.5 × 10⁴ cells per well of a 96-well plate at 37°C in 5% CO2 in their recommended growth media containing 10% FCS, 2 mmol/L glutamine (Invitrogen) and treated with ascorbic acid (5, 10, 15, 20, 25, 50, 100 mmol/L, pH 7; Sigma-Aldrich) for 14 h (Figure 1). Subsequently the medium was removed, the cells were washed once and cultured in growth medium without ascorbic acid for an additional 10, 34 and 58 h (Figure 1). Ascorbic acid was buffered to pH 7.0 with sodium hydroxide and prepared immediately before use. Selected cell lines (BT-20, SKOV-3, 23132/87, U-251, U-87) were also exposed to serial dilutions (10, 50, 100, 200 μmol/L) of hydrogen peroxide (Sigma-Aldrich) for 2 h. The medium was then removed and cells were washed and cultured in growth medium for an additional 22 h without hydrogen peroxide.
Table 1.
Panel of human cell lines tested in this study
| Cell line | Cell line | ||
|---|---|---|---|
| 23132/87 |
gastric carcinoma |
HT-29 |
colon carcinoma |
| SKOV-3 |
ovarian carcinoma |
BXPC-3 |
pancreas carcinoma |
| BT-20 |
breast carcinoma |
MCF-7 |
breast carcinoma |
| U-13898 |
glioblastoma |
MDA-MB-468 |
breast carcinoma |
| U-87 |
glioblastoma |
MDA-MB-231 |
breast carcinoma |
| U-251 |
glioblastoma |
|
|
| HUVEC | endothelial cells | NHDF | fibroblasts |
The cells were purchased from different suppliers, e.g. American Type Culture Collection (http://www.atcc.org), Health Protection Agency Culture Collection (http://www.hpacultures.org.uk), German Collection of Microorganism and Cell Culture (http://www.dsmz.de) and PromoCell (http://www.promocell.com).
Figure 1.
The experimental design for measuring the ascorbic acid mediated cytotoxic effect. (A) Cells in logarithmic growth phase were exposed to serial dilutions of ascorbic acid (5-100 mmol/L) for 14 h (exposure time). Afterwards, the cells were washed and cultured in cultured medium free of ascorbic acid, for 10, 34 and 58 h. (B) The number of viable cells was measured after culture by crystal violet (CV) staining with an ELISA reader.
Measurement of cytotoxicity
Effective concentration (EC50) values, which indicate the concentration of ascorbic acid that reduced the number of viable cells by 50%, were determined after culture (Figure 1) by the crystal violet assay [16]. This assay is based on the photometric measurement of crystal violet, which bonds at the DNA of viable cells. The measured OD values at a wave length of 570 nm are directly proportional to the number of viable cells. Data are presented as the mean ± standard deviation of hexaplicates for each ascorbic acid concentration. The experiments were repeated independently three times each.
Determination of catalase levels
The level of catalase protein expression was detected by western blot analysis in the following cell lines: BT-20, SKOV-3, 23132/87, U-251, U-87. Cell pellets were lysed with the ready-to-use solution M-PER (Pierce, ThermoFisher Scientific). Protein concentration was determined by Bradford Assay (Pierce) and 20 μg of protein per slot was separated by SDS/Page and subsequently transferred onto nitrocellulose membrane (Whatman, GE Healthcare). Protein transfer was confirmed with the prestained protein ladder from Fermentas, Life Science (#SM0671). A polyclonal anti-human catalase antibody (diluted 1:200 (#sc-34282) Santa Cruz Biotechnology) and anti-human β-actin (diluted 1:200 (#sc-130301) Santa Cruz) were used as primary antibody, and a donkey anti-goat IgG secondary antibody coupled to horseradish peroxidase (1:20,000 (#sc-2020) Santa Cruz) was applied for one hour at room temperature. The enhanced chemiluminescent reagent ECL was used for detection (Amersham, GE Healthcare). Immunoblots were scanned and analysed by using Image J program provided by the National Institutes of Health. Relative expression level was determined by densitometry and normalized to the expression of β-actin.
Inhibition of catalase gene expression by short hairpin RNA (sh-RNA)
Expression of catalase was knocked down with Q-tech by SIRION Biotech (http://www.sirion-biotech.de). Expression of catalase (NM_001752) was silenced in BT-20 cells by sh-RNA after transducing with adenoviral vector Ad-shCAT under the control of the human U6 promotor (performed by SIRION Biotech). BT-20 Ctrl cells were transduced with Q-tech control vector containing the non-target (NT) sh-RNA sequence CAACAAGATGAAGAGCACCAA. Virus production was carried out in HEK 293 cells.
Catalase activity assay
Catalase activity was determined with a commercially available assay kit and was performed according the manufacture’s instructions (http://www.cellbiolabs.com). Cell Biolabs’ OxiSelect Catalase Activity Assay (#STA-341) involves two reactions. Cells were harvested with a rubber policeman and collected by centrifugation (2000 xg for 10 min at 4°C). The cell pellets were sonicated in 1 ml cold PBS and centrifuged at 10,000 xg for 15 min at 4°C. Twenty μl of supernatant were used for the assay. The first reaction is the catalase induced decomposition of known amounts of hydrogen peroxide into water and oxygen. The remaining hydrogen peroxide in the reaction mixture mediates a second reaction with a chromogenic reagent to a quinoneimine dye coupling product measuring at 520 nm. The rate of hydrogen peroxide disintegration is proportional to the concentration of catalase. Catalase activity was calculated with the following formula: B/30 × V × sample dilution factor = nmol/min/ml = mU/ml; B is the amount of decomposed hydrogen peroxide from hydrogen peroxide standard curve in mmol/L and V is the pretreated sample volume in ml added into the reaction; 30 is the reaction time, 30 min. Catalase activity was normalized for protein concentration (determined by Bradford Assay) and expressed as mU per 100 μg of protein.
Determination of caspase activity
The Caspase-Glo 3/7 luminescent assay was performed according the manufacture’s instructions (http://www.promega.com). These members of the cysteine aspartic acid-specific protease (caspase) family play key effector roles in apoptosis in mammalian cells. The assay provides a proluminescent caspase-3/7 substrate, which contains the tetrapeptide sequence DEVD. This substrate is cleaved to release aminoluciferin, a substrate of luciferase used in the production of light. The generated luminescent signal is proportional to caspase-3/7 activity and was measured with a luminometer (Genios Pro; Tecan, Switzerland).
Statistical analysis
GraphPad Prism 4.0 software (Statcon, Witzenhausen, Germany) was used for statistical analyses. Data were analysed by Mann-Whitney U test to show significant differences between the groups after the nonparametric rank variance test of Puri and Sen. Probability values below 0.05 were considered significant.
Results
The cytotoxic effect of ascorbic acid on different human cancer cell lines
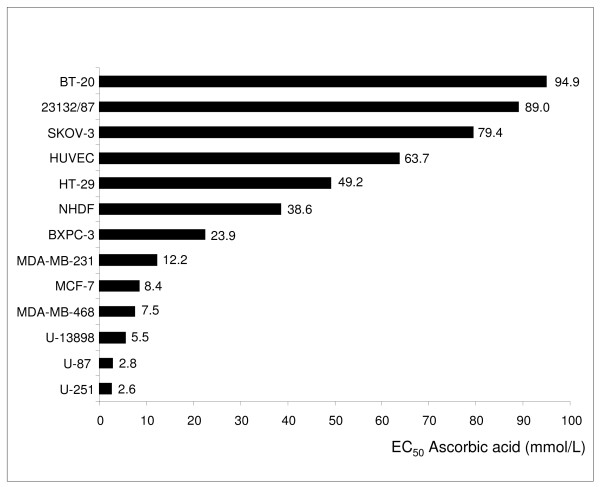
The toxic effect of ascorbic acid was analysed on 11 malignant and 2 benign cell lines (Table 1). For this purpose, the cells were exposed to ascorbic acid in vitro for 14 h, subsequently the medium was removed and the cells were cultured without ascorbic acid for an additional 10, 34 and 58 h (Figure 1) to determine the concentration that decreased cell survival to 50% (EC50). The tested cell lines demonstrated obvious differences in their resistance to ascorbic acid (Figure 2). Five cancer cell lines had an EC50 > 20 mmol/L (up to 20 mmol/L: the possible pharmacological concentration available by intravenous injection [9]) and within this group the 3 cell lines SKOV-3, 23123/87, and BT-20 demonstrated an EC50 > 79 mmol/L (Table 2). A moderate EC50 between 20 and 79 mmol/L was determined for the 2 cancer cell lines BXPC-3, and HT-29. Six cancer cell lines exhibited an EC50 < 20 mmol/L: U-251, U-87, U-13898, MDA-MB-468, MCF-7, and MDA-MB-231. The origin of the cancer cells did not explain their susceptibility to ascorbic acid mediated cytotoxicity. While the breast carcinoma cell line BT-20 was highly resistant to the exposure to ascorbic acid (EC50: 94.9 mmol/L), the breast carcinoma cell lines MDA-MB-231 (EC50: 12.2 mmol/L) and MDA-MB-468 (EC50: 7.5 mmol/L) were more susceptible. Fibroblasts and endothelial cells demonstrated EC50 values of 38.6 and 63.7 mmol/L, respectively (Figure 2).
Figure 2.
Relative cytotoxicity of ascorbic acid on cancer and benigne cells. Shown are the EC50 values of different cell lines for an ascorbic acid exposure time of 14 h and an ascorbic acid free culture time of 34 h. Cell viability was measured with the crystal violet assay at the end of culture. The results shown are representative for 3 independent analyses.
Table 2.
Relative cytotoxicity of ascorbic acid and hydrogen peroxide (H2O2) on cancer cells
| Cell line | EC50ascorbic acid (mmol/L) | EC50H2O2(μmol/L) |
|---|---|---|
| BT-20 |
94.9 |
241,2 |
| SKOV-3 |
79.4 |
172,0 |
| 23132/87 |
89.0 |
165,5 |
| U-87 |
2.8 |
96.6 |
| U-251 | 2.6 | 77.1 |
Five cancer cell lines, characterized by their different susceptibility to the ascorbic acid-mediated cytotoxic effect based on the generation of hydrogen peroxide, were analysed for their susceptibility to hydrogen peroxide-mediated cytotoxicity.
Ascorbic acid resistant human cancer cell lines are cross-resistant to hydrogen peroxide
The toxicity of extracellular ascorbic acid is caused by the generation of hydrogen peroxide [10,11]. The ascorbic acid induced generation of extracellular hydrogen peroxide was successfully detected (not shown). Therefore, cancer cells lines resistant to the ascorbic acid mediated cytotoxic effect should also be more resistant to the toxic effect of hydrogen peroxide than ascorbic acid susceptible cell lines. To confirm this assumption, the 3 cancer cell lines BT-20, SKOV-3, 23132/89, more resistant to the toxic effect of ascorbic acid, and the 2 sensitive cell lines U-251, and U-87 were incubated with different concentrations of hydrogen peroxide. The cancer cell line BT-20, highly resistant to the toxic effect mediated by ascorbic acid, was also highly resistant to the toxic effect mediated by hydrogen peroxide (Table 2). In contrast, the glioblastoma cell lines U-251 and U-87, extremely susceptible to the ascorbic acid mediated cytotoxic effect (EC50 < 5.0 mmol/L), were most sensitive to hydrogen peroxide, too (Table 2).
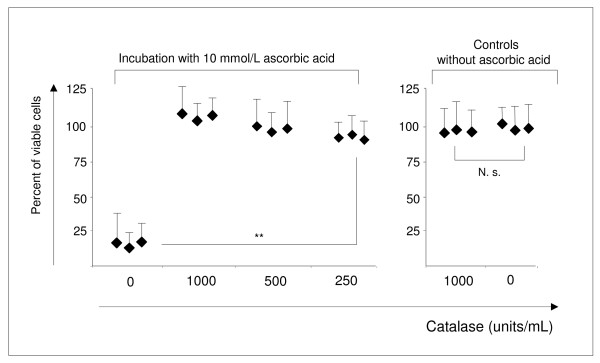
Adding exogenous catalase to glioblastoma cell lines protected them against the toxic effect of ascorbic acid. The glioblastoma cell line U-251, extremely sensitive to the exposure to ascorbic acid (EC50: 2.6 mmol/L), was incubated with 10 mmol/L ascorbic acid, the toxic concentration for this cell line, and different concentrations of catalase (250 - 1000 U/mL) for 4 h. The cells were subsequently cultured for 20 h before measuring cell viability. The presence of exogenous catalase during exposure time (Figure 1) prevented the toxic effect of both ascorbic acid (Figure 3) and hydrogen peroxide (not shown). The same results were obtained for the cell line U-87 (not shown).
Figure 3.
The hydrogen peroxide scavenger catalase prevents the cytotoxic effect of ascorbic acid-mediated hydrogen peroxide production. The addition of exogenous catalase to cells of the U-251 cell line incubated with toxic concentrations of ascorbic acid (10 mmol/L) prevented the lethal effect elicited by ascorbic acid. U-251 cells incubated with catalase alone were not affected in their viability. The results shown are representative for 3 independent analyses and values are expressed as mean ± standard deviation of hexaplicates. The difference between 0 and 250 units/mL catalase is significant (p = 0.004). N.s.: not significant.
Catalase protein and enzymatic activity in human cancer cells correlate with an increased resistance to ascorbic acid mediated cell toxicity
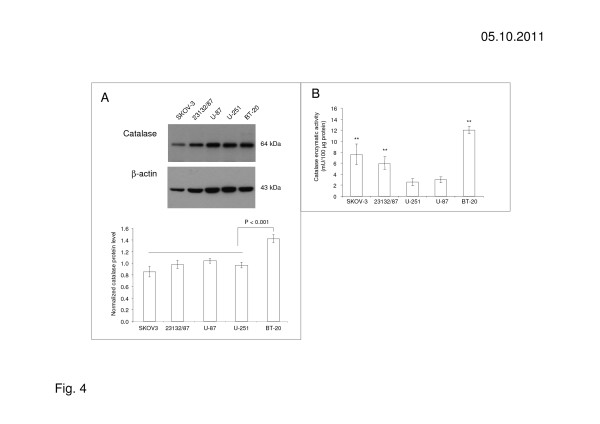
The addition of exogenous catalase to ascorbic acid susceptible cancer cell lines neutralizes the cytotoxic effect of ascorbic acid. Therefore, we investigated the assumption that ascorbic acid resistant cells protect themselves by increasing expression of intracellular catalase. For this, the 5 cell lines BT-20, SKOV-3, 23132/89, U-251, and U-87, characterized by different sensitivities to ascorbic acid, were examined concerning the catalase protein levels by immunoblot. Compared to other cancer cell lines, the level of catalase protein was significantly higher in BT-20 cells highly resistant to the ascorbic acid mediated cytotoxic effect compared to the other cancer cell lines (Figure 4). Since protein expression does not always correlate directly with enzymatic activity, an enzymatic assay was used to determine catalase activity. Catalase activity in the ascorbic acid resistant cell lines SKOV-3, 23132/87 and BT-20 was significantly increased in comparison to catalase activity measured in the ascorbic acid non-resistant cell lines U-87 and U-251 (Figure 4B).
Figure 4.
Catalase protein and enzymatic activity in ascorbic acid resistant and susceptible cells. (A) Immunoblots and densitometric analyses of catalase protein, and (B) enzymatic activity in ascorbic acid resistant cancer cell lines (BT-20, 23132/87, SKOV-3) and ascorbic acid susceptible cancer cell lines (U-251, U-87). The protein level of catalase in ascorbic acid resistant BT-20 cells is significantly different (p < 0.001) to the levels in 23132/87, SKOV-3 and the ascorbic acid susceptible cell lines U-251, U-87. There is a correlation between catalase activity and resistance to the ascorbic acid mediated cytotoxic effect. The results shown are representative for 3 independent analyses. Values are expressed as mean ± standard deviation and significant differences (p ≤ 0.01) are shown (**) compared to U-251 and U-87, respectively.
Silencing catalase expression in BT-20 cancer cells increased their susceptibility to the toxicity of ascorbic acid
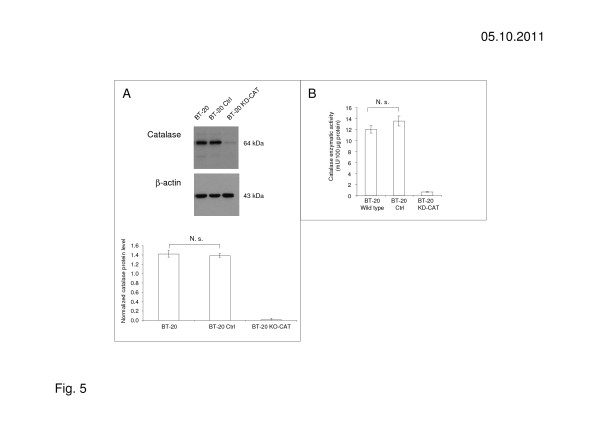
To study the possible protective role of catalase in ascorbic acid resistant cancer cell lines, the expression of catalase was silenced in the ascorbic acid resistant breast carcinoma cell line BT-20 with specific sh-RNA. BT-20 control cells (BT-20 Ctrl) was transduced with a control vector coding for non-target sh-RNA. The knock-down effect of sh-RNA transduction on the expression of catalase protein was proved by western blot (Figure 5). The maximum level of catalase knock-down was found to be 90% with RT-qPCR (not shown) and 95% in western blot (Figure 5A). In addition, the catalase enzymatic activity was reduced > 97% by knock-down (Figure 5B). BT-20 KD-CAT cells, BT-20 Ctrl cells and BT-20 wild type cells did not demonstrate obvious differences in cell morphology and cell growth (not shown).
Figure 5.
Catalase-silencing influenced catalase expression and activity in BT-20 KD-CAT cells. (A) Catalase knock-down by sh-RNA was proofed by western blot. (B) BT-20 KD-CAT cells demonstrated strongly reduced catalase activity in contrast to BT-20 wild type cells (BT-20 WT) and BT-20 control cells (BT-20 Ctrl) transduced with Q-tech control vector containing the non-target sh-RNA sequence CAACAAGATGAAGAGCACCAA. The results shown are representative for 3 independent analyses.
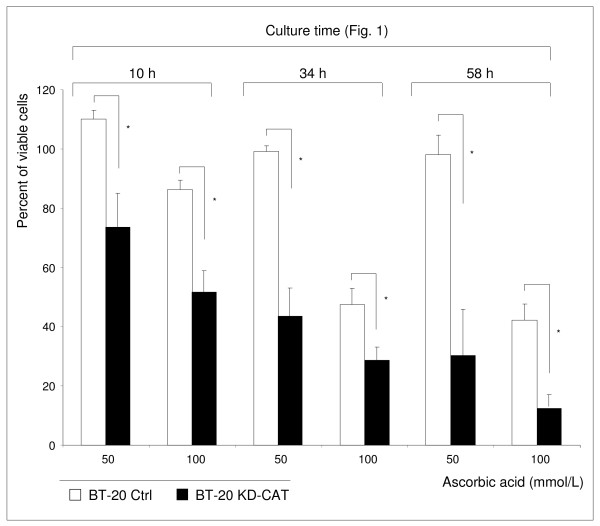
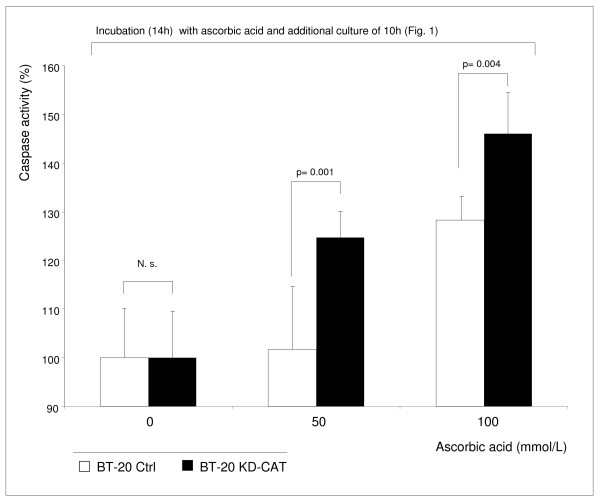
Catalase knock-down in BT-20 cells (BT-20 KD-CAT cells) was associated with increased susceptibility to the ascorbic acid mediated toxic effect (Figure 6). The BT-20 KD-CAT cells can be protected by external catalase against the toxic effect of both ascorbic acid and hydrogen peroxide acid (not shown). An ascorbic acid concentration of 50 mmol/L did not influence BT-20 Ctrl cells (Figure 6) and BT-20 wild type cells (Figure 2) but increased cell death in BT-20 KD-CAT cells (Figure 6). BT-20 cells are strongly resistant to ascorbic acid mediated oxidative stress (EC50: 94.9 mmol/L) and in the presence of 100 mmol/L ascorbic acid the cell viability of BT-20 KD-CAT cells decreased stronger than the viability of BT-20 Ctrl cells (Figure 6) and BT-20 wild type cells. However, a low percentage (< 20%) of BT-20 KD-CAT cells remained viable. We found that the enzyme activity of glutathione peroxidase, the second peroxide-detoxifying enzyme, was not influenced by catalase knock-down (Additional file 1: Figure S1). Therefore, we hypothesize that the remaining viability of BT-20 KD-CAT cells and BT-20 Ctrl cells was caused by the activity of glutathione peroxidase. Nevertheless, the data presented suggest that catalase plays an important role in the resistance to ascorbic acid mediated oxidative stress. In addition, the susceptible BT-20 KD-CAT cells demonstrated significantly higher caspase 3 and 7 activity in the presence of 50 and 100 mmol/L ascorbic acid in comparison to BT-20 Ctrl cells (Figure 7). These findings demonstrate that inhibition of catalase in strongly resistant BT-20 cells (BT-20 KD-CAT cells) sensitizes them to ascorbic acid mediated oxidative stress and increases the rate of apoptosis.
Figure 6.
Catalase-silenced BT-20 KD-CAT cells are sensitized to the toxic effect of ascorbic acid. BT-20 KD-CAT cells were significantly more affected by the exposure to high concentrations of ascorbic acid (50 and 100 mmol/L) than BT-20 Ctrl cells. The results shown are representative for 3 independent analyses. Values are expressed as mean ± standard deviation. *p < 0.01.
Figure 7.
Catalase-silenced BT-20 KD-CAT cells demonstrate increased caspase activity in the presence of ascorbic acid. BT-20 KD-CAT cells and BT-20 Ctrl cells demonstrated significant differences in caspase activity in the presence of 50 mmol/L and 100 mmol/L ascorbic acid. At lower concentration (10 mmol/L), there were no significant differences (data not shown). The results shown are representative for 3 independent analyses. Values are expressed as mean ± standard deviation and significant differences are shown.
Discussion
The key to the anti-tumour effect of ascorbic acid is the production of cytotoxic hydrogen peroxide [10,11]. In this study a panel of 11 human cancer cell lines was tested for their susceptibility to ascorbic acid. Three glioblastoma cell lines and the 3 breast carcinoma cell lines demonstrated EC50 values < 20 mmol/L and were obviously susceptible to ascorbic acid mediated cytoxtoxicity. Five of 11 carcinoma cells lines with EC50 values > 20 mmol/L were only marginally influenced in their viability by elevated ascorbic acid concentrations (Figure 2).
In accordance with previous studies [9]‐[11,13], we found a toxic effect of ascorbic acid based on the local production of hydrogen peroxide. Cell lines, e.g. BT-20, 23132/87, SKOV-3, with a natural resistance to the incubation with ascorbic acid, also demonstrated a natural resistance to toxic effects mediated by hydrogen peroxide (Table 2). In contrast, cell lines, e.g. U-251 and U-87, susceptible to the incubation with ascorbic acid, were also more susceptible to the incubation with hydrogen peroxide. In addition, ascorbic acid resistant cancer cell lines are more able to protect themselves with increased catalase enzymatic activity, in contrast to ascorbic acid susceptible cancer cell lines (Figure 4B). Catalase-silencing sensitizes BT-20 breast carcinoma cells to ascorbic acid mediated cell death. In addition to catalase, enzymes of the peroxidase family, e.g. glutathione peroxidase, are also important for cell protection. In the present study, expression of glutathione peroxidase was also proofed for all tested cancer cell lines, but the level of protein and enzymatic activity did not strongly correlate with the resistance of cancer cell lines to the ascorbic acid-mediated cytotoxic effect (not shown). The catalase knock-down in BT-20-KD-CAT cells did not influence glutathione peroxidase activity (Additional file 1: Figure S1), suggesting that glutathione peroxidase may not play a major role in protecting cancer cells against cytotoxic hydrogen peroxide.
Ascorbic acid is able to act as a strong electron donator by reducing iron ions (Fe3+ to Fe2+). These ions may exist alone or bound on matrix metal proteins [12]. Other metal ions like Cu2+, Ti3+, Cr2+ or Co2+ can also be used as an electron carrier. These ions can be oxidized and donate their electrons on oxygen by generating a superoxide anion (O2-). Superoxide dismutase catalyses the reaction of O2- to hydrogen peroxide that can induce apoptosis in different ways: blocking the activity of a plasma membrane Na+/H+ exchange system leading to reduced cytosolic pH values or attacking DNA, usually by its conversion into DNA-damaging hydroxyl ion (OH·) [17]. In the present study we found that extracellular catalase prevented the cell toxic effect of ascorbic acid and supported cell viability of ascorbic acid susceptible cancer cell lines (Figure 3). Catalase catabolizes hydrogen peroxide to water and oxygen and helps to protect aerobic organisms against excessive hydrogen peroxide production. The cytotoxic effect of extracellular ascorbic acid is finally mediated by the development of extracellular hydrogen peroxide which is membrane permeable [18]. In addition, it is well known that ascorbic acid enters directly into the cell with sodium-dependent vitamin C transporter (SVCT1 and SVCT2) and in its oxidized form dehydro-ascorbic acid can be internalized by hexose transporters GLUT 1, GLUT 3, and GLUT 4 [19]. Both ascorbic acid and its oxidized form are in extra- and intracellular balance, depending on their pH-value. The extracellular amount of ascorbic acid was identified as the more important one, because ascorbic acid has toxic effects on cells even if there is only little expression of those transporters [9,20].
It seems that many cancers demonstrate substantially lower catalase activity than normal tissues, allowing cancers to generate a moderate intracellular level of oxidative stress to aid their proliferation and survival [15,21]. It is known that expression of catalase is regulated at message, protein and activity levels [22]. We could show that the tumour cell lines used in the present study are different in their catalase activity. Szatrowski described that rapidly proliferating cells such as cancer cells generate abnormally high hydrogen peroxide levels. This and other factors increased oxidative stress during neoplastic transformation and may promote the selection of cells with modified (increased or decreased) catalase activity. The modified catalase expression in cancer cells remains puzzling but it seems that prolonged exposure to reactive oxygen species (ROS) downregulates catalase expression via hypermethylation of the catalase promoter and, in addition, transcription factors seem to be involved [23,24]. Catalase is also down-regulated in healthy cells transformed with T-antigen of SV40 or Ras, although the underlying mechanisms of this down-regulation are still unknown [25]. Interestingly, it also has been observed that catalase levels are modified in cancer cell lines resistant to some chemotherapeutic agents or hydrogen peroxide [26,27]. In summary, catalase expression is regulated in a wide array of cellular processes.
The use of ascorbic acid in tumour therapy is a matter of some controversy [28]‐[31]. Nevertheless, ascorbic acid is used in tumour therapy, especially when evidence based medicine or supportive therapy fail [32,33]. Many conventional and novel anti-cancer drugs have been reevaluated for their association with ROS production. For instance, doxorubicin is a redoxcycling anthracycline that generates ROS. Biologics can also induce apoptosis through the generation of ROS. Rituximab, an anti-CD20 monoclonal antibody approved for the treatment of non-Hodgkin’s lymphoma, induces a rapid and intense production of ROS in human lymphoma cells [34]. Another aspect of ROS is that they are able to provoke uncontrolled cell growth by overstimulation of MAP Kinases signal transduction pathways [35]‐[38]. Furthermore, ROS can activate hypoxia induced factor 1 (HIF-1) that stimulates the cells to gain energy from glucose under hypoxic conditions. HIF-1 increases the expression of glycolysis enzymes and additionally stimulates the development of new blood vessels (neovascularisation) by increasing the expression of angiogenic factors (e.g. VEGF) to enhance oxygen supply [39,40]. Increased levels of ROS, however, damage cell structure and function [40].
On the basis of our data, we were able to show a correlation between catalase activity and resistance of cancer cell lines to the ascorbic acid induced cytotoxic effect. Moreover, catalase is significant for cell protection against hydrogen peroxide. The ascorbic acid resistant cell line BT-20 became more susceptible to ascorbic acid after sh-RNA mediated catalase knock-down and the rate of apoptosis increased in these cells.
Conclusions
The present study demonstrates great differences in the ability of cancer cell lines to prevent cell damage induced by increased levels of hydrogen peroxide induced by ascorbic acid. Forty-five percent of the cancer cell lines tested are not affected by ascorbic acid and hydrogen peroxide, respectively. Higher levels of catalase activity are found in cell lines that are more resistant to oxidative stress than in more susceptible cancer cell lines. This observation underlines the heterogeneity of cancer cells concerning their ability to prevent cell death induced by oxidative stress. Therefore, anticancer therapies based on increased generation of ROS are influenced in their efficacy by the antioxidative defence potential of cancer cells. In this context the results of the present study underline the important function of catalase as an antioxidative enzyme.
Competing interests
The authors declare no conflict of interest.
Authors’ contributions
CK and CO drafted the manuscript, designed the study, set up the experiments, participated in data collection, analysed and interpreted the results and provided images and figures. MK, UK, BM, MS, and MiK carried out experiments and participated in data interpretation. UK, ACK and CTG revised the article for intellectual content and participated in editorial support. All authors read and approved the final manuscript.
Pre-publication history
The pre-publication history for this paper can be accessed here:
Supplementary Material
Figure S1. Glutathione peroxidase activity in BT-20 KD-CAT cells, BT-20 control cells and BT-20 wild type cells. The knock-down of catalase does not influence glutathione peroxidase activity, suggesting that glutathione peroxide may not play a major role in resistance to oxidative stress. Glutathione peroxidase was measured with BioVision’s Glutathione Peroxidase Activity Assay (#K762-100) according the manufacture’s instructions (www.biovision.com). For this, one million cells were homogenized in 200 μl cold assay buffer on ice, centrifuged at 10,000 xg for 15 min at 4°C and 50 μl of the supernatant were used for the assay. Glutathione peroxidase reduces hydrogen peroxide while oxidizing reduced glutathione (GSH) to oxidized glutathione (GSSG). The generated GSSG is reduced to GSH with consumption of NADPH by glutathione reductase. The decrease of NADPH, measured at 340 nm, is proportional to glutathione peroxidase activity. Glutathione peroxidase activity was normalized for protein concentration (determined by Bradford Assay) and expressed as mU per 100 μg of protein. The results shown are representative for 3 independent analyses.
Contributor Information
Christoph Klingelhoeffer, Email: Klingelhoe_C@klinik.uni-wuerzburg.de.
Ulrike Kämmerer, Email: u.kaemmerer@mail.uni-wuerzburg.de.
Monika Koospal, Email: Koospal_M@chirurgie.uni-wuerzburg.de.
Bettina Mühling, Email: Muehling_B@chirurgie.uni-wuerzburg.de.
Manuela Schneider, Email: Schneider_m@chirurgie.uni-wuerzburg.de.
Michaela Kapp, Email: Kapp_m@klinik.uni-wuerzburg.de.
Alexander Kübler, Email: MKG@uni-wuerzburg.de.
Christoph-Thomas Germer, Email: Germer_c@chirurgie.uni-wuerzburg.de.
Christoph Otto, Email: Otto_c@chirurgie.uni-wuerzburg.de.
Acknowledgement
The authors would like to thank the Universitätsbund of the University of Würzburg for financial support. This publication was funded by the German Research Foundation (DFG) and the University of Würzburg is in the funding programme Open Access Publishing.
References
- Cerutti PA. Prooxidant states and tumor promotion. Science. 1985;227(4685):375–3781. doi: 10.1126/science.2981433. [DOI] [PubMed] [Google Scholar]
- Zhuang S, Yan Y, Daubert RA, Han J, Schnellmann RG. ERK promotes hydrogen peroxide-induced apoptosis through caspase-3 activation and inhibition of Akt in renal epithelial cells. Am J Physiol Renal Physiol. 2007;292(1):440–447. doi: 10.1152/ajprenal.00170.2006. [DOI] [PubMed] [Google Scholar]
- Valko M, Leibfritz D, Moncol J, Cronin MT, Mazur M, Telser J. Free radicals and antioxidants in normal physiological functions and human disease. Int J Biochem Cell Biol. 2007;39(1):44–84. doi: 10.1016/j.biocel.2006.07.001. [DOI] [PubMed] [Google Scholar]
- Cabreiro F, Picot CR, Perichon M, Castel J, Friguet B, Petropoulos I. Overexpression of mitochondrial methionine sulfoxide reductase B2 protects leukemia cells from oxidative stress-induced cell death and protein damage. J Biol Chem. 2008;283(24):16673–16681. doi: 10.1074/jbc.M708580200. [DOI] [PubMed] [Google Scholar]
- Ho WP, Chan WP, Hsieh MS, Chen RM. Runx2-mediated bcl-2 gene expression contributes to nitric oxide protection against hydrogen peroxide-induced osteoblast apoptosis. J Cell Biochem. 2009;108(5):1084–1093. doi: 10.1002/jcb.22338. [DOI] [PubMed] [Google Scholar]
- Bram S, Froussard P, Guichard M, Jasmin C, Augery Y, Sinoussi-Barre F, Wray W. Vitamin C preferential toxicity for malignant melanoma cells. Nature. 1980;284(5757):629–631. doi: 10.1038/284629a0. [DOI] [PubMed] [Google Scholar]
- Park CH, Amare M, Savin MA, Hoogstraten B. Growth suppression of human leukemic cells in vitro by L-ascorbic acid. Cancer Res. 1980;40(4):1062–1065. [PubMed] [Google Scholar]
- Leung PY, Miyashita K, Young M, Tsao CS. Cytotoxic effect of ascorbate and its derivatives on cultured malignant and nonmalignant cell lines. Anticancer Res. 1993;13(2):475–480. [PubMed] [Google Scholar]
- Chen Q, Espey MG, Krishna MC, Mitchell JB, Corpe CP, Buettner GR, Shacter E, Levine M. Pharmacologic ascorbic acid concentrations selectively kill cancer cells: action as a pro-drug to deliver hydrogen peroxide to tissues. Proc Natl Acad Sci. 2005;102(38):13604–13609. doi: 10.1073/pnas.0506390102. [DOI] [PMC free article] [PubMed] [Google Scholar]
- Peterkofsky B, Prather W. Cytotoxicity of ascorbate and other reducing agents towards cultured fibroblasts as a result of hydrogen peroxide formation. J Cell Physiol. 1977;90(1):61–70. doi: 10.1002/jcp.1040900109. [DOI] [PubMed] [Google Scholar]
- Sestili P, Brandi G, Brambilla L, Cattabeni F, Cantoni O. Hydrogen peroxide mediates the killing of U937 tumor cells elicited by pharmacologically attainable concentrations of ascorbic acid: cell death prevention by extracellular catalase or catalase from cocultured erythrocytes or fibroblasts. J Pharmacol Exp Ther. 1996;277(3):1719–1725. [PubMed] [Google Scholar]
- Fisher AE, Naughton DP. Iron supplements: the quick fix with long-term consequences. Nutr J. 2004;3:2. doi: 10.1186/1475-2891-3-2. [DOI] [PMC free article] [PubMed] [Google Scholar]
- Chen Q, Espey MG, Sun AY, Pooput C, Kirk KL, Krishna MC, Khosh DB, Drisko J, Levine M. Pharmacologic doses of ascorbate act as a prooxidant and decrease growth of aggressive tumor xenografts in mice. Proc Natl Acad Sci. 2008;105(32):11105–11109. doi: 10.1073/pnas.0804226105. [DOI] [PMC free article] [PubMed] [Google Scholar]
- Oberley TD, Oberley LW. Antioxidant enzyme levels in cancer. Histol Histopathol. 1997;12(2):525–535. [PubMed] [Google Scholar]
- McCarty MF, Barroso-Aranda J, Contreras F. Oxidative stress therapy for solid tumors - A proposal. Med Hypotheses. 2010;74(6):1052–1054. doi: 10.1016/j.mehy.2009.12.029. [DOI] [PubMed] [Google Scholar]
- Kueng W, Silber E, Eppenberger U. Quantification of cells cultured on 96-well plates. Anal Biochem. 1989;182(1):16–19. doi: 10.1016/0003-2697(89)90710-0. [DOI] [PubMed] [Google Scholar]
- Halliwell B. Oxidative stress and cancer: have we moved forward? Biochem J. 2007;401:1–11. doi: 10.1042/BJ20061131. [DOI] [PubMed] [Google Scholar]
- Motoyama S, Saito S, Inaba H, Kitamura M, Minamiya Y, Suzuki H, Saito R, Kamata S, Nakae H, Ogawa J. Red blood cells attenuate sinusoidal endothelial cell injury by scavenging xanthine oxidase-dependent hydrogen peroxide in hyperoxic perfused rat liver. Liver. 2000;20(3):200–208. doi: 10.1034/j.1600-0676.2000.020003200.x. [DOI] [PubMed] [Google Scholar]
- Savini I, Rossi A, Pierro C, Avigliano L, Catani MV. SVCT1 and SVCT2: key proteins for vitamin C uptake. Amino Acids. 2008;34:347–355. doi: 10.1007/s00726-007-0555-7. [DOI] [PubMed] [Google Scholar]
- Corpe CP, Lee JH, Kwon O, Eck P, Narayanan J, Kirk KL, Levine M. 6-Bromo-6-deoxy-L-ascorbic acid: an ascorbate analog specific for Na + -dependent vitamin C transporter but not glucose transporter pathways. J Biol Chem. 2005;280(7):5211–5220. doi: 10.1074/jbc.M412925200. [DOI] [PubMed] [Google Scholar]
- Szatrowski TP, Nathan CF. Production of large amounts of hydrogen peroxide by human tumor cells. Cancer Res. 1991;51(3):794–798. [PubMed] [Google Scholar]
- Nishikawa M. Reactive oxygen species in tumor metastasis. Cancer Lett. 2008;266(1):53–59. doi: 10.1016/j.canlet.2008.02.031. [DOI] [PubMed] [Google Scholar]
- Min JY, Lim SO, Jung G. Downregulation of catalase by reactive oxygen species via hypermethylation of CpG island II on the catalase promoter. FEBS Lett. 2010;584(11):2427–2432. doi: 10.1016/j.febslet.2010.04.048. [DOI] [PubMed] [Google Scholar]
- Takeuchi T, Nakamura S, Kayasuga A, Isa S, Sato K. Multiple elements for negative regulation of the rat catalase gene expression in dedifferentiated hepatoma cells. J Biochem. 2000;128(6):1025–1031. doi: 10.1093/oxfordjournals.jbchem.a022830. [DOI] [PubMed] [Google Scholar]
- Hoffschir F, Vuillaume M, Sabatier L, Ricoul M, Daya-Grosjean L, Estrade S, Cassingena R, Calvayrac R, Sarasin A, Dutrillaux B. Decrease in catalase activity and loss of the 11p chromosome arm in the course of SV40 transformation of human fibroblasts. Carcinogenesis. 1993;14(8):1569–1572. doi: 10.1093/carcin/14.8.1569. [DOI] [PubMed] [Google Scholar]
- Xu H, Choi SM, An CS, Min YD, Kim KC, Kim KJ, Choi CH. Concentration-dependent collateral sensitivity of cisplatin-resistant gastric cancer cell sublines. Biochem Biophys Res Commun. 2005;328(2):618–622. doi: 10.1016/j.bbrc.2005.01.015. [DOI] [PubMed] [Google Scholar]
- Akman SA, Forrest G, Chu FF, Esworthy RS, Doroshow JH. Antioxidant and xenobiotic-metabolizing enzyme gene expression in doxorubicin-resistant MCF-7 breast cancer cells. Cancer Res. 1990;50(5):1397–1402. [PubMed] [Google Scholar]
- Cameron E, Pauling L. Supplemental ascorbate in the supportive treatment of cancer: Prolongation of survival times in terminal human cancer. Proc Natl Acad Sci. 1976;73:3685–3689. doi: 10.1073/pnas.73.10.3685. [DOI] [PMC free article] [PubMed] [Google Scholar]
- Cameron E, Pauling L. Supplemental ascorbate in the supportive treatment of cancer: reevaluation of prolongation of survival times in terminal human cancer. Proc Natl Acad Sci. 1978;75:4538–4542. doi: 10.1073/pnas.75.9.4538. [DOI] [PMC free article] [PubMed] [Google Scholar]
- Creagan ET, Moertel CG, O’Fallon JR, Schutt AJ, O’Connell MJ, Rubin J, Frytak S. Failure of high-dose vitamin C (ascorbic acid) therapy to benefit patients with advanced cancer.A controlled trial. N Engl J Med. 1979;301(13):687–690. doi: 10.1056/NEJM197909273011303. [DOI] [PubMed] [Google Scholar]
- Moertel CG, Fleming TR, Creagan ET, Rubin J, O’Connell MJ, Ames MM. High-dose vitamin C versus placebo in the treatment of patients with advanced cancer who have had no prior chemotherapy. A randomized double-blind comparison. N Engl J Med. 1985;312(3):137–141. doi: 10.1056/NEJM198501173120301. [DOI] [PubMed] [Google Scholar]
- Riordan HD, Hunninghake RB, Riordan NH, Jackson JJ, Meng X, Taylor P, Casciari JJ, González MJ, Miranda-Massari JR, Mora EM, Rosario N, Rivera A. Intravenous ascorbic acid: protocol for its application and use. P R Health Sci J. 2003;22(3):287–290. [PubMed] [Google Scholar]
- Riordan HD, Casciari JJ, González MJ, Riordan NH, Miranda-Massari JR, Taylor P, Jackson JA. A pilot clinical study of continuous intravenous ascorbate in terminal cancer patients. P R Health Sci J. 2005;24(4):269–276. [PubMed] [Google Scholar]
- Renschler MF. The emerging role of reactive oxygen species in cancer therapy. Eur J Cancer. 2004;40(13):1934–1940. doi: 10.1016/j.ejca.2004.02.031. [DOI] [PubMed] [Google Scholar]
- Li C, Jackson RM. Reactive species mechanisms of cellular hypoxia-reoxygenation injury. Am J Physiol Cell Physiol. 2002;282(2):227–241. doi: 10.1152/ajpcell.00112.2001. [DOI] [PubMed] [Google Scholar]
- Kulisz A, Chen N, Chandel NS, Shao Z, Schumacker PT. Mitochondrial ROS initiate phosphorylation of p38 MAP kinase during hypoxia in cardiomyocytes. Am J Physiol Lung Cell Mol Physiol. 2002;282(6):1324–1329. doi: 10.1152/ajplung.00326.2001. [DOI] [PubMed] [Google Scholar]
- Millar TM, Phan V, Tibbles LA. ROS generation in endothelial hypoxia and reoxygenation stimulates MAP kinase signaling and kinase-dependent neutrophil recruitment. Free Radic Biol Med. 2007;42(8):1165–1177. doi: 10.1016/j.freeradbiomed.2007.01.015. [DOI] [PubMed] [Google Scholar]
- Kroemer G, Pouyssegur J. Tumor cell metabolism: cancer’s Achilles’ heel. Cancer Cell. 2008;13(6):472–482. doi: 10.1016/j.ccr.2008.05.005. [DOI] [PubMed] [Google Scholar]
- Gao P, Zhang H, Dinavahi R, Li F, Xiang Y, Raman V, Bhujwalla ZM, Felsher DW, Cheng L, Pevsner J, Lee LA, Semenza GL, Dang CV. HIF-dependent antitumorigenic effect of antioxidants in vivo. Cancer Cell. 2007;12(3):230–238. doi: 10.1016/j.ccr.2007.08.004. [DOI] [PMC free article] [PubMed] [Google Scholar]
- Fang J, Seki T, Maeda H. Therapeutic strategies by modulating oxygen stress in cancer and inflammation. Adv Drug Deliv Rev. 2009;61:290–302. doi: 10.1016/j.addr.2009.02.005. [DOI] [PubMed] [Google Scholar]
Associated Data
This section collects any data citations, data availability statements, or supplementary materials included in this article.
Supplementary Materials
Figure S1. Glutathione peroxidase activity in BT-20 KD-CAT cells, BT-20 control cells and BT-20 wild type cells. The knock-down of catalase does not influence glutathione peroxidase activity, suggesting that glutathione peroxide may not play a major role in resistance to oxidative stress. Glutathione peroxidase was measured with BioVision’s Glutathione Peroxidase Activity Assay (#K762-100) according the manufacture’s instructions (www.biovision.com). For this, one million cells were homogenized in 200 μl cold assay buffer on ice, centrifuged at 10,000 xg for 15 min at 4°C and 50 μl of the supernatant were used for the assay. Glutathione peroxidase reduces hydrogen peroxide while oxidizing reduced glutathione (GSH) to oxidized glutathione (GSSG). The generated GSSG is reduced to GSH with consumption of NADPH by glutathione reductase. The decrease of NADPH, measured at 340 nm, is proportional to glutathione peroxidase activity. Glutathione peroxidase activity was normalized for protein concentration (determined by Bradford Assay) and expressed as mU per 100 μg of protein. The results shown are representative for 3 independent analyses.


