

Abstract
Background:
Previously we demonstrated that an mRNA signature reflecting cellular proliferation had strong prognostic value. As clinical applicability of signatures can be controversial, we sought to improve our marker’s clinical utility by validating its biological relevance, reproducibility in independent data sets and applicability using an independent technique.
Methods:
To facilitate signature evaluation with quantitative PCR (qPCR) a novel computational procedure was used to reduce the number of signature genes without significant information loss. These genes were validated in different human cancer cell lines upon serum starvation and in a 168 xenografts panel. Analyses were then extended to breast cancer and non-small-cell lung cancer (NSCLC) patient cohorts.
Results:
Expression of the qPCR-based signature was dramatically decreased under starvation conditions and inversely correlated with tumour volume doubling time in xenografts. The signature validated in breast cancer (hazard ratio (HR)=1.63, P<0.001, n=1820) and NSCLC adenocarcinoma (HR=1.64, P<0.001, n=639) microarray data sets. Lastly, qPCR in a node-negative, non-adjuvantly treated breast cancer cohort (n=129) showed that patients assigned to the high-proliferation group had worse disease-free survival (HR=2.25, P<0.05).
Conclusion:
We have developed and validated a qPCR-based proliferation signature. This test might be used in the clinic to select (early-stage) patients for specific treatments that target proliferation.
Keywords: biomarkers, gene expression microarray, statistical analysis, prognosis, proliferation
Over the last decade, gene expression microarray technology has had a profound impact on cancer research. The ability to analyse the expression of thousands of genes in a single experiment has been systematically used to derive prognostic and predictive markers for many cancer types (Shedden et al, 2008; Sotiriou and Pusztai, 2009; Gomez-Raposo et al, 2010; Oberthuer et al, 2010). Numerous of these ‘signatures’ show good prognostic power, but surprisingly gene-wise overlap between them has been minimal (Ein-Dor et al, 2006; Fan et al, 2006; Chen et al, 2007; Lau et al, 2007), which increases the difficulty of introducing microarrays in clinical practice. Moreover, studies comparing data originating from different microarray platforms have reported poor inter-platform correlations (Kuo et al, 2002; Tan et al, 2003). Nevertheless, multiple studies in breast and non-small-cell lung cancer (NSCLC) have shown that most of these signatures exhibit similar prognostic performance and identify identical patients (Fan et al, 2006; Haibe-Kains et al, 2008). These data suggest that, although gene-wise overlap is small, the signatures track common underlying biology that determine patient outcome. Among others, Weigelt et al (2010) have suggested that proliferation genes drive the prognostic power of these signatures (Whitfield et al, 2006; Desmedt et al, 2008; Haibe-Kains et al, 2008). A large meta-analysis by Wirapati et al (2008) supports this concept.
To determine if this result could be clinically useful, we previously developed a signature based on 104 proliferation genes (Starmans et al, 2008). This signature was derived from two in vitro gene expression data sets. Genes were selected that showed a cycling pattern after synchronisation in one data set and responded to serum stimulation in the other. Our proliferation signature exhibited strong prognostic power in several large transcriptome data sets representing different cancer types (Starmans et al, 2008). Further, the proliferation signature and multiple other signatures identified similar patients as having good or poor prognosis (Starmans et al, 2008). These results substantiate the hypothesis that many published signatures act as surrogates of proliferation.
The clinical applicability of gene expression signatures remains controversial; studies seem to lack consistency and external validation is not straightforward (Michiels et al, 2005; Ein-Dor et al, 2006; Dupuy and Simon, 2007; Boulesteix and Slawski, 2009; Boutros et al, 2010; Subramanian and Simon, 2010). Many gene expression signatures were developed since the introduction of gene expression microarray technology, however, so far only in breast cancer two prognostic gene profiles are tested in large prospective trials (Bogaerts et al, 2006; Sparano, 2006; Wirapati et al, 2008; Weigelt et al, 2010). The dimensionality of gene expression microarrays makes statistical analysis complex, and large numbers of samples are required for reproducible results (Zien et al, 2003; Ein-Dor et al, 2006). An approach to only evaluate a select number of transcripts may therefore provide an efficient alternative to high-throughput expression profiling. The use of a PCR-based test to evaluate the proliferation signature would assist in the application to a clinical setting (Zhou et al, 2010). Furthermore, a PCR-based technique does not necessitate the availability of fresh-frozen tissue, whereas this is recommended for gene expression microarrays (Tumour Analysis Best Practices Working Group, 2004). Many more samples might thus be available to validate classifiers with a PCR-based technique.
Initially, we examined whether it was possible to reduce the number of genes in the proliferation signature, without deteriorating its prognostic value. The original signature consisted of 104 genes, and so reducing this number would make data collection, analysis and transfer to a PCR-based approach simpler and more transparent. To further facilitate translation of this reduced proliferation signature to a PCR-platform a series of in vitro and ex vivo validation experiments were performed. We reduced the proliferation signature to 10 genes and validated it in 1820 breast cancer and 862 NSCLC patients. Lastly, the reduced proliferation signature was applied to another independent, 129-patient breast cancer cohort with qPCR to demonstrate clinical utility.
Materials and methods
Gene size reduction
In our original study (Starmans et al, 2008) we developed a 104-gene proliferation signature and evaluated it in five different microarray data sets representing breast, lung and renal cancers (Beer et al, 2002; van de Vijver et al, 2002; Miller et al, 2005; Wang et al, 2005; Zhao et al, 2006). To reduce the size of the signature, each gene was tested for its univariate prognostic value in each data set. This was for disease-specific (Miller et al, 2005; Zhao et al, 2006), metastasis-free (Wang et al, 2005) or overall (Beer et al, 2002; van de Vijver et al, 2002) survival, depending on what was reported for the data set. Only genes that had fewer than 25% missing values were included. Expression of each gene was used as a continuous variable as input for receiver operator curve (ROC) analysis. Genes were ranked within each data set by the area under the ROC (Supplementary Data File S1), and then subjected to a rank-based filtering. The filtering criteria were dependent on the number of data sets that included a certain gene, and were:
Present in 1/5 data sets: discard the gene
Present in 2/5 data sets: select when ranked in top 20 for both data sets
Present in 3/5 data sets: select when ranked in top 20 in all three data sets
Present in 4/5 data sets: select when ranked in top 20 in 3 out of 4 data sets
Present in 5/5 data sets: select when ranked in the top 20 in 4 out of 5 data sets
Quantitative PCR
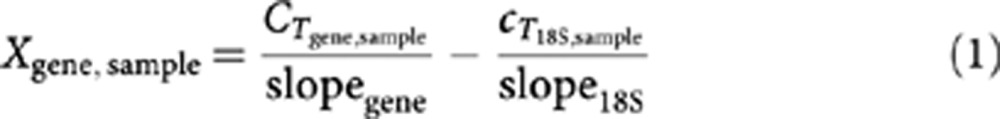
RNA was reverse-transcribed using I-script (Bio-Rad, Veenendaal, The Netherlands) and quantitative PCR was performed in ABI 7500 (Applied Biosystems, Bleiswijk, The Netherlands). Gene abundance was detected using power SYBR Green I (Applied Biosystems). Primer sequences are provided in Supplementary Data File S2. Relative abundance of every gene per sample (Xgene, sample) was calculated using standard curves and normalisation to 18S rRNA signal (Equation 1). This was followed by median scaling per gene for each data set (Barsyte-Lovejoy et al, 2006).
 |
A multi-gene signature score was subsequently calculated for the reduced proliferation signature as follows:
 |
In which N is the number of genes in the multi-gene marker. The parameter geneexpr,n for a sample equals the value 1 if the sample has a level of gene n above the median for all samples in the data set and −1 otherwise. All data analyses were performed in R (v2.12.1).
In vitro validation
To validate the involvement in proliferation of the genes in the reduced signature, serum starvation experiments were performed in five cancer cell lines (MCF7, HeLa, HT-29, U-2 OS and DU145). Cells were grown either in normal serum containing medium (10% foetal bovine serum, FBS), the control situation, or in low serum containing medium (0.1% FBS, starvation condition) for 48 h. RNA was isolated for both conditions for three biological replicates. The multi-gene signature score (Equation 2) was calculated for each sample. Scores were then compared between normal and serum starvation conditions with a two sample two-tailed unpaired Student’s t-test (R v2.12.1).
Ex vivo validation with qPCR
A large set of xenografts (n=168) was used to assess whether it is feasible to evaluate the reduced proliferation signature in tumour material. Material was isolated from xenografts grown from different cancer cell lines (HeLa, HT-29, U-87, LS 174T, HCT 116 and Hep G2) obtained from previous studies in which tumour volume doubling times (VDTs) were calculated (Oostendorp et al, 2008; Dubois et al, 2009a, 2009b; Rouschop et al, 2010). The multi-gene signature score (equation 2) was calculated and used to median dichotomise the xenograft samples. Differences in tumour VDTs were then assessed between the two groups with a two sample two-tailed unpaired Student’s t-test (R v2.12.1).
Validation in independent microarray data sets
The reduced proliferation signature was further validated in independent public mRNA abundance data sets. Several breast cancer (Pawitan et al, 2005; Bild et al, 2006; Chin et al, 2006; Sotiriou et al, 2006; Desmedt et al, 2007; Loi et al, 2008; Bos et al, 2009; Zhang et al, 2009; Li et al, 2010; Sabatier et al, 2010; Symmans et al, 2010) and NSCLC (Bhattacharjee et al, 2001; Bild et al, 2006; Raponi et al, 2006; Shedden et al, 2008; Lu et al, 2010) data sets were used to assess the prognostic power of the reduced proliferation signature. For NSCLC the data sets reported on adenocarcinoma and/or squamous cell carcinoma. Considering these are completely different disease types, separate analyses were performed per subgroup. When overall survival was provided this was used as end point, otherwise disease-specific survival (or the closest variant available) was used. All data sets used Affymetrix microarrays, which were normalised using the RMA algorithm (Irizarry et al, 2003) (R packages: affy v1.26.1) combined with updated ProbeSet annotations (Dai et al, 2005b) (R packages v12.1.0: hgu95av2hsentrezgcdf, hgu133ahsentrezgcdf, hgu133bhsentrezgcdf and hgu133plus2hsentrezgcdf). Genes were matched across data sets based on Entrez Gene IDs. Median scaling and housekeeping gene normalisation (to the geometric mean of ACTB, BAT1, B2M and TBP levels) was performed (Barsyte-Lovejoy et al, 2006). The multi-gene signature score (Equation 2) was used to median dichotomise the patients in a data set. Patients predicted as having good or poor prognosis in any of the data sets were pooled into different groups. This was done for the breast cancer and lung cancer data sets separately. Prognostic performance of the reduced proliferation signature was evaluated by Cox proportional hazard ratio (HR) modelling followed by the Wald test (R survival package v2.36-2). For breast cancer 15-year survival was used as end point and 5-year survival for NSCLC.
Validation in independent patient cohort
The reduced proliferation signature was evaluated using qPCR in a breast cancer patient cohort of the breast tumour bank of the Radboud University Nijmegen Medical Centre (Nijmegen, The Netherlands) as described previously (Span et al, 2004). Patients underwent modified radical mastectomy or a breast-conserving lumpectomy between November 1987 and December 1997. Postoperative radiotherapy was administered, to the breast after an incomplete resection or after breast-conserving treatment, or to the parasternal lymph nodes when the tumour was medially localised. Patients did not receive (neo-) adjuvant systemic therapy according to the standard treatment protocol at the time. RNA was available from 129 lymph node-negative breast cancer patients.
Quantitative PCR was carried out to evaluate the reduced proliferation signature in this patient cohort. Subsequently the multi-gene signature score (Equation 2) was calculated and patients were either assigned to the low- or high-expression group. Patients in the low expression group are predicted to have good prognosis, whereas patients in the high-expression group are predicted to have poor prognosis. Disease-free survival was used as follow-up end point. Univariate and multi-variate Cox proportional HR modelling followed by the Wald test was used to evaluate the reduced proliferation signature (R survival package version 2.36-2). For a subgroup of the cohort histological grade was unknown, median imputation was applied for those patients (R e1071 package v1.5-24). Moreover, multi-variate models with and without the signature were evaluated with the C-index (R survival package v2.36-2).
Results
To reduce the number of genes in the proliferation signature, genes were ranked according to their individual prognostic power in each of the five data sets used in the original study (Supplementary Data File S1) (Starmans et al, 2008). After filtering and gene ranking, the final reduced proliferation signature consisted of 10 genes, which is a reduction of 90% (Table 1).
Table 1. The reduced proliferation signature genes.
| Gene symbol | Entrez gene ID | Name |
|---|---|---|
| BUB1B | 701 | Budding uninhibited by benzimidazoles 1 homologue beta (yeast) |
| CCNA2 | 890 | Cyclin A2 |
| CCNB2 | 9133 | Cyclin B2 |
| FANCI | 55215 | Fanconi anaemia, complementation group I |
| MELK | 9833 | Maternal embryonic leucine zipper kinase |
| NCAPH | 23397 | Non-SMC condensing I complex, subunit H |
| RRM2 | 6241 | Ribonucleotide reductase M2 |
| SKA3 | 221150 | Spindle and kinetochore-associated complex 3 |
| UBE2C | 11065 | Ubiquitin-conjugating enzyme E2C |
| UBE2T | 29089 | Ubiquitin-conjugating enzyme E2T (putative) |
The original basis of the proliferation signature was in gene expression studies carried out in vitro. To ensure that the remaining genes accurately reflect proliferation status per se, especially when assessed by qPCR, we evaluated the reduced signature both in vitro and ex vivo. First, five different cancer cell lines (MCF7, HeLa, HT-29, U-2 OS and DU145) were cultured in either normal or serum-starved conditions. Figure 1A shows that expression of the reduced proliferation signature was significantly lower upon serum starvation compared with control growing conditions (P=1.52 × 10⁻¹¹, t-test). Individual genes showed a similar pattern (Supplementary Figure S1).
Figure 1.

In vitro validation: difference in reduced proliferation score in normal vs starvation conditions (A). Ex vivo validation: Corresponding volume doubling times (VDTs) for a xenograft data set (n=168) dichotomized with the reduced proliferation signature in a low and high-proliferation group (B).
We then assessed expression of the 10 genes in a panel of tumour xenografts with known VDTs (Oostendorp et al, 2008; Dubois et al, 2009a, 2009b; Rouschop et al, 2010) originating from different cancer cell lines. Xenografts were assigned to either the low- or high-proliferation group based on expression of the reduced proliferation signature. Although proliferation rate is not expected to be the only parameter, which influences gross tumour growth (e.g., rates of cell turnover are also important), we hypothesised that VDTs in the group with high proliferation should be reduced compared with xenografts with low proliferation. Figure 1B confirms this hypothesis: a significant difference in VDTs between high- and low-proliferation signature xenografts was observed (P=5.32 × 10⁻⁶, fold-change  =1.60; t-test).
To demonstrate its prognostic power, the reduced signature was evaluated in two large gene expression-based meta-data sets of 1820 breast and 862 NSCLC patients. None of these data sets were included in the original study; all were fully independent. Patients were stratified based on the reduced proliferation signature and Cox proportional hazards modelling was used to assess performance. Patient classification with the reduced proliferation signature could stratify breast (Figure 2A: HR=1.63; 95% CI: 1.39–1.92; P=1.42 × 10⁻⁹ Wald test) and NSCLC patients (Figure 2B: HR=1.35; 95% CI: 1.10–1.66; P=34.47 × 10⁻³ Wald test) into groups with distinct prognostic profiles. High expression of the reduced proliferation signature correlated with poor survival in all patient groups. For NSCLC subgroup analyses were performed for the adenocarcinoma and squamous cell carcinoma patient groups, for these are significantly distinct disease states. Non-small-cell lung cancer adenocarcinoma patients could be grouped into cohorts with significantly different survival properties (Figure 2C: HR=1.64; 95% CI: 1.30–2.06; P=3.01 × 10⁻⁵ Wald test). However, in the squamous cell carcinoma cohort the reduced proliferation signature had no prognostic power (Figure 2D: HR=0.66; 95% CI: 0.41–1.04; P=7.14 × 10⁻² Wald test). In Supplementary Figures S2 and S3 Kaplan–Meier survival curves for the individual data sets are provided. These data indicate that reduction of the proliferation signature was successful; the reduced signature could stratify patients into groups with significant differences in survival.
Figure 2.

Validation of the reduced proliferation signature in a breast cancer (A) and non-small-cell lung cancer (B) meta-data set, for NSCLC a subgroup analysis was performed for adenocarcinoma (C) and squamous cell carcinoma (D): patients with high proliferation have significant worse survival than patients in the low proliferation group. Abbreviations: HR=hazard ratio; P=P-value Wald test.
To confirm the prognostic performance of the reduced proliferation signature when evaluated by qPCR, we tested its performance in a further independent cohort of 129 lymph node-negative breast cancer patients. This patient group is distinct from those used for model development and from those in the meta-data set analysis. Table 2 displays patient and treatment characteristics. The reduced proliferation signature stratified the cohort into groups predicted to have either good (low proliferation) or poor prognosis (high proliferation). Figure 3A shows that the patient group predicted to have poor prognosis had significantly worse disease-specific survival than the good prognosis group (HR=2.25; 95% CI: 1.01–4.99; P=4.60 × 10⁻² Wald test). The majority of this cohort were stage I patients, therefore a subgroup analysis was performed. The reduced proliferation signature could stratify stage I patients in two groups with highly significant differences in prognosis (Figure 3B: HR=5.92; 95% CI: 1.62–21.59; P=7.03 × 10⁻³ Wald test). To investigate whether the signature’s prognostic power was independent of other clinical factors multi-variate Cox proportional HR modelling was used. In the whole-patient cohort the reduced signature performed comparable to stage (Supplementary Table S1), however, it did, like the other factors included, not reach statistical significance (HR=1.73; 95% CI: 0.73–4.12; P=0.215 Wald test). In stage I patients the reduced proliferation signature was the top prognostic factor (Table 3, HR=7.23; 95% CI: 1.65–31.95; P=8.57 × 10⁻³ Wald test). C-indexes for multi-variate Cox proportional HR models of clinical parameters with and without the reduced proliferation signature were calculated. Both in the whole cohort and stage I patient group adding the signature increased prognostic power, in the stage I patient group the signature alone outperformed the model comprising clinical parameters (Supplementary Table S2).
Table 2. Baseline demographics of breast cancer patient cohort in low and high-risk group assessed with the reduced proliferation signature (full characteristics were represented previously (Span et al, 2004)).
| Factor | All patients ( N =129) | Low risk ( N =61) | High risk ( N =68) | P a |
|---|---|---|---|---|
| Surgery | 0.371 | |||
| Mastectomy | 55 | 23 | 32 | |
| Lumpectomy | 74 | 38 | 36 | |
| Radiotherapy | 0.935 | |||
| Yes | 84 | 39 | 45 | |
| No | 45 | 22 | 23 | |
| Stage of disease | 0.004 | |||
| I | 78 | 46 | 32 | |
| II | 48 | 14 | 34 | |
| III | 3 | 1 | 2 | |
| Grade b | 0.142c | |||
| G1 | 9 | 5 | 4 | |
| G2 | 48 | 25 | 23 | |
| G3 | 40 | 13 | 27 | |
| Not recorded | 32 | 18 | 14 | |
| Histological type | 0.017 | |||
| Ductal | 90 | 45 | 45 | |
| Lobular | 19 | 12 | 7 | |
| Other | 20 | 4 | 16 | |
| Menopausal | 0.928 | |||
| Pre | 26 | 13 | 13 | |
| Post | 103 | 48 | 55 | |
| Treatment | 0.121 | |||
| Lumpectomy+radiotherapy | 74 | 38 | 36 | |
| Mastectomy | 44 | 21 | 23 | |
| Mastectomy+radiotherapy | 11 | 2 | 9 | |
P-value χ2-test.
Grading was performed according to Bloom and Richardson, by the method modified by Elston and Ellis (1991).
Without including those with missing or unknown values.
Figure 3.

Validation of the reduced proliferation signature with qPCR in a breast cancer patient cohort; high-prognostic power is achieved (A), which is most pronounced in the stage I patient group (B). Abbreviations: HR=hazard ratio; P=P-value Wald test.
Table 3. Results multi-variate Cox regression model in stage I patient group (78 patients).
| Factor | HR | 95% CI | P * |
|---|---|---|---|
| Reduced proliferation signature | 7.23 | 1.65–31.59 | 0.009 |
| Grade (vs grade 1) | |||
| Grade 2 | 0.79 | 0.14–4.36 | 0.783 |
| Grade 3 | 0.17 | 0.021–1.36 | 0.095 |
| Histological type (vs ductal) | |||
| Histological type lobular | 0 | 0.00–inf | 0.998 |
| Histological type other | 2.02 | 0.54–7.64 | 0.298 |
| Age | 0.99 | 0.90–1.11 | 0.992 |
| Menopausal (pre vs post) | 0.95 | 0.061–14.71 | 0.970 |
| Treatment (vs lumpectomy+radiotherapy) | |||
| Mastectomy | 2.99 | 0.79–11.26 | 0.106 |
Abbreviations: CI=confidence interval; HR=hazard ratio.
*P-value Wald test.
Discussion
We previously reported a microarray-based proliferation signature with high-prognostic power in several large microarray data sets encompassing different cancer types. Here, we successfully reduced the number of genes in the proliferation signature to a more appropriate scale for low-throughput technologies. This could greatly facilitate the translation into a clinically applicable test (Zhou et al, 2010). In two large independent gene expression meta-data sets for breast and NSCLC the reduced signature separated the patients into groups with significant distinct survival properties.
A subgroup analysis for the NSCLC cohort showed high-prognostic power in adenocarcinoma patients, whereas in squamous cell carcinoma patients no prognostic power was observed. Earlier studies have shown similar data for other measures of proliferation; high proliferation was significantly associated with incidence of metastasis and worse survival in adenocarcinomas, but not in squamous cell carcinomas (Komaki et al, 1996; Hommura et al, 2000). Recapitulating decreasing the number of signature genes resulted in a new marker with high performance across different cancer types.
Several genes in the signature have previously been implicated in cancer outcome (Glinsky, 2006; Whitfield et al, 2006; Ryu et al, 2007; Hao et al, 2008; Marie et al, 2008). UBE2C (ubiquitin-conjugating enzyme E2C) expression was correlated with malignant progression in thyroid carcinomas and demonstrated prognostic power in ovarian cancer (Pallante et al, 2005; Berlingieri et al, 2007; van Ree et al, 2010), in which high expression was associated with worse survival. Overexpression of RRM2 (ribonucleotide reductase M2) showed association with chemotherapy resistance (Boukovinas et al, 2008). Furthermore, a large fraction of the published gene expression signatures include clusters of proliferation-associated genes and several of the reduced proliferation genes are represented in these clusters (Whitfield et al, 2002; Dai et al, 2005a; Shedden et al, 2008; Weigelt et al, 2010).
As a last step the reduced proliferation signature was evaluated with qPCR in an independent breast cancer patient cohort. This patient group consisted entirely of patients without axillary lymph node metastases, and who did not receive systemic adjuvant therapy, making it possible to distinguish a pure prognostic value of the proliferation signature. The reduced proliferation signature stratified patients into groups with different survival properties and showed high-prognostic power especially in stage I patients. A high disease-specific survival was observed in the stage I patients identified as having low risk. This suggests the reduced proliferation signature might be useful in identifying high-risk stage I breast cancer patients that could benefit from additional therapy like chemo-radiation or accelerated radiotherapy, whereas the low risk group would not.
Currently two large prospective trials have been started to address the predictive performance of two gene expression signatures in early breast cancer (Bogaerts et al, 2006; Sparano, 2006). Both these signatures include a subset of proliferation genes and several meta-analyses show evidence that the prognostic value of these signatures is mostly attributed to this process (Wirapati et al, 2008; Weigelt et al, 2010). Therefore, a signature reflecting merely proliferation could make its interpretation easier. Furthermore the prognostic power of the reduced proliferation signature was not limited to breast cancer; it also had a high performance in a NSCLC adenocarcinoma meta-data set.
Thus, we here show that the array-based proliferation signature could be reduced to 10 genes. This reduced proliferation signature can be applied in small-tissue samples, including possibly FFPE material, adding to its clinical applicability. The pure prognostic power of the signature was validated in an independent breast cancer patient cohort, where it was shown to be particularly useful to select patients that would benefit from more aggressive therapy. To fully grasp the potential prognostic or predictive role of the signature it further should be tested in prospective trials and translated from a relative to an absolute measure.
Acknowledgments
This work was supported by the Centre for Translational Molecular Medicine (www.ctmm.nl) (AIRFORCE Project Ref. 030-103) and the Ontario Institute for Cancer Research through funding provided by the Government of Ontario to PCB.
Footnotes
Supplementary Information accompanies the paper on British Journal of Cancer website (http://www.nature.com/bjc)
This work is published under the standard license to publish agreement. After 12 months the work will become freely available and the license terms will switch to a Creative Commons Attribution-NonCommercial-Share Alike 3.0 Unported License.
Supplementary Material
References
- Barsyte-Lovejoy D, Lau SK, Boutros PC, Khosravi F, Jurisica I, Andrulis IL, Tsao MS, Penn LZ (2006) The c-Myc oncogene directly induces the H19 noncoding RNA by allele-specific binding to potentiate tumorigenesis. Cancer Res 66: 5330–5337 [DOI] [PubMed] [Google Scholar]
- Beer DG, Kardia SL, Huang CC, Giordano TJ, Levin AM, Misek DE, Lin L, Chen G, Gharib TG, Thomas DG, Lizyness ML, Kuick R, Hayasaka S, Taylor JM, Iannettoni MD, Orringer MB, Hanash S (2002) Gene-expression profiles predict survival of patients with lung adenocarcinoma. Nat Med 8: 816–824 [DOI] [PubMed] [Google Scholar]
- Berlingieri MT, Pallante P, Guida M, Nappi C, Masciullo V, Scambia G, Ferraro A, Leone V, Sboner A, Barbareschi M, Ferro A, Troncone G, Fusco A (2007) UbcH10 expression may be a useful tool in the prognosis of ovarian carcinomas. Oncogene 26: 2136–2140 [DOI] [PubMed] [Google Scholar]
- Bhattacharjee A, Richards WG, Staunton J, Li C, Monti S, Vasa P, Ladd C, Beheshti J, Bueno R, Gillette M, Loda M, Weber G, Mark EJ, Lander ES, Wong W, Johnson BE, Golub TR, Sugarbaker DJ, Meyerson M (2001) Classification of human lung carcinomas by mRNA expression profiling reveals distinct adenocarcinoma subclasses. Proc Natl Acad Sci USA 98: 13790–13795 [DOI] [PMC free article] [PubMed] [Google Scholar]
- Bild AH, Yao G, Chang JT, Wang Q, Potti A, Chasse D, Joshi MB, Harpole D, Lancaster JM, Berchuck A, Olson JA, Marks JR, Dressman HK, West M, Nevins JR (2006) Oncogenic pathway signatures in human cancers as a guide to targeted therapies. Nature 439: 353–357 [DOI] [PubMed] [Google Scholar]
- Bogaerts J, Cardoso F, Buyse M, Braga S, Loi S, Harrison JA, Bines J, Mook S, Decker N, Ravdin P, Therasse P, Rutgers E, van 't Veer LJ, Piccart M (2006) Gene signature evaluation as a prognostic tool: challenges in the design of the MINDACT trial. Nat Clin Pract Oncol 3: 540–551 [DOI] [PubMed] [Google Scholar]
- Bos PD, Zhang XH, Nadal C, Shu W, Gomis RR, Nguyen DX, Minn AJ, van de Vijver MJ, Gerald WL, Foekens JA, Massague J (2009) Genes that mediate breast cancer metastasis to the brain. Nature 459: 1005–1009 [DOI] [PMC free article] [PubMed] [Google Scholar]
- Boukovinas I, Papadaki C, Mendez P, Taron M, Mavroudis D, Koutsopoulos A, Sanchez-Ronco M, Sanchez JJ, Trypaki M, Staphopoulos E, Georgoulias V, Rosell R, Souglakos J (2008) Tumor BRCA1, RRM1 and RRM2 mRNA expression levels and clinical response to first-line gemcitabine plus docetaxel in non-small-cell lung cancer patients. PLoS One 3: e3695. [DOI] [PMC free article] [PubMed] [Google Scholar]
- Boulesteix AL, Slawski M (2009) Stability and aggregation of ranked gene lists. Brief Bioinform 10: 556–568 [DOI] [PubMed] [Google Scholar]
- Boutros PC, Pintilie M, John T, Starmans MH, Der SD, Shepherd FA, Tsao MS, Jurisica I (2010) Re: Gene Expression-Based Prognostic Signatures in Lung Cancer: Ready for Clinical Use? J Natl Cancer Inst 102(21): 1677–1678 [DOI] [PubMed] [Google Scholar]
- Chen HY, Yu SL, Chen CH, Chang GC, Chen CY, Yuan A, Cheng CL, Wang CH, Terng HJ, Kao SF, Chan WK, Li HN, Liu CC, Singh S, Chen WJ, Chen JJ, Yang PC (2007) A five-gene signature and clinical outcome in non-small-cell lung cancer. N Engl J Med 356: 11–20 [DOI] [PubMed] [Google Scholar]
- Chin K, DeVries S, Fridlyand J, Spellman PT, Roydasgupta R, Kuo WL, Lapuk A, Neve RM, Qian Z, Ryder T, Chen F, Feiler H, Tokuyasu T, Kingsley C, Dairkee S, Meng Z, Chew K, Pinkel D, Jain A, Ljung BM, Esserman L, Albertson DG, Waldman FM, Gray JW (2006) Genomic and transcriptional aberrations linked to breast cancer pathophysiologies. Cancer Cell 10: 529–541 [DOI] [PubMed] [Google Scholar]
- Dai H, van't Veer L, Lamb J, He YD, Mao M, Fine BM, Bernards R, van de Vijver M, Deutsch P, Sachs A, Stoughton R, Friend S (2005a) A cell proliferation signature is a marker of extremely poor outcome in a subpopulation of breast cancer patients. Cancer Res 65: 4059–4066 [DOI] [PubMed] [Google Scholar]
- Dai M, Wang P, Boyd AD, Kostov G, Athey B, Jones EG, Bunney WE, Myers RM, Speed TP, Akil H, Watson SJ, Meng F (2005b) Evolving gene/transcript definitions significantly alter the interpretation of GeneChip data. Nucleic Acids Res 33: e175. [DOI] [PMC free article] [PubMed] [Google Scholar]
- Desmedt C, Haibe-Kains B, Wirapati P, Buyse M, Larsimont D, Bontempi G, Delorenzi M, Piccart M, Sotiriou C (2008) Biological processes associated with breast cancer clinical outcome depend on the molecular subtypes. Clin Cancer Res 14: 5158–5165 [DOI] [PubMed] [Google Scholar]
- Desmedt C, Piette F, Loi S, Wang Y, Lallemand F, Haibe-Kains B, Viale G, Delorenzi M, Zhang Y, d'Assignies MS, Bergh J, Lidereau R, Ellis P, Harris AL, Klijn JG, Foekens JA, Cardoso F, Piccart MJ, Buyse M, Sotiriou C (2007) Strong time dependence of the 76-gene prognostic signature for node-negative breast cancer patients in the TRANSBIG multicenter independent validation series. Clin Cancer Res 13: 3207–3214 [DOI] [PubMed] [Google Scholar]
- Dubois L, Lieuwes NG, Maresca A, Thiry A, Supuran CT, Scozzafava A, Wouters BG, Lambin P (2009a) Imaging of CA IX with fluorescent labelled sulfonamides distinguishes hypoxic and (re)-oxygenated cells in a xenograft tumour model. Radiother Oncol 92: 423–428 [DOI] [PubMed] [Google Scholar]
- Dubois L, Magagnin MG, Cleven AH, Weppler SA, Grenacher B, Landuyt W, Lieuwes N, Lambin P, Gorr TA, Koritzinsky M, Wouters BG (2009b) Inhibition of 4E-BP1 sensitizes U87 glioblastoma xenograft tumors to irradiation by decreasing hypoxia tolerance. Int J Radiat Oncol Biol Phys 73: 1219–1227 [DOI] [PubMed] [Google Scholar]
- Dupuy A, Simon RM (2007) Critical review of published microarray studies for cancer outcome and guidelines on statistical analysis and reporting. J Natl Cancer Inst 99: 147–157 [DOI] [PubMed] [Google Scholar]
- Ein-Dor L, Zuk O, Domany E (2006) Thousands of samples are needed to generate a robust gene list for predicting outcome in cancer. Proc Natl Acad Sci USA 103: 5923–5928 [DOI] [PMC free article] [PubMed] [Google Scholar]
- Elston CW, Ellis IO (1991) Pathological prognostic factors in breast cancer. I. The value of histological grade in breast cancer: experience from a large study with long-term follow-up. Histopathology 19: 403–410 [DOI] [PubMed] [Google Scholar]
- Fan C, Oh DS, Wessels L, Weigelt B, Nuyten DS, Nobel AB, van't Veer LJ, Perou CM (2006) Concordance among gene-expression-based predictors for breast cancer. N Engl J Med 355: 560–569 [DOI] [PubMed] [Google Scholar]
- Glinsky GV (2006) Genomic models of metastatic cancer: functional analysis of death-from-cancer signature genes reveals aneuploid, anoikis-resistant, metastasis-enabling phenotype with altered cell cycle control and activated Polycomb Group (PcG) protein chromatin silencing pathway. Cell Cycle 5: 1208–1216 [DOI] [PubMed] [Google Scholar]
- Gomez-Raposo C, Mendiola M, Barriuso J, Hardisson D, Redondo A (2010) Molecular characterization of ovarian cancer by gene-expression profiling. Gynecol Oncol 118: 88–92 [DOI] [PubMed] [Google Scholar]
- Haibe-Kains B, Desmedt C, Sotiriou C, Bontempi G (2008) A comparative study of survival models for breast cancer prognostication based on microarray data: does a single gene beat them all? Bioinformatics 24: 2200–2208 [DOI] [PMC free article] [PubMed] [Google Scholar]
- Hao J, Xu A, Xie X, Tian T, Gao S, Xiao X, He D (2008) Elevated expression of UBE2T in lung cancer tumors and cell lines. Tumour Biol 29: 195–203 [DOI] [PubMed] [Google Scholar]
- Hommura F, Dosaka-Akita H, Mishina T, Nishi M, Kojima T, Hiroumi H, Ogura S, Shimizu M, Katoh H, Kawakami Y (2000) Prognostic significance of p27KIP1 protein and ki-67 growth fraction in non-small cell lung cancers. Clin Cancer Res 6: 4073–4081 [PubMed] [Google Scholar]
- Irizarry RA, Hobbs B, Collin F, Beazer-Barclay YD, Antonellis KJ, Scherf U, Speed TP (2003) Exploration, normalization, and summaries of high density oligonucleotide array probe level data. Biostatistics 4: 249–264 [DOI] [PubMed] [Google Scholar]
- Komaki R, Fujii T, Perkins P, Ro JY, Allen PK, Mason KA, Mountain CF, Milas L (1996) Apoptosis and mitosis as prognostic factors in pathologically staged N1 nonsmall cell lung cancer. Int J Radiat Oncol Biol Phys 36: 601–605 [DOI] [PubMed] [Google Scholar]
- Kuo WP, Jenssen TK, Butte AJ, Ohno-Machado L, Kohane IS (2002) Analysis of matched mRNA measurements from two different microarray technologies. Bioinformatics 18: 405–412 [DOI] [PubMed] [Google Scholar]
- Lau SK, Boutros PC, Pintilie M, Blackhall FH, Zhu CQ, Strumpf D, Johnston MR, Darling G, Keshavjee S, Waddell TK, Liu N, Lau D, Penn LZ, Shepherd FA, Jurisica I, Der SD, Tsao MS (2007) Three-gene prognostic classifier for early-stage non small-cell lung cancer. J Clin Oncol 25: 5562–5569 [DOI] [PubMed] [Google Scholar]
- Li Y, Zou L, Li Q, Haibe-Kains B, Tian R, Desmedt C, Sotiriou C, Szallasi Z, Iglehart JD, Richardson AL, Wang ZC (2010) Amplification of LAPTM4B and YWHAZ contributes to chemotherapy resistance and recurrence of breast cancer. Nat Med 16: 214–218 [DOI] [PMC free article] [PubMed] [Google Scholar]
- Loi S, Haibe-Kains B, Desmedt C, Wirapati P, Lallemand F, Tutt AM, Gillet C, Ellis P, Ryder K, Reid JF, Daidone MG, Pierotti MA, Berns EM, Jansen MP, Foekens JA, Delorenzi M, Bontempi G, Piccart MJ, Sotiriou C (2008) Predicting prognosis using molecular profiling in estrogen receptor-positive breast cancer treated with tamoxifen. BMC Genomics 9: 239. [DOI] [PMC free article] [PubMed] [Google Scholar]
- Lu TP, Tsai MH, Lee JM, Hsu CP, Chen PC, Lin CW, Shih JY, Yang PC, Hsiao CK, Lai LC, Chuang EY (2010) Identification of a novel biomarker, SEMA5A, for non-small cell lung carcinoma in nonsmoking women. Cancer Epidemiol Biomarkers Prev 19: 2590–2597 [DOI] [PubMed] [Google Scholar]
- Marie SK, Okamoto OK, Uno M, Hasegawa AP, Oba-Shinjo SM, Cohen T, Camargo AA, Kosoy A, Carlotti CG, Toledo S, Moreira-Filho CA, Zago MA, Simpson AJ, Caballero OL (2008) Maternal embryonic leucine zipper kinase transcript abundance correlates with malignancy grade in human astrocytomas. Int J Cancer 122: 807–815 [DOI] [PubMed] [Google Scholar]
- Michiels S, Koscielny S, Hill C (2005) Prediction of cancer outcome with microarrays: a multiple random validation strategy. Lancet 365: 488–492 [DOI] [PubMed] [Google Scholar]
- Miller LD, Smeds J, George J, Vega VB, Vergara L, Ploner A, Pawitan Y, Hall P, Klaar S, Liu ET, Bergh J (2005) An expression signature for p53 status in human breast cancer predicts mutation status, transcriptional effects, and patient survival. Proc Natl Acad Sci USA 102: 13550–13555 [DOI] [PMC free article] [PubMed] [Google Scholar]
- Oberthuer A, Hero B, Berthold F, Juraeva D, Faldum A, Kahlert Y, Asgharzadeh S, Seeger R, Scaruffi P, Tonini GP, Janoueix-Lerosey I, Delattre O, Schleiermacher G, Vandesompele J, Vermeulen J, Speleman F, Noguera R, Piqueras M, Benard J, Valent A, Avigad S, Yaniv I, Weber A, Christiansen H, Grundy RG, Schardt K, Schwab M, Eils R, Warnat P, Kaderali L, Simon T, Decarolis B, Theissen J, Westermann F, Brors B, Fischer M (2010) Prognostic impact of gene expression-based classification for neuroblastoma. J Clin Oncol 28: 3506–3515 [DOI] [PubMed] [Google Scholar]
- Oostendorp M, Douma K, Hackeng TM, Dirksen A, Post MJ, van Zandvoort MA, Backes WH (2008) Quantitative molecular magnetic resonance imaging of tumor angiogenesis using cNGR-labeled paramagnetic quantum dots. Cancer Res 68: 7676–7683 [DOI] [PubMed] [Google Scholar]
- Pallante P, Berlingieri MT, Troncone G, Kruhoffer M, Orntoft TF, Viglietto G, Caleo A, Migliaccio I, Decaussin-Petrucci M, Santoro M, Palombini L, Fusco A (2005) UbcH10 overexpression may represent a marker of anaplastic thyroid carcinomas. Br J Cancer 93: 464–471 [DOI] [PMC free article] [PubMed] [Google Scholar]
- Pawitan Y, Bjohle J, Amler L, Borg AL, Egyhazi S, Hall P, Han X, Holmberg L, Huang F, Klaar S, Liu ET, Miller L, Nordgren H, Ploner A, Sandelin K, Shaw PM, Smeds J, Skoog L, Wedren S, Bergh J (2005) Gene expression profiling spares early breast cancer patients from adjuvant therapy: derived and validated in two population-based cohorts. Breast Cancer Res 7: R953–R964 [DOI] [PMC free article] [PubMed] [Google Scholar]
- Raponi M, Zhang Y, Yu J, Chen G, Lee G, Taylor JM, Macdonald J, Thomas D, Moskaluk C, Wang Y, Beer DG (2006) Gene expression signatures for predicting prognosis of squamous cell and adenocarcinomas of the lung. Cancer Res 66: 7466–7472 [DOI] [PubMed] [Google Scholar]
- Rouschop KM, van den Beucken T, Dubois L, Niessen H, Bussink J, Savelkouls K, Keulers T, Mujcic H, Landuyt W, Voncken JW, Lambin P, van der Kogel AJ, Koritzinsky M, Wouters BG (2010) The unfolded protein response protects human tumor cells during hypoxia through regulation of the autophagy genes MAP1LC3B and ATG5. J Clin Invest 120: 127–141 [DOI] [PMC free article] [PubMed] [Google Scholar]
- Ryu B, Kim DS, Deluca AM, Alani RM (2007) Comprehensive expression profiling of tumor cell lines identifies molecular signatures of melanoma progression. PLoS One 2: e594. [DOI] [PMC free article] [PubMed] [Google Scholar]
- Sabatier R, Finetti P, Cervera N, Lambaudie E, Esterni B, Mamessier E, Tallet A, Chabannon C, Extra JM, Jacquemier J, Viens P, Birnbaum D, Bertucci F (2010) A gene expression signature identifies two prognostic subgroups of basal breast cancer. Breast Cancer Res Treat 126(2): 407–420 [DOI] [PubMed] [Google Scholar]
- Shedden K, Taylor JM, Enkemann SA, Tsao MS, Yeatman TJ, Gerald WL, Eschrich S, Jurisica I, Giordano TJ, Misek DE, Chang AC, Zhu CQ, Strumpf D, Hanash S, Shepherd FA, Ding K, Seymour L, Naoki K, Pennell N, Weir B, Verhaak R, Ladd-Acosta C, Golub T, Gruidl M, Sharma A, Szoke J, Zakowski M, Rusch V, Kris M, Viale A, Motoi N, Travis W, Conley B, Seshan VE, Meyerson M, Kuick R, Dobbin KK, Lively T, Jacobson JW, Beer DG (2008) Gene expression-based survival prediction in lung adenocarcinoma: a multi-site, blinded validation study. Nat Med 14: 822–827 [DOI] [PMC free article] [PubMed] [Google Scholar]
- Sotiriou C, Pusztai L (2009) Gene-expression signatures in breast cancer. N Engl J Med 360: 790–800 [DOI] [PubMed] [Google Scholar]
- Sotiriou C, Wirapati P, Loi S, Harris A, Fox S, Smeds J, Nordgren H, Farmer P, Praz V, Haibe-Kains B, Desmedt C, Larsimont D, Cardoso F, Peterse H, Nuyten D, Buyse M, Van de Vijver MJ, Bergh J, Piccart M, Delorenzi M (2006) Gene expression profiling in breast cancer: understanding the molecular basis of histologic grade to improve prognosis. J Natl Cancer Inst 98: 262–272 [DOI] [PubMed] [Google Scholar]
- Span PN, Waanders E, Manders P, Heuvel JJ, Foekens JA, Watson MA, Beex LV, Sweep FC (2004) Mammaglobin is associated with low-grade, steroid receptor-positive breast tumors from postmenopausal patients, and has independent prognostic value for relapse-free survival time. J Clin Oncol 22: 691–698 [DOI] [PubMed] [Google Scholar]
- Sparano JA (2006) TAILORx: trial assigning individualized options for treatment (Rx). Clin Breast Cancer 7: 347–350 [DOI] [PubMed] [Google Scholar]
- Starmans MH, Krishnapuram B, Steck H, Horlings H, Nuyten DS, van de Vijver MJ, Seigneuric R, Buffa FM, Harris AL, Wouters BG, Lambin P (2008) Robust prognostic value of a knowledge-based proliferation signature across large patient microarray studies spanning different cancer types. Br J Cancer 99: 1884–1890 [DOI] [PMC free article] [PubMed] [Google Scholar]
- Subramanian J, Simon R (2010) Gene expression-based prognostic signatures in lung cancer: ready for clinical use? J Natl Cancer Inst 102: 464–474 [DOI] [PMC free article] [PubMed] [Google Scholar]
- Symmans WF, Hatzis C, Sotiriou C, Andre F, Peintinger F, Regitnig P, Daxenbichler G, Desmedt C, Domont J, Marth C, Delaloge S, Bauernhofer T, Valero V, Booser DJ, Hortobagyi GN, Pusztai L (2010) Genomic index of sensitivity to endocrine therapy for breast cancer. J Clin Oncol 28: 4111–4119 [DOI] [PMC free article] [PubMed] [Google Scholar]
- Tan PK, Downey TJ, Spitznagel EL, Xu P, Fu D, Dimitrov DS, Lempicki RA, Raaka BM, Cam MC (2003) Evaluation of gene expression measurements from commercial microarray platforms. Nucleic Acids Res 31: 5676–5684 [DOI] [PMC free article] [PubMed] [Google Scholar]
- Tumor Analysis Best Practices Working Group (2004) Expression profiling--best practices for data generation and interpretation in clinical trials. Nat Rev Genet 5: 229–237 [DOI] [PubMed] [Google Scholar]
- van de Vijver MJ, He YD, van't Veer LJ, Dai H, Hart AA, Voskuil DW, Schreiber GJ, Peterse JL, Roberts C, Marton MJ, Parrish M, Atsma D, Witteveen A, Glas A, Delahaye L, van der Velde T, Bartelink H, Rodenhuis S, Rutgers ET, Friend SH, Bernards R (2002) A gene-expression signature as a predictor of survival in breast cancer. N Engl J Med 347: 1999–2009 [DOI] [PubMed] [Google Scholar]
- van Ree JH, Jeganathan KB, Malureanu L, van Deursen JM (2010) Overexpression of the E2 ubiquitin-conjugating enzyme UbcH10 causes chromosome missegregation and tumor formation. J Cell Biol 188: 83–100 [DOI] [PMC free article] [PubMed] [Google Scholar]
- Wang Y, Klijn JG, Zhang Y, Sieuwerts AM, Look MP, Yang F, Talantov D, Timmermans M, Meijer-van Gelder ME, Yu J, Jatkoe T, Berns EM, Atkins D, Foekens JA (2005) Gene-expression profiles to predict distant metastasis of lymph-node-negative primary breast cancer. Lancet 365: 671–679 [DOI] [PubMed] [Google Scholar]
- Weigelt B, Baehner FL, Reis-Filho JS (2010) The contribution of gene expression profiling to breast cancer classification, prognostication and prediction: a retrospective of the last decade. J Pathol 220: 263–280 [DOI] [PubMed] [Google Scholar]
- Whitfield ML, George LK, Grant GD, Perou CM (2006) Common markers of proliferation. Nat Rev Cancer 6: 99–106 [DOI] [PubMed] [Google Scholar]
- Whitfield ML, Sherlock G, Saldanha AJ, Murray JI, Ball CA, Alexander KE, Matese JC, Perou CM, Hurt MM, Brown PO, Botstein D (2002) Identification of genes periodically expressed in the human cell cycle and their expression in tumors. Mol Biol Cell 13: 1977–2000 [DOI] [PMC free article] [PubMed] [Google Scholar]
- Wirapati P, Sotiriou C, Kunkel S, Farmer P, Pradervand S, Haibe-Kains B, Desmedt C, Ignatiadis M, Sengstag T, Schutz F, Goldstein DR, Piccart M, Delorenzi M (2008) Meta-analysis of gene expression profiles in breast cancer: toward a unified understanding of breast cancer subtyping and prognosis signatures. Breast Cancer Res 10: R65. [DOI] [PMC free article] [PubMed] [Google Scholar]
- Zhang Y, Sieuwerts AM, McGreevy M, Casey G, Cufer T, Paradiso A, Harbeck N, Span PN, Hicks DG, Crowe J, Tubbs RR, Budd GT, Lyons J, Sweep FC, Schmitt M, Schittulli F, Golouh R, Talantov D, Wang Y, Foekens JA (2009) The 76-gene signature defines high-risk patients that benefit from adjuvant tamoxifen therapy. Breast Cancer Res Treat 116: 303–309 [DOI] [PubMed] [Google Scholar]
- Zhao H, Ljungberg B, Grankvist K, Rasmuson T, Tibshirani R, Brooks JD (2006) Gene expression profiling predicts survival in conventional renal cell carcinoma. PLoS Med 3: e13. [DOI] [PMC free article] [PubMed] [Google Scholar]
- Zhou YH, Raj VR, Siegel E, Yu L (2010) Standardization of gene expression quantification by absolute real-time qRT-PCR system using a single standard for marker and reference genes. Biomark Insights 5: 79–85 [DOI] [PMC free article] [PubMed] [Google Scholar]
- Zien A, Fluck J, Zimmer R, Lengauer T (2003) Microarrays: how many do you need? J Comput Biol 10: 653–667 [DOI] [PubMed] [Google Scholar]
Associated Data
This section collects any data citations, data availability statements, or supplementary materials included in this article.