

Abstract
Pituitary adenomas account for ∼10% of intracranial tumors, and they cause the compression of nearby structures and the inappropriate expression of pituitary hormones. Unlike functional pituitary adenomas, nonfunctional (NF) pituitary adenomas account for ∼30% of pituitary tumors, and are large enough to cause blindness; because they do not cause any clinical hormone hypersecretion, they are difficult to detect at an early stage; and hypopituitarism results. No effective molecular biomarkers or chemical therapy have been approved for the clinical setting. Because an NF pituitary adenoma is highly heterogeneous, differences in the proteins (the proteome) can distinguish among those heterogeneity structures. The components of a proteome dynamically change as an NF adenoma progresses. Changes in protein expression and protein modifications, individually or in combination, might be biomarkers to predict the disease, monitor the tumor progression, and develop an accurate molecular classification for personalized patient treatment. The modalities of proteomic variation might also be useful in the interventional prevention and personalized treatment of patients to halt the occurrence and progression of NF pituitary adenomas.
Keywords: Clinical nonfunctional pituitary adenoma, Proteomic variation, Predictive diagnosis, Tumor progression monitoring, Interventional prevention, Personalized patient treatment
Introduction
Pituitary adenomas are a common pathological change that account for ∼10% of intracranial tumors [1]. They cause significant morbidity through a compression of regional structures and an inappropriate expression of pituitary hormones that disturb the multiple hypothalamic-pituitary-target organ axis systems. Pituitary adenomas are clinically classified as functional (∼70%; such as acromegaly and prolactinoma) and nonfunctional (∼30%). Unlike functional pituitary adenomas, nonfunctional (NF) pituitary adenomas are typically quite large, do not cause any clinical hormone hypersecretion, and result in hypopituitarism or blindness from regional compression. Moreover, an NF pituitary adenoma is highly heterogeneous in the cell of origin [1]. Therefore, an early-stage diagnosis of NF pituitary adenomas is difficult because there is no hormone hypersecretion and there is no effective chemical therapy for NF pituitary adenomas. Predictive diagnosis/prevention and early-stage diagnosis/clinical therapy are the crucial aspects needed to conquer a tumor because most of NF pituitary adenomas remain as late-stage diagnosed and neurosurgically/radiation treated. Modern proteomics methods provide insight into the proteome, which is a dynamically changing protein-network system that progresses with disease. Study of the proteomic variations will result in new concepts and models for the more-accurate prediction, prevention, and personalized patient therapy for NF pituitary adenomas. This review article addresses the contribution of tissue-proteomic variations to the interventional prevention and personalized patient treatment, and the contribution of body-fluid proteomic variations to the predictive diagnosis and the assessment of preventive and therapeutic responses.
Pathophysiological basis for the variation of the proteome in an NF pituitary adenoma
Pituitary adenomas are monoclonal in the cell of origin [2, 3], and might arise from any one of five pituitary anterior cell types (Fig. 1) [4, 5]—including corticotrophs [secrete adrenocorticotropic hormone (ACTH)], somatotrophs [secrete growth hormone (GH)], lactotrophs [secrete prolactin (PRL)], thyrotrophs [secrete thyrotropin-stimulating hormone, or thyrotropin (TSH)], and gonadotrophs [secrete follicle-stimulating hormone, or follitropin (FSH) and luteinizing hormone, or lutropin (LH)]—to produce an imbalance in hormone levels that will disturb the multiple regulatory hypothalamic-anterior pituitary-target organ axes. Each axis performs a range of important physiologic functions in the human body (Fig. 1). Mixed-tumors (co-secrete GH with PRL, TSH, or ACTH) might also arise from single cells. ACTH oversecretion results in Cushing’s disease, with features of hypercortisolism; GH hypersecretion leads to acral overgrowth and metabolic dysfunction associated with acromegaly; and PRL oversecretion leads to gonadal failure, secondary infertility, and galactorrhea. More rarely, TSH hypersecretion leads to hyperthyroxinemia and goiter, and hypersecreted GH (or GH subunits) leads to gonadal dysfunction. In contrast, tumors that arise from gonadotroph cells do not efficiently secrete their gene products, and they are usually clinically silent [4]. They are commonly referred to as NF pituitary adenomas, which cannot be diagnosed early because no hormone change is observed. However, NF pituitary adenomas are highly heterogeneous in the cell of origin (Table 1) [1]. Except for a gonadotroph-originated intact LH/FSH adenoma (up to 79% of NF adnomas), immunocytochemical staining of hormones also reveals that some NF pituitary adenomas might arise from a silent corticotroph (ACTH-positive; 8%), silent somatotroph (GH-positive; 3%), no hormone-expressed oncocytoma (6%), and null cell (17%).
Fig. 1.
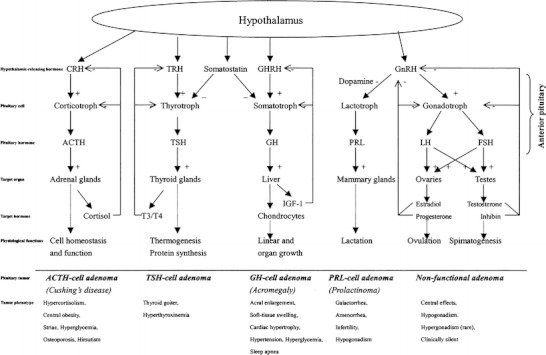
Scheme of the hypothalamic-anterior pituitary-target organ axis systems and pituitary adenoma pathogenesis [4]. (+) = stimulatory regulation; (−) = inhibitory regulation. Reproduced from Zhan and Desiderio [5], with permission from Wiley-VCH, copyright 2005; and modified from Melmed [4], with permission from Copyright Clearance Center Inc. (Re: Journal of Clinical Investigation), copyright 2003
Table 1.
Classification of nonfunctional pituitary adenomas by cell of origin
| Cell type | Hormone expression | % Nonfunctional tumors |
|---|---|---|
| Gonadotrophs | Intact LH/FSH or subunits | 40–79 |
| Null cell | None | 17 |
| Oncocytoma | None | 6 |
| Silent corticotroph | ACTH | 8 |
| Silent somatotroph | GH | 3 |
Reproduced from Oyesiku [1], with permission from AACR, copyright 2005.
Those heterogeneous cells of origin of NF pituitary adenomas produce differences in a proteome relative to the control and among different NF pituitary adenoma patients, and that difference in the proteome dynamically changes with tumor progression. The proteomic difference among different types of NF pituitary adenomas, and the dynamic alteration with tumor progression, both contribute to the prediction, interventional prevention, and personalized patient treatment of NF pituitary adenoma patients.
Targeted organs of proteomic variation that contribute to the prediction, prevention, and personalized treatment of an NF pituitary adenoma
The pituitary is the most-protected organ in the body, and is the master regulatory gland; several different hypothalamic-pituitary-target organ axes exist. Any metabolic defect in those regulatory systems has an associated pathology. Based on the new concept of prediction, prevention, and personalized patient treatment of an NF pituitary adenoma, pituitary tissues, cerebrospinal fluid (CSF), and blood plasma must be analyzed. Any tissue-proteome variation directly reflects the pathophysiological changes of an NF pituitary adenoma. Those tissue-proteome variations, and the corresponding changes in the biological system, can be developed into an accurate molecular classification, interventional prevention, and personalized patient treatment. In addition, in an NF pituitary adenoma patient, some secreted proteins and peptides will enter into the CSF and blood circulation. Comparative proteomics can detect those different components (proteins or peptides) in the patient’s CSF and blood plasma. Those CSF and blood plasma proteomic and peptidomic variations will lead to the development of an accurate predictive diagnosis and the measurement of interventional prevention and therapy response based on accurate molecular data.
Pituitary tumor tissues are generally acquired with neurosurgery from patients, whereas control tissues are generally obtained via forensic anatomy from post-mortem cardavers. Therefore, there is some uncontrollable bias among pituitary adenoma tissues and “so-called” control tissue proteome such as sex, age, race, and time of tissue acquisition; and some biochemical changes might occur in post-mortem tissue compared to surgical tissue. Also, an NF pituitary adenoma is monoclonal in origin, and is generally benign. An NF pituitary adenoma tissue contains a relatively pure cell population, whereas control post-mortem pituitary tissues contain different types of cells, including at least corticotrophs, somatotrophs, lactotrophs, thyrotrophs, and gonadotrophs, etc. When the tumor tissues and post-mortem tissues are used to analyze the proteomic variation, another bias is possible. The use of laser-capture microdissection (LCM) to preferentially enrich a specific tumor cell type from tumor tissues and the corresponding normal cells from post-mortem tissues overcomes this bias. Compared to a tissue proteome, those limitations do not exist for the CSF and blood specimens. Also, CSF and blood specimens are much more accessible from patients and controls than the pituitary tissues.
Techniques to measure proteomic variation
Modern proteomics uses protein-separation techniques such as gel and non-gel methods, protein-identification techniques such as mass spectrometry (MS), multiple protein-preparation techniques, and systems biology techniques to quantitatively measure proteomic variation in tissue, CSF, and blood plasma samples from patients and controls.
Gel methods include two-dimensional gel electrophoresis (2DGE) and 2D differential in-gel electrophoresis (2D DIGE). 2DGE-based comparative proteomics is a classical, reliable method to quantify accurately any proteomic variation. Briefly, proteins are arrayed with 2DGE according to their pI and Mr, and are stained. Each 2D gel spot-volume reflects the abundance of the protein contained in that spot. Each individual gel spot-volume is generally normalized with the total spot-volumes of each gel image [6, 7]. 2DGE images from tumors and controls are compared with 2D gel-analysis software to obtain statistically significant differential 2D gel spot-volume between tumors and controls. The amino acid sequence of a protein in each 2D gel spot is obtained with MS, including peptide mass fingerprint (PMF) (which determines the MW of each tryptic peptide from that protein) and/or tandem mass spectrometry (MS/MS) (which determines the amino acid sequence of each tryptic peptide), and corresponding protein database analysis [8].
2D DIGE is another gel method to quantify the proteomic variation [9–11]. Generally, the tumor and control samples are labeled with different fluorescent dyes such as CyDye 3 and CyDye 5. The CyDye-labeled samples are mixed equally (1:1), and the mixed sample is separated with 2DGE according to pI and Mr. The proteins are visualized, and the image is scanned with a CyDye 3 channel and CyDye 5 channel to form two fluorescent images, which are processed with DeCyder DIGE analysis software or Delta 2D software. Any color difference in a gel spot defines and quantifies the protein content between tumors and controls. The amino acid sequence of tryptic peptides from each protein in each gel spot is determined with MS/MS. 2D DIGE is more useful to analyze precious LCM-enriched samples because 2D DIGE requires less protein amount and fewer gel-analysis procedures relative to the traditional 2DGE-based comparative proteomics.
Non-gel methods mainly include the analysis of trypsin-digests from a complex mixture of proteins with multidimensional chromatography coupled on-line with MS [12, 13]. That strategy generates tryptic peptides that are separated in the first dimension with any one of several different chromatographies, and with reversed-phase chromatography in the second dimension. The separated peptides are analyzed with MS/MS, and the amino acid sequences are analyzed with a database analysis for protein identification. The technique has been used to analyze some human tissue proteomes [14]. For quantification of proteomic variation, that technique must be coupled with stable-isotope labeling prior to multidimensional-chromatography analysis [15]. The light and heavy isotope-labeled peptides were quantified with MS/MS to quantify and identify the protein amount between tumor and control proteomes. A wide variety of stable isotope-labeling techniques have been developed; for example, cysteine-specific tagging such as ICAT [16], lysine-specific tagging [17, 18], and amine-specific tagging such as iTRAQ [19–21]. Moreover, some software has been developed to quantitatively analyze the stable isotope-labeled peptides; for example, XPRESS software for ICAT-labeled peptides. Non-gel methods effectively detect low-abundance proteins, extremely acidic/basic proteins, and low/high-Mr proteins. Although the gel methods are limited by the extremely acidic (pI < 3.5 or 4)/basic (pI > 7.5 or 8) proteins, extremely high-mass (>150 kDa) or low-mass (<10 kDa) proteins, and hydrophobic proteins [5], the non-gel techniques are complementary with the gel-based methods, and improve the proteomic coverage of an NF pituitary adenoma proteome.
Systems biology techniques such as pathway analysis help to elucidate each protein variation within a pathway network system. The development of bioinformatics and computation biology underpins systems biology developments. A wide-range of pathway analysis programs has been developed such as Ingenuity Pathway Analysis (IPA) (www.ingenuity.com) and MetaCore (www.genego.com/metacore.php). Pathway analysis has been used to mine significant pathway networks from pituitary adenoma tissue comparative proteomic data and proteomic modification data [22]. The recovery of the tumor-altered pathway system to the normal pathway system would contribute significantly to interventional prevention and effective chemical therapy. Those proteomic variations include variations in protein expression and post-translational modifications (PTMs).
Tissue proteomic variations that contribute to accurate molecular classification, interventional prevention, and personalized patient treatment
A tissue proteome is a systematic and tightly regulated protein-network system that dynamically changes during pathophysiological processes. Multiple endogenous and exogenous factors cause an alteration of certain elements within a proteome relative to controls. Those altered elements include protein differential expression (DEPs), splicing isoforms (such as hormone isoforms), and protein modifications (such as tyrosine nitration and phosphorylation), etc.
A total of 56 DEPs has been identified among NF adenomas and controls with 2DGE comparative proteomics strategies (Table 2) [1]. A large-scale comparative proteomics study was performed on a set of human pituitary samples [1, 5, 23]: controls (n = 8) versus several different cell-types of NF pituitary adenomas (NF-, n = 3; LH+, n = 3; FSH+, n = 3; FSH+/LH+, n = 3) and hyperprolactinomas (n = 4). A total of 93 differential protein-spots (65 decreased spot volumes, 28 increased) were found in NF pituitary adenomas and prolactinomas. Seventy-two spots (50 decreased, 22 increased) that represented 56 DEP’s (34 down-regulated, 22 up-regulated) were characterized with MS and database analysis. Functional roles are summarized in Fig. 2. Results indicated that: (i) neuroendocrine-related proteins, including somatotropin, secretagogin, and mu-crystallin homolog, were down-regulated in NF pituitary adenomas and the hyperprolactinoma; (ii) somatotropin existed in at least 17 isoforms that were down-regulated in NF adenomas and the hyperprolactinomas; (iii) prolactin existed in six isoforms that were down-regulated in NF adenomas, and no-change in the hyperprolactinomas; (iv) immunologic regulation proteins and tumor-related antigen (for example, immunoglobulin, tumor-rejection antigen 1) were down-regulated in NF adenomas; (v) cell proliferation, differentiation, and apoptosis-related proteins were down-regulated in the NF-adenomas and the hyperprolactinomas; (vi) some cell-defense and stress-resistance proteins (for example, phospholipid hydroperoxide glutathione peroxidase, CD59 glycoprotein, and heat-shock 27 kDa protein) were down-regulated in the NF pituitary adenomas; (vii) some metabolic enzyme-related proteins (for example, cytoplasmic isocitrate dehydrogenase [NADP], tryptophan 5-hydroxylase 2, matrix metalloproteinase-9, aldose reductase, lactoylglutathione lyase, acyl-CoA-binding protein, etc.) were up-regulated in the NF pituitary adenomas; and (viii) for cell-signal proteins, some were down-regulated and some were up-regulated in NF adenomas; those cell signals are involved in the complex biological roles in the cell growth, proliferation, differentiation, apoptosis, and death cycles.
Table 2.
Differentially expressed proteins identified in human nonfunctional pituitary adenoma tissues with 2DGE-based comparative proteomics
| ID | Molecules | Fold-change | Description | Location | Function |
|---|---|---|---|---|---|
| P49753 | ACOT2 | 5.8 | acyl-CoA thioesterase 2 | C | enzyme |
| P15121 | AKR1B1 | 14.6 | aldo-keto reductase family 1B1 | C | enzyme |
| P02647 | APOA1 | −3.2 | apolipoprotein A-I | EC | transporter |
| P06576 | ATP5B | 5.0 | ATP synthase, H + transporting, mitochondrial F1 complex, beta polypeptide | C | transporter |
| P47756 | CAPZB | 6.5 | capping protein (actin filament) muscle Z-line, beta | C | other |
| CAPZB | CAPZB | 6.5 | capping protein (actin filament) muscle Z-line, beta | C | other |
| P13987 | CD59 | −9.5 | CD59 molecule, complement regulatory protein | PM | other |
| P12110 | COL6A2 | −14.7 | collagen, type VI, alpha 2 | EC | other |
| P14854 | COX6B1 | 9.3 | cytochrome c oxidase subunit Vib polypeptide 1 (ubiquitous) | C | enzyme |
| Q14894 | CRYM | −35.3 | crystallin, mu | C | enzyme |
| CSN1S1 | CSN1S1 (includes EG:1446) | −17.8 | casein alpha s1 | EC | other |
| P07108 | DBI | 4.3 | acyl-Coenzyme A binding protein | C | other |
| Q9UHL4 | DPP7 | −9.3 | dipeptidyl-peptidase 7 | C | peptidase |
| Q14259 | ERH | 5.0 | enhancer of rudimentary homolog | N | other |
| P30040 | ERP29 | 4.6 | endoplasmic reticulum protein 29 | C | transporter |
| P00742 | F10 | −83.0 | coagulation factor X | EC | peptidase |
| P06241 | FYN | 3.9 | FYN oncogene related to SRC, FGR,YES | PM | kinase |
| P31150 | GDI1 | 9.4 | GDP dissociation inhibitor 1 | C | other |
| P01241 | GH1 | −180.6 | growth hormone 1 | EC | cytokine |
| P01241 | GH1 | −13.3 | growth hormone 1 | EC | cytokine |
| P01241 | GH1 | −13.3 | growth hormone 1 | EC | cytokine |
| P01241 | GH1 | −20.2 | growth hormone 1 | EC | cytokine |
| P01241 | GH1 | −14.1 | growth hormone 1 | EC | cytokine |
| P01241 | GH1 | −128.3 | growth hormone 1 | EC | cytokine |
| P01241 | GH1 | −14.8 | growth hormone 1 | EC | cytokine |
| P01241 | GH1 | −48.1 | growth hormone 1 | EC | cytokine |
| P01241 | GH1 | −17.3 | growth hormone 1 | EC | cytokine |
| P01241 | GH1 | −16.9 | growth hormone 1 | EC | cytokine |
| P01241 | GH1 | −88.8 | growth hormone 1 | EC | cytokine |
| P01241 | GH1 | −27.8 | growth hormone 1 | EC | cytokine |
| P01241 | GH1 | −51.2 | growth hormone 1 | EC | cytokine |
| P01241 | GH1 | −32.1 | growth hormone 1 | EC | cytokine |
| P01241 | GH1 | −478.6 | growth hormone 1 | EC | cytokine |
| P01241 | GH1 | −13.4 | growth hormone 1 | EC | cytokine |
| P01241 | GH1 | −161.0 | growth hormone 1 | EC | cytokine |
| P01241 | GH1 | −37.0 | growth hormone 1 | EC | cytokine |
| P01242 | GH2 | −14.1 | growth hormone 2 | EC | other |
| Q04760 | GLO1 | 10.2 | glyoxalase I | C | enzyme |
| Q04760 | GLO1 | 8.3 | glyoxalase I | C | enzyme |
| P09471 | GNAO1 | 9.5 | G protein, alpha activating activity polypeptide O | PM | enzyme |
| P29777 | GNAO1 | 9.5 | G protein, alpha activating activity polypeptide O | PM | enzyme |
| P36969 | GPX4 | −26.1 | glutathione peroxidase 4 | C | enzyme |
| P28161 | GSTM2 | 4.2 | glutathione S-transferase M2 (muscle) | C | enzyme |
| HBB | HBB (includes EG:3043) | −3.1 | hemoglobin, beta | C | transporter |
| HBB | HBB (includes EG:3043) | −99.4 | hemoglobin, beta | C | transporter |
| P02081 | HBD | −3.1 | hemoglobin, delta | C | transporter |
| P14625 | HSP90B1 | −11.0 | HSP90 beta (Grp94), member 1 | C | other |
| P04792 | HSPB1 | −5.1 | heat shock 27 kDa protein 1 | C | other |
| Q9UJY1 | HSPB8 | −3.7 | heat shock 22 kDa protein 8 | C | kinase |
| O75874 | IDH1 | 8.7 | isocitrate dehydrogenase 1 (NADP+), soluble | C | enzyme |
| P24592 | IGFBP6 | −20.9 | insulin-like growth factor binding protein 6 | EC | other |
| IGLC1 | IGLC1 | −32.1 | immunoglobulin lambda constant 1 | C | other |
| IGLC3 | IGLC3 | −32.1 | immunoglobulin lambda constant 3 | NA | other |
| P08779 | KRT16 | −28.8 | keratin 16 (focal non-epidermolytic palmoplantar keratoderma) | C | other |
| Q86U44 | METTL3 | −8.3 | methyltransferase like 3 | N | enzyme |
| Q99542 | MMP19 | 3.1 | matrix metallopeptidase 19 | EC | peptidase |
| P12524 | MYCL1 | −17.8 | v-myc myelocytomatosis viral oncogene homolog 1, lung carcinoma derived (avian) | N | transcription regulator |
| O00217 | NDUFS8 | 5.2 | NADH-coenzyme Q reductase | C | enzyme |
| P20774 | OGN | −38.0 | osteoglycin | EC | growth factor |
| Q08752 | PPID | 5.1 | peptidylprolyl isomerase D (cyclophilin D) | C | enzyme |
| Q00007 | PPP2R2A | −8.2 | protein phosphatase 2 (formerly 2A), regulatory subunit B, alpha isoform | C | phosphatase |
| P01236 | PRL | −99.9 | prolactin | EC | cytokine |
| P01236 | PRL | −9.7 | prolactin | EC | cytokine |
| P01236 | PRL | −26.2 | prolactin | EC | cytokine |
| P01236 | PRL | −20.1 | prolactin | EC | cytokine |
| P01236 | PRL | −36.7 | prolactin | EC | cytokine |
| P01236 | PRL | −33.6 | prolactin | EC | cytokine |
| O76038 | SCGN | −6.6 | secretagogin | C | other |
| Q9UI15 | TAGLN3 | 5.6 | transgelin 3 | NA | other |
| P21980 | TGM2 | −17.1 | transglutaminase 2 | C | enzyme |
| Q8IWU9 | TPH2 | 10.6 | tryptophan hydroxylase 2 | NA | enzyme |
| O14530 | TXNDC9 | −11.4 | thioredoxin domain containing 9 | NA | other |
| P08670 | VIM | 5.5 | vimentin | C | other |
| P27348 | YWHAQ (includes EG:10971) | −43.5 | tyrosine 3-monooxygenase/tryptophan 5-monooxygenase activation protein, theta polypeptide (14-3-3 protein tau) | C | other |
| Q14584 | ZNF266 | 7.3 | zinc finger protein 266 | N | other |
| IL15-S21AA | P40933-2 | −2.7 | Splice isoform IL15-S21AA of interleukin-15 | ||
| P01620 | −32.1 | Ig kappa chain V-III region SIE | |||
| IGLC2 | P01842 | −32.1 | Ig lambda chain C regions | ||
| P01621 | −32.1 | Ig Kappa chain V-III region NG9 | |||
| P04433 | −32.1 | Ig kappa chain V-III region VG | |||
| HBB2 | P18988 | −3.1 | Hemoglobin beta-2 chain (PANLE) | ||
| gi 1066765 | −176.7 | Hemoglobin beta unit variant | |||
| HBB2 | P18988 | −99.4 | Hemoglobin beta-2 chain (PANLE) | ||
| P01935 | −99.4 | Hemoglobin alpha-3 chain (PANTR) | |||
| P01968 | −20.2 | Hemoglobin alpha-2 chain (BOSMU) | |||
| HBB2 | P18988 | −20.2 | Hemoglobin beta-2 chain (PANLE) |
Fig. 2.
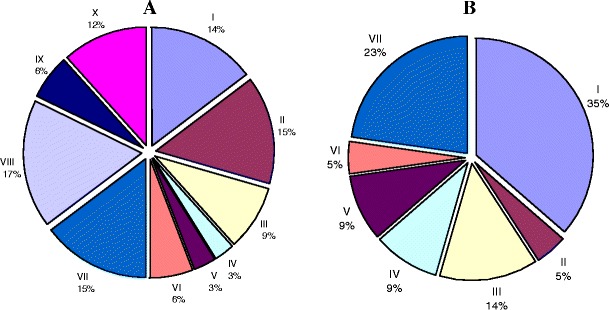
Functional categories of the 56 DEPs. A Down-regulated proteins in pituitary adenoma (34): I. Neuro-endocrine and hormones; II. Cytokine and cellular signal-related proteins; III. Cellular defense and stress resistance; IV. mRNA splicing, transport, or translation-related enzymes; V. DNA-binding proteins; VI. Metabolic enzymes; VII. Immunologic regulation proteins and tumor-related antigen; VIII. Transport proteins; IX. Cell proliferation, differentiation, and apoptosis-related proteins; X. Others. B Up-regulated proteins in pituitary adenomas (22): I. Metabolic enzyme-related proteins; II. Energy metabolism; III. Cellular signal proteins; IV. Cell cycle, cell growth and proliferation proteins; V. Cellular defense response; VI. Protein folding-related protein; and VII. Others. Reproduced from Zhan and Desiderio [5], with permission from Wiley-VCH, copyright 2005
The heterogeneity of hormone expression is an important characteristic in an NF pituitary adenoma. Protein isoforms result from protein PTMs, splicing, etc. A comparative proteomics study of NF adenomas demonstrated that two hormones (GH and PRL) had multiple isoforms [1, 23]. Twenty-four 2D gel spots that contained GH were found in control pituitary tissues [24] (Fig. 3). Those hGHs in the 24 2D gel spots were classified into four types of hGH-splicing isoforms, 1–4. The expression proportion of those four isoforms were isoform 1 (87.5 %) > isoform 2 (8.1 %) > isoform 3 (3.3 %) > isoform 4 (1.1 %) (Fig. 4); and a significant statistical difference was found among those isoforms. Not all of isoforms related to NF pituitary adenomas [1]. Somatotropin was significantly down-regulated at the protein and the mRNA levels in the NF pituitary adenoma [1] and in prolactinomas [23]; that finding is consistent with their monoclonal origin [2, 3]—an NF adenoma originated from gonadotrophs, and a prolactinoma from lactotrophs; the GH receptor gene was unchanged. Those data showed that GH hyposecretion in an NF-adenoma results from the hypo-expression of the GH gene. However, the more important finding is that the multiple GH isoforms (17 spots contain somatotropin) were detected [1, 23]; those data cannot be interpreted from transcriptomics data. The down-regulated ratio of the different GH isoforms was different in each cell-type of NF pituitary adenoma relative to the controls. Those data suggested that the proportion of the different GH isoforms changed in each cell-type NF adenoma compared to controls. Other researchers showed that the proportion of a circulating GH isoform significantly changed in pituitary adenomas and other pituitary diseases [25, 26]. The proportional change of the different GH isoforms might have an important value in the clinical evaluation of NF adenomas. Recently, studies found that GH isoforms were derived from a variety of splicing variants and PTMs, including phosphorylation [24]. The phosphorylation of endogenous GH in the human pituitary [27] provided new insights into the mechanisms of GH that participate in the neuroendocine signal pathways.
Fig. 3.
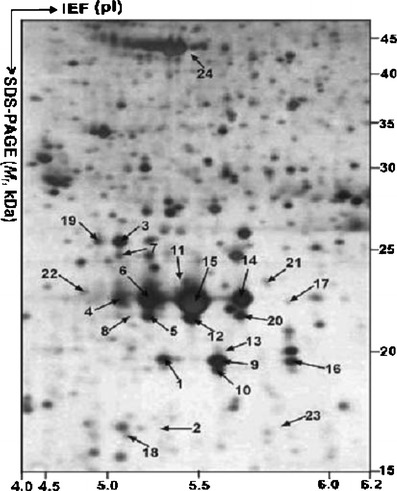
MS-characterized GH isoforms in a 2-DE map of human pituitary. IEF was performed with an IPG dry strip (18 cm, pH 3–10 nonlinear). SDS-PAGE was performed with a polyacrylamide (12%) resolving gel. The protein in each labeled spot was MS-characterized. Reproduced from Zhan and Desiderio [24], with permission from Wiley-VCH, copyright 2005
Fig. 4.
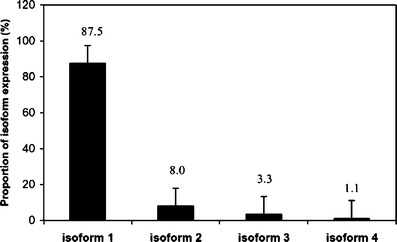
Expression proportion of the four splicing isoforms of GH in human pituitary glands. Reproduced from Zhan and Desiderio [24], with permission from Wiley-VCH, copyright 2005
Prolactin is another important pituitary hormone. Six prolactin isoforms were detected with proteomics [1, 23]. Similar to GH, each prolactin isoform was down-regulated in each cell-type NF adenoma, with a different down-regulated ratio relative to controls. There was no significant expression change of the prolactin gene at the protein and mRNA levels in the prolactinoma relative to controls; that finding is consistent with a prolactinoma’s monoclonal origin. However, the proportion of those six prolactin isoforms changed in NF adenomas and prolactinomas compared to controls.
Other researchers showed that glycosylation is an important prolactin modification [28] that produces different isoforms; glycosylation of human prolactin might down-regulate its hormone bioactivity and promote its metabolic clearance [29]. Other studies showed that the main variant of prolactin was the non-glycosylated form of PRL in human prolactinomas [30]; that finding is consistent with the result that some prolactin isoforms were down-regulated in prolactinomas compared to controls [23]. Thus, it has been speculated that the prolactin isoform in those down-regulated spots was possibly a glycosylated prolactin. Therefore, further detailed study of the different isoforms and PTMs of GH and prolactin could lead to new insights into the clinical importance of pituitary hormones in the formation of an NF adenoma. The ratio of the change of each isoform in a human pituitary tissue has value for clinical research.
Except for protein-expression variation and splicing isoforms, protein PTMs are an important source of proteome variation that is associated with different pathophysiological processes. Also, the degree and the sites of the PTMs could dynamically change with pathophysiological processes.
Oxidative/nitrative stresses are involved in a variety of tumorigenesis mechanisms. DEP analyses [1] demonstrated that many reactive-oxygen species (ROS)-related proteins were changed in human pituitary adenomas, including heat shock protein, cytochrome P450, GST, and phospholipid hydroperoxide glutathione peroxidase (Table 2). An important oxidative stress-related modification—tyrosine nitration—was studied in an NF adenoma [31] and a post-mortem control [32, 33]. 2DGE-based nitrotyrosine Western blot and MS/MS identified eight nitroproteins from a pituitary control (Table 3) [32, 33]. Those control nitroproteins are involved in the transforming growth factor beta 1 (TFGB1) and actin cellular skeleton signaling networks (Fig. 5a), which function in gene expression, cellular development, and connective-tissue development [22]. The nitroproteins in that network include SNAP91, FCAR, actin, PRKG2, STC1, PAQR3, and PSMA2. Nitrotyrosine affinity column (NTAC)-based MS/MS identified nine nitroproteins, and three non-nitrated proteins that interact with nitroproteins, from a NF adenoma [31] (Table 3). Those NF adenoma nitroproteins and their complexes are involved in the tumor necrosis factor (TNF) and interleukin 1 (IL1) signaling networks (Fig. 5b), which function in cancer, cell cycle, and reproductive-system disease [22]. The nitroproteins in that network include ARHGAP5, PRKAR1B, PSMA2, IL1F6, and RHPN2. The non-nitrated proteins that interact with nitroproteins include IRAK2, GRIP2, and ubiquitin. Three nitroprotein-protein complexes were identified: the nitrated proteasome-ubiquitin complex, the nitrated beta-subunit of PKA complex, and the nitrated IL1F6-IL1 receptor-IL1 receptor-associated kinase-like 2 (IL1F6-IL1R-IRAK2) complex. Two pathway networks (Fig. 5 a and b) include a same beta-estradiol signal pathway, which indicates that hormone metabolism involves the control pituitary and pituitary adenoma. This result is consistent with the fact that NO participates in pituitary hormone metabolism in normal physiology, and that a tumor interferes with hormone metabolism. Based on the documented functions of those identified proteins, each nitroprotein and nitroprotein-protein complex was rationalized into the corresponding functional system (Fig. 6) [31]. The nitrated CENTβ1 and the nitrated PKAR1β are involved in the cAMP-dependent protein-kinase signal pathway. The nitrated RHOGAP5 and the nitrated rhophilin 2 are involved in the GTPase signal pathway. IRAK-2 in the IL1-R complex and the nitrated IL1-F6 are involved in the cytokine system. The nitrated ZFP432 is involved in transcription regulatory systems. The nitrated S1P lyase 1 participates in sphingolipid metabolism to regulate cell proliferation, survival, and cell death [34] as well as the immune system [35, 36]. The nitrated LIRA4 might be involved in the immune system. The nitrated proteasome-ubiquitin complex is an important enzymatic complex that is involved in the intracellular nonlysosomal proteolytic pathway [37, 38]. These data demonstrate that those nitroproteins and nitroprotein-protein complexes might participate in several different and very important functional pathways in human pituitary tumor cells.
Table 3.
Nitroproteins and non-nitrated proteins identified in a pituitary adenoma [31], and control tissue [32, 33]
| Pituitary adenoma | Pituitary control | ||
|---|---|---|---|
| Protein name | nY site | Protein name | nY site |
| Nitrated protein: | Nitrated protein: | ||
| Rho-GTPase-activating 5 [Q13017] (ARHGAP5) | Y550 | Synaptosomal-associated protein (SNAP91) | Y237 |
| Leukocyte immunoglobulin-like receptor A4 [P59901] | Y404 | Ig alpha Fc receptor [P24071] (FCAR) | Y223 |
| Zinc finger protein 432 [O94892] | Y41 | Actin [P03996] (ACTA2, ACTG2, ACTC1) | Y296 |
| PKA beta regulatory subunit [P31321] (PRKAR1B) | Y20 | PKG 2 [Q13237] (PRKG2) | Y354 |
| Sphingosine-1-phosphate lyase 1 [O95470] | Y356, Y366 | Mitochondrial co-chaperone protein HscB [Q8IWL3] | Y128 |
| Centaurin beta 1 [Q15027] | Y485 | Stanniocalcin 1[P52823] (STC1) | Y159 |
| Proteasome subunit alpha type 2 [P25787] (PSMA2) | Y228 | Proteasome subunit alpha type 2 (PSMA2) | Y228 |
| Interleukin 1 family member 6 [Q9UHA7] (IL1F6) | Y96 | Progestin and adipoQ receptor family member III [Q6TCH7] (PAQR3) | Y33 |
| Rhophilin 2 [Q8IUC4] (RHPN2) | Y258 | ||
| Nitroprotein-interacting protein | |||
| Interleukin-1 receptor-associated kinase-like 2 (IRAK-2) [O43187] (IRAK2) | |||
| Glutamate receptor interacting protein 2 [Q9C0E4] (GRIP2) | |||
| Ubiquitin [P62988] (UBB or UBC) | |||
Fig. 5.
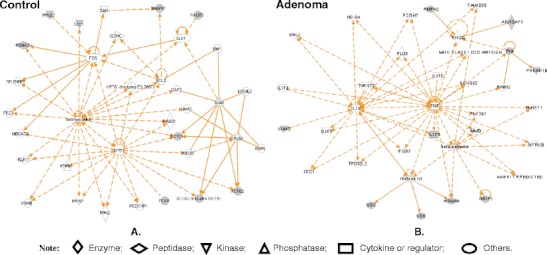
Significant signaling pathway networks that are involved in human pituitary adenoma nitroproteomic data. Network A derives from control nitroproteomic data, and functions in gene expression, cellular development, and connective-tissue development and function. A gray node denotes an identified nitroprotein. Network B derives from adenoma nitroproteomic data, and functions in cancer, cell cycle, and reproductive-system disease. A gray node denotes an identified nitroprotein, or a protein that interacts with nitroproteins. An orange solid-edge denotes a direct relationship between two nodes (molecules: proteins; genes). An orange nonsolid-edge denotes an indirect relationship between two nodes (molecules: proteins; genes). The various shapes of nodes denote the different functions. A curved line means intracellular translocation; a curved arrow means extracellular translocation. Reproduced from Zhan and Desiderio [22], with permission from BioMed Central open access journal; copyright remains with the authors
Fig. 6.
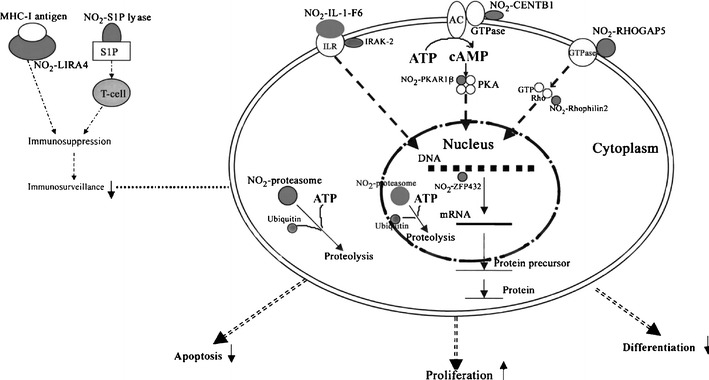
Experimental data-based model of nitroproteins and their functions in human nonfunctional pituitary adenomas. NO2−, nitroprotein. Reproduced from Zhan and Desiderio [31], with permission from Elsevier, copyright 2006
Four pathway-network systems, including mitochondrial dysfunction, oxidative stress, cell-cycle dysregulation, and MAPK-signal abnormality for the NF adenoma, were generated from those DEP and nitroprotein data [22]. Those four pathway-network systems have been described in detail [22]. (i) Mitochondrial dysfunctions underlie a broad spectrum of human diseases [39, 40] that includes cancer [41, 42], neurodegenerative diseases [43], cardiovascular diseases [44], diabetes mellitus [45], and inflammatory diseases [46, 47]. Notable differences in the structure and function of mitochondria appear between cancer and normal cells [41, 42]. Mitochondrial dysfunctions have been proposed as a cause of cancer [48], are a biomarker for the early detection of cancer, and are a therapeutic target for cancer. Figure 7 shows the canonical pathway of mitochondrial dysfunctions [22]. Mitochondrial dysfunction could be confirmed with a mitochondrial morphological change and the increased number of mitochondria in a human pituitary tumor [49–52]. Mitochondria are emerging as biomarker targets for the early detection of, and for novel therapeutic targets in, cancer [48, 53–56]. (ii) Oxidative stress occurs when the balance is disturbed between an upload of free-radical/reactive oxygen/nitrogen species (ROS/RNS) from in vivo formation and from in vitro environmental carcinogens, and the capability of endogenous antioxidant defense mechanisms to remove those reactive species [57, 58]. Many studies have indicated that ROS and RNS are involved in pituitary adenoma pathology [59–61]. A nitroproteomics study [31] discovered nine tyrosine-nitrated proteins in human pituitary adenoma tissues, and each tyrosine nitration site is located within an important protein domain to alter protein functions. However, with the formation of ROS and RNS, the in vivo antioxidative mechanism is also initiated against ROS/RNS [62]. Pivotal to the antioxidant response is the transcription factor Nrf2 (nuclear factor-E2-related factor-2). DEP and nitroproteomic data clearly reveal that the Nrf2-mediated oxidative-stress response pathway system (Fig. 8) is involved in an NF pituitary adenoma. Any decrease in the capability of this antioxidant protective system could increase the susceptibility to oxidative stress, tumor inflammation, carcinogen toxicity, and tumorigenesis. Therefore, the oxidative stress-antioxidative stress-response system could be the novel target to develop effective therapeutic agents that could be used for human pituitary adenomas [63, 64]. (iii) Cell-cycle dysregulation is involved in an NF pituitary adenoma. The basic biological characteristics of tumor cells are the unrestricted proliferation and growth that are controlled by the dysregulated cell-cycle. The cell cycle is regulated by a cyclically operating biochemical system that includes cyclins, cyclin-dependent kinases (CDK), and their inhibitors (CDKI) [65]. Studies have demonstrated that the ectopic expression of cyclin D and the overexpresion of Cyclins A, B, and E occur in an NF pituitary adenoma to regulate different phases of the cell cycle, and to accelerate the progression of the cell-cycle [65]. The details on cell-cycle dysregulation in a human pituitary adenoma have been reviewed [66–69]. The pathway analysis of NF pituitary adenoma nitroproteomic data and DEP data clearly revealed the cell-cycle G2/M DNA damage checkpoint-regulation pathway (Fig. 9) in NF adenomas. The important cell-cycle regulator 14-3-3 protein was down-regulated (44-fold) in NF adenomas compared to controls (Table 2). Moreover, nitroproteomic data demonstrate that a nitrated proteasome could interfere with the functions of the ubiquitin-proteasome system in the regulation of the cell cycle. The proteasome inhibitors can induce apoptosis in GH-and prolactin-secreting rat pituitary tumor cells through a blocking of the cell cycle at the G2/M transition [70]. (iv) MAPK-signaling abnormality operates in an NF pituitary adenoma. MAPK-signaling pathways link the extracelluar signal stimuli to functional cellular processes such as growth, proliferation, migration, and apoptosis. The basic MAPK pathway is stimulus (mitogens, growth factors, cytokines, stress, etc.) ➔ G-protein (Ras, Rac, Cdc42, Rho) ➔ MAPKKK (Raf, Tpl2, MEKK, MLK, TAK, ASK, TAO) ➔ MAPKK (MEK) ➔ MAPK (ERK, JNK, P38) to generate responses (proliferation, differentiation, apoptosis, and migration). ERKs (extracellular signal-regulated kinases), JNKs (c-Jun N-terminal kinases), and p38-MAPKs are the three main subfamilies of MAPKs. The details of MAPK-signaling pathways in cancer have been reviewed [71–73]. The MAPK pathways are emerging as potential therapeutic targets for cancer [74, 75], and the development of inhibitors of MAPK pathways has a growing importance in cancer therapy. The pathway analyses of NF adenoma proteomic data clearly demonstrate that MAPK-signaling pathways are involved in pituitary tumorigenesis. DEP proteomic data show that Ras, ERK, JNK, p38-MAPK, Akt, TNF, TGFb1, MAPK, and NFkB are the key nodes in their pathway networks, and that ERK/MAPK signaling (Fig. 10) is the significant canonical pathway in adenomas. The nitroproteomic data of NF adenomas show that TNF and IL1B are the key nodes in their pathway networks, and that p38-MAPK signaling (Fig. 11) is the significant canonical pathway that participates in an oxidative-stress response in an adenoma. Moreover, the PKA type I beta regulatory subunit is nitrated in human pituitary adenomas (Fig. 6; Table 3), and tyrosine nitration occurs within the dimerization region [31]; those nitrations could interfere with dimerization and affect PKA activity to suppress Raf activity. Recent studies demonstrate that an overexpression of B-Raf mRNA and protein is a feature of NF adenomas; that overactivity highlights an overactivity of the Ras-B-Raf-MAP kinase pathway to promote pituitary tumorigenesis [76], and that the low levels of Raf kinase inhibitory protein (RKIP) in a GH-pituitary adenoma correlate with a poor clinical response to somatostatin analog therapy because RKIP can bind to and inhibit Raf1 kinase to attenuate MAPK signaling [77].
Fig. 7.
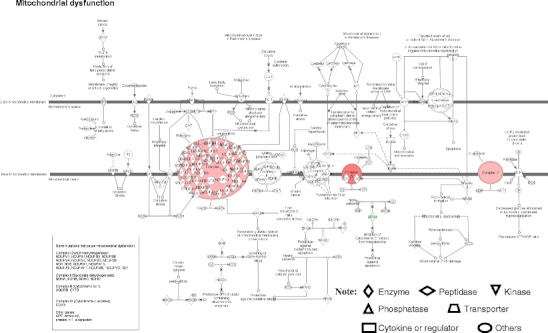
Mitochondrial dysfunctional pathway network. Red label = upregulated, green label = downregulated. The various shapes of nodes denote the different functions. A duplicated shape means this node contains multiple components. An arrow denotes the pathway direction. A line with a small circle denotes a biological result. Reproduced from Zhan and Desiderio [22], with permission from BioMed Central open access journal; copyright remains with the authors
Fig. 8.
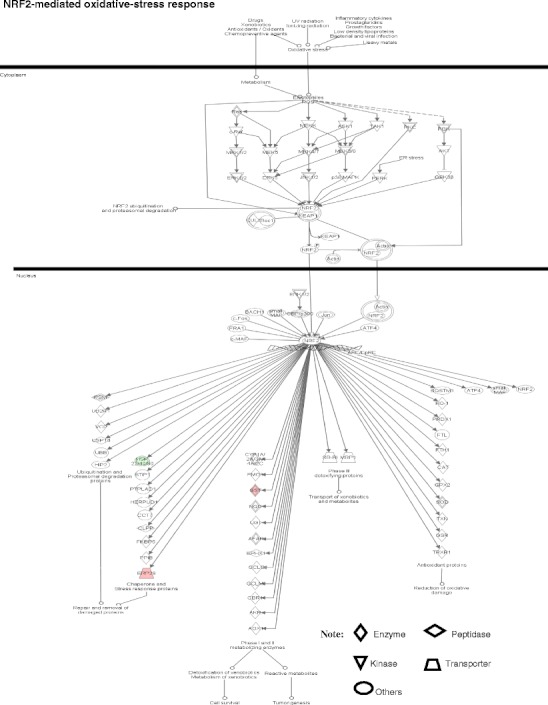
NRF2-mediated oxidative-stress response pathway. Red label = upregulated, green label = down regulated. The various shapes of nodes denote the different functions. A duplicated shape means this node contains multiple components. An arrow denotes the pathway direction. A line with a small circle denotes a biological result. Reproduced from Zhan and Desiderio [22], with permission from BioMed Central open access journal, copyright remains with the authors
Fig. 9.
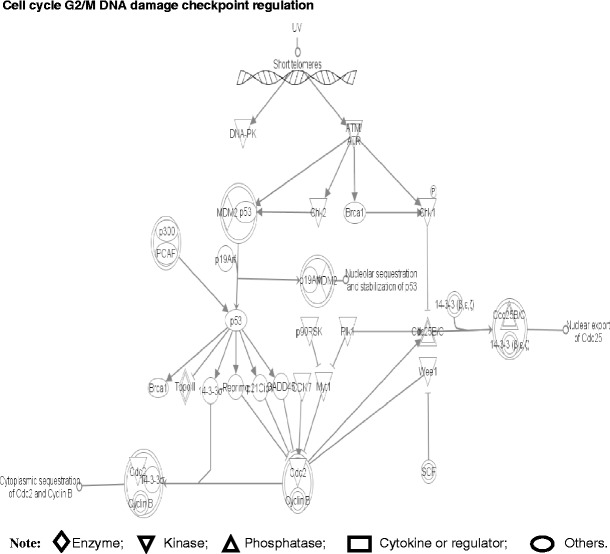
Pathway component for cell cycle G2/M DNA damage checkpoint regulation. The various shapes of nodes denote the different functions. A duplicated shape means this node contains multiple components. An arrow denotes the pathway direction. A line with a small circle denotes a biological result. Reproduced from Zhan and Desiderio [22], with permission from BioMed Central open access journal; copyright remains with the authors
Fig. 10.
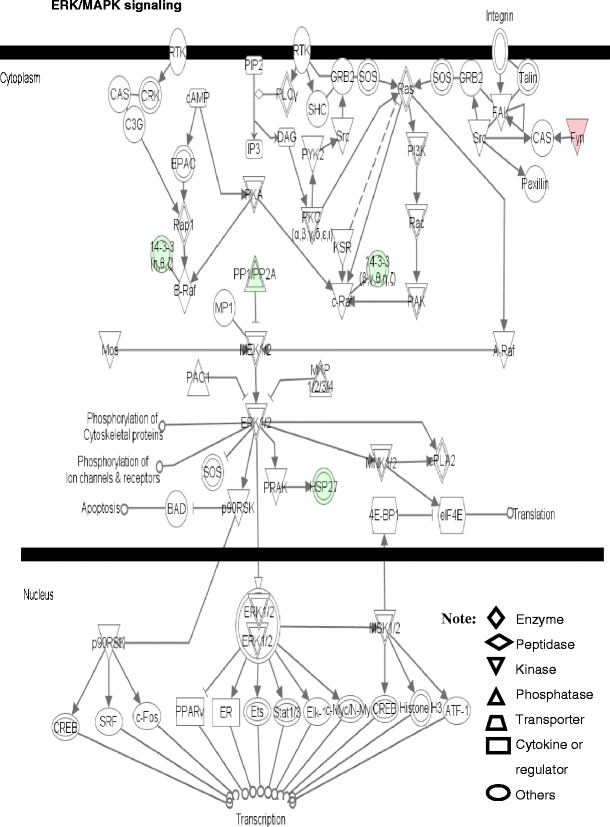
ERK/MAPK signaling pathway. Red label = upregulated, green label = downregulated. The various shapes of nodes denote the different functions. A duplicated shape means this node contains multiple components. An arrow denotes the pathway direction. A line with a small circle denotes a biological result. Reproduced from Zhan and Desiderio [22], with permission from BioMed Central open access journal; copyright remains with the authors
Fig. 11.
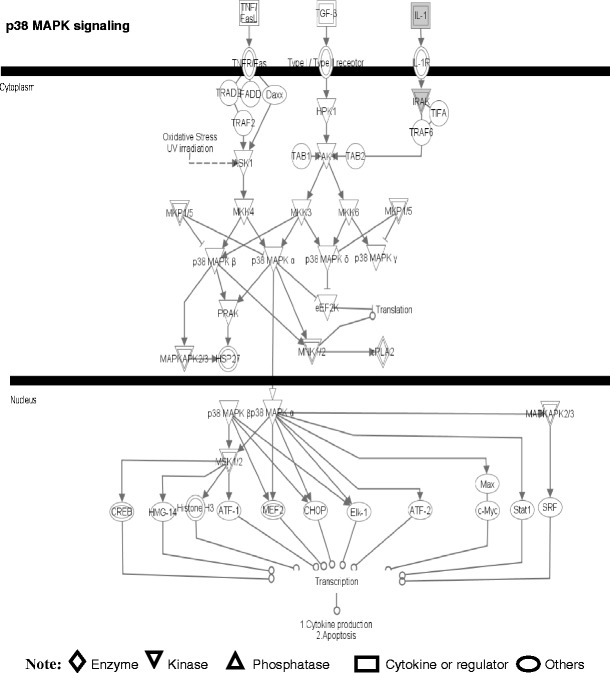
The p38 MAPK signaling pathway. A gray label denotes an identified protein. The various shapes of nodes denote the different functions. A duplicated shape means this node contains multiple components. An arrow denotes the pathway direction. A line with a small circle denotes a biological result. Reproduced from Zhan and Desiderio [22], with permission from BioMed Central open access journal; copyright remains with the authors
Those NF pituitary adenoma-related tissue proteome data demonstrate clearly that crucial elements in the proteome-network system occur as variations in the NF adenoma pathology, offer systematic concept to treat NF pituitary adenoma patients, and could improve patient healthcare. From a prospective viewpoint, those altered crucial elements in the NF pituitary adenoma tissue proteomic network system could have three main uses: (i) The accurate molecular classification of NF pituitary adenoma, which is necessary for an NF pituitary adenoma, because an NF pituitary adenoma is highly heterogeneous (Table 1). (ii) Interventional prevention of NF pituitary adenomas, which will be an important strategy to eliminate NF adenoma in the pre-clinical stage for population healthcare. Tissue quantitative and comparative proteomics can identify the crucial protein elements unique to an NF pituitary adenoma in the proteome-network systems. From those crucial protein elements, an accurate pharmacological intervention could be developed. The high-risk population that will be identified with body fluid (serum; CSF) biomarkers will benefit from those drugs to recover their proteome to the normal status, and to eliminate NF pituitary adenomas at the pre-clinical stage, which will significantly benefit the pituitary adenoma populations and reduce social economical load. (iii) Personalized proteomic therapy for an NF pituitary adenoma patient. The proteome differs among different type of NF pituitary adenomas, and dynamically alters with disease pathophysiological processes. With the development of proteomic techniques, computation biology, and system biology, the complete proteomic databases unique to each cell-type of NF pituitary adenomas, and different pathophysiological stages, will be accurately established. The individualized unique proteomic elements will be determined for each patient. Toward those personalized proteomic elements, one could apply protein-engineering techniques to correct for those altered proteomic elements to the normal status in the proteome-network system in order to realize personalized patient treatment and to halt disease progression, which will provide a highly efficacious therapy, and will reduce the patient costs compared to traditional therapy strategy.
Body-fluid proteomic and peptidomic variations that potentially will contribute to the predictive diagnosis and the measurement of interventional prevention and therapy response
CSF and blood serum are two important body fluids that are used for pituitary adenoma studies. CSF around the brain and spinal cord contains peptides (several hundred) and proteins (about 1000) that are important for brain physiology [78], and is an excellent source of peptides and proteins that are secreted during brain-tumor development, and also potentially relevant to brain pathology. Serum is another important biological fluid that is an excellent source of peptides and proteins that are metabolized during pituitary-tumor pathological processes. Serum proteomes and peptidomes contain resident hemostatic proteins, immunoglobulins, cytokines, hormones, secreted proteins, exogenous proteins, peptides; infection indictors; and also tissue-leakage proteins such as those released from damaged or dying cells [79]. Therefore, blood serum contains accurate molecular information on the physiological state of all tissues/organs in the body, and changes with disease status. Monitoring the changes in the peptide and protein composition of an NF pituitary adenoma patient’s CSF and serum can be used as a sensitive and accurate molecular indicator of tumor pathology. Also, CSF and blood specimens are easily accessible from patients and controls, with minimal invasion. Moreover, CSF and blood specimens that are from different pathological stages can be obtained at different time-points. Therefore, CSF and blood serum/plasma are excellent targets to develop early-stage diagnostic markers, and to develop the assessment indices to measure the interventional prevention and therapy response for NF pituitary adenomas.
We state here an important paradigm shift: in the future, multiple-parameter pattern-diagnostic markers and assessment indices of prevention and therapy response will replace the single-parameter biomarker for the prediction, prevention, and personalized treatment of NF pituitary adenomas. The reason for that paradigm shift is that a traditional single-molecule biomarker is based on an unrealistic assumption that an increase in the amount of a single compound can unambiguously specify a disease. However, the reality is that NF pituitary adenomas are characterized by a heterogeneity among patients; pituitary adenomas are initiated by numerous factors, and cause a range of different molecular changes. For example, a significant elevation of blood GH and prolactin has been useful to predict and diagnose acromegaly and prolatinoma, respectively. However, a large number of acromegaly and prolactinoma patients are still detected at an advanced stage. For the NF pituitary adenomas, no blood hormone levels are elevated, almost all NF pituitary adenomas are diagnosed at a late stage, and no molecular indices measure the therapy response and prognosis. Multiple-parameter biomarkers from serum or CSF will resolve these problems in the prediction, prevention, and personalized treatment assessment of an NF pituitary adenoma.
Several promising multiparameter strategies from serum or CSF proteomes and peptidomes might meet those requirements, and include protein/peptide pattern diagnostics, protein microarrays, and an antibody microarray.
Serum/CSF protein/peptide pattern diagnostics
This diagnostic is an MS-based technique; namely, use the pattern variation of MS peaks to diagnose disease. The concept behind pattern diagnostics is that the CSF/blood serum proteome/peptidome reflects the pituitary tumor tissue and organ pathology that cause patterns of body-fluid protein/peptide changes that have diagnostic potential without even knowing the identities of the individual proteins/peptides [79]. MS can be used to detect that pattern of peaks that correspond to the intact proteins or peptides, and that peak pattern can be used to discriminate among different stages of tumor from controls. The prediction diagnosis and prognostic monitoring becomes the comparison of the pattern or “signature” of the proteins or peptides. A serum-protein pattern has been used to predict and assess laryngeal squamous cell carcinoma [80] and ovarian cancer [81]. Surface-enhanced laser desorption/ionization time-of-flight mass spectrometry (SELDI-TOF-MS) has been used in this protein-pattern recognition [80, 81]. Serum or CSF samples from tumor and controls were individually applied to a SELDI chip. The retained proteins on the chip were subsequently ionized (MALDI) and detected with TOF-MS. Corresponding bioinformatics software was used to compare the MS spectra and to determine the differential pattern of peaks to discriminate tumors from controls. This approach has been used to identify a “signature” protein pattern within a “training set” of SELDI-TOF MS spectra that contained 50 female ovarian cancer sera and 50 female control sera [81]. The identified “signature” protein pattern was used to identify ovarian cancer in individuals within a new independent “validation set” that contained 50 female ovarian cancer sera and 66 female control sera, with a positive predictive value of 94%, sensitivity of 100%, and specificity of 95% [81].
However, even though SELDI-TOF MS was the most commonly used instrument for this protein-pattern recognition, some problems remain to be resolved for the SELDI method: (i) What is the total amount (moles) of ionizable groups (positive, negative) due to Lys, Arg, Asp, Glu, etc. in the biological samples? (ii) What is the total number (moles) of ionizable groups on the SELDI sample probe surface? (iii) What is the ratio of (i)/(ii) in the SELDI experiments? (iv) Does the sample exceed, and/or chemically modify, the chromatography capability of the SELDI probe surface? (v) SELDI does not allow a direct identification of the discriminatory proteins and suffers from low reproducibility, sensitivity, and accuracy [82–86]. To overcome some of those problems, Dekker et al. used MALDI-TOF-MS to replace SELDI-TOF-MS; the body-fluid samples were first digested with trypsin, and the tryptic peptide mixtures were analyzed with MALDI-TOF-MS to obtain the tryptic-peptide profile for each sample to diagnose leptomeningeal metastases in breast cancer patients with an accuracy of 77%, a sensitivity of 79%, and a specificity of 76% [82, 87].
Thempst et al. developed a signature serum-peptide pattern to predict metastatic thyroid carcinomas [88, 89]. The plasma peptides were isolated with magnetic beads, and were analyzed with a MALDI-MS scan to obtain MS spectra. The pattern of peaks that corresponded to the serum peptides were identified in a “training setting”; subsequently, the serum-peptide pattern was used to discriminate the tumors from controls in an independent “validating setting”. This serum-peptidome pattern was used to distinguish metastatic thyroid carcinomas from cancer-free controls with 95% sensitivity and 95% specificity (binomial confidence intervals, 75.1–99.9%) [89]. CSF protein pattern and peptide patterns are also under development to diagnose CNS system disease with a similar strategy [78, 82]. Amino acid sequence data are needed in those studies.
The serum/CSF protein/peptide pattern-recognition approach is emerging as a promising method for cancer prediction and diagnosis, and also offers the promise to measure the interventional prevention and therapeutic response. However, one should clearly realize that the standardized common serum/CSF-sample handing procedure [90] and the large-scale samples analyzed [79] are essential, and that this pattern-recognition method would have more potential in combination with other genetic factor analysis [79], and with amino acid sequence data.
Protein/antibody microarray
This technique is derived from DNA-microarray technologies without the use of MS to detect any proteomic variation. It is another promising approach for prediction diagnosis and for the measurement of interventional prevention and therapeutic response. Briefly, a protein microarray immobilizes thousands of protein-detecting features on a microchip. This microchip is incubated with a biological sample to detect any proteomic pattern variation in the disease relative to controls. The common protein array refers to an antibody array that hosts different antibodies such as monoclonal, polyclonal, and antibody fragments to detect their respective antigens from human blood samples. An example is the cytokine-antibody array to detect inflammation-related disease [91]. Another type of protein microarray is to directly immobilize multiple functional proteins onto a microchip to detect protein-protein, protein-ligand, enzyme-substance, protein-DNA interactions, and PTMs, which is also called a “functional protein array” [92–94]. An example is the whole-proteome array from yeast that contains 5,000 purified proteins immobilized onto a glass microscope slide [95]. With the prospective to identify the serum/CSF protein/peptide patterns of NF pituitary adenoma, those signature protein/peptides or their antibodies could be immobilized onto a microchip for the predictive diagnosis and the measurement of preventive and therapeutic response for NF pituitary adenoma patients.
Conclusions
The traditional assessment of the level of one serum-hormone is difficult to detect clinical NF pituitary adenomas; furthermore, no effective chemical therapy exists to treat an NF pituitary adenoma. An NF pituitary adenoma contains highly heterogeneous cell types that are the distinguishing pathophysiological basis that causes the proteomic variation. In combination with multiple endogenous and exogenous factors, that proteome variation is the basis for personalized patient treatment. A more accurate multiple-parameter global systematic strategy will replace the limited single-factor strategy in the prediction, prevention, and personalized treatment of NF pituitary adenomas. The global-proteomic strategy offers the promise for the multiple-parameter assessment for the predictive diagnosis, measurement of preventive and therapeutic response, and personalized patient treatment. The diagram of the use of proteomic variations to predict, prevent, and personalize treatment of NF adenomas is shown (Fig. 12). A tissue proteomic-variation study would lead to the accurate molecular classification of an NF adenoma, and the modality of proteomic variation for interventional prevention and halting the tumor progression. The serum/CSF proteomic/peptidomic variation would lead to serum/CSF protein/peptide pattern diagnostics, and the protein/antibody microarray for the predictive diagnosis and measurement of interventional prevention and personalized therapeutic response. Briefly, a tumor-tissue proteomic-variation study would lead to an accurate molecular classification that will contribute to identification of personalized patients. Modalities of the altered tissue-proteome of a personalized patient will realize the personalized treatment of NF pituitary adenomas. This therapeutic response will be assessed with body-fluid (serum and/or CSF) proteomic/peptidomic variations to determine whether tumor progression is inhibited or halted. The high-risk population that might develop an NF pituitary adenoma will be determined with a predictive diagnosis strategy—body-fluid (serum and/or CSF) proteomic/peptidomic variations. Modalities of the altered tissue-proteome of the high-risk population will realize the interventional prevention. This preventive response will be assessed with body-fluid (serum and/or CSF) proteomic/peptidomic variations to determine the preventive effects and whether tumor occurrence is halted. In summary, any proteomic variation is tightly associated with NF pituitary adenoma progression. The detection and modalities of proteomic variation will serve an effective role in the prediction, prevention, and personalized treatment of NF pituitary adenoma patients.
Fig. 12.
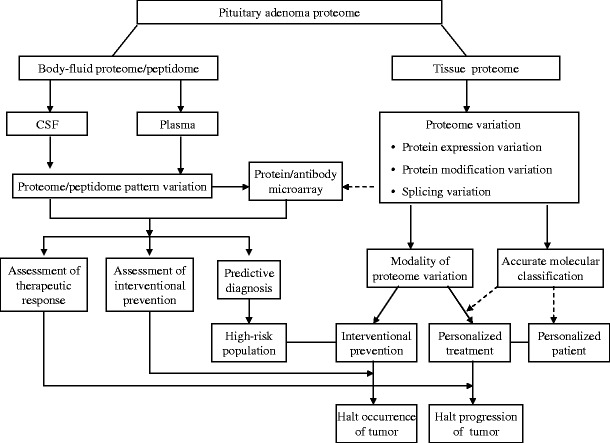
Diagram of the use of proteomic variations to predict, prevent, and personalize treatment for NF pituitary adenomas
Proteomic variations offer numerous opportunities to predict, prevent, and provide a personalized treatment (PPPM) for NF pituitary adenomas. Currently, whole tissue-proteome variations (protein expression; hormone isoforms; modifications) are studied in NF pituitary adenomas, and the significant signal pathway networks associated with NF pituitary adenomas are mined from those whole tissue-proteome variation data. Four important pathway-network systems, including mitochondrial dysfunction, oxidative stress, cell-cycle dysregulation, and MAPK-signal abnormality, for the NF adenoma are identified. The follow-up studies of those tissue proteome data would contribute to the accurate molecular classification for the diagnosis of personalized patients and their personalized treatment. However, some problems remain to be resolved towards that PPPM goal: (i) the complete tissue-proteomic databases unique to single-cell type pituitary adenomas, and different pathophysiological stages, must be accurately established towards the development of individualized unique proteomic elements for each patient. Recently, laser-captured single-cell type pituitary prolactinoma cells have been used for proteomics analysis [96]. (ii) The complete body-fluid (serum; CSF) proteomic/peptidomic databases unique to single-cell type pituitary adenomas, and different pathophysiological stages, must be accurately established. For body-fluid proteomic/peptidomic databases, a large-scale of normal population is needed towards the development of the predictive diagnostic pattern. (iii) The novel techniques such as protein-engineering techniques must be developed to correct for those altered personalized proteomic elements to the normal status in the proteome-network system towards an interventional prevention in the high-risk population and for the personalized treatment of NF pituitary adenomas. (iv) The comprehensive computation model system needs to be developed to integrate all proteomic data, personal data, clinical data, and other genetic data towards the facile and accurate predictive diagnosis of the high-risk population and an accurate assessment of preventive and therapeutic responses.
Acknowledgements
The authors acknowledge the financial support from NIH (RR016679 to DMD), Shainberg Neuroscience Foundation (XZ), and William Webster Endowment Fund (XZ).
Glossary
- ACTH
adrenocorticotropic hormone
- CDK
cyclin-dependent kinase
- CDKI
cyclin-dependent kinase inhibitor
- CSF
cerebrospinal fluid
- DEP
differentially expressed protein
- 2D DIGE
two-dimensional differential in-gel electrophoresis
- 2DGE
two-dimensional gel electrophoresis
- ERK
extracellular signal-regulated kinase
- ESI
electrospray ionization
- FSH
follicle-stimulating hormone, or follitropin
- GH
growth hormone
- IL1
interleukin 1
- IPA
Ingenuity Pathway Analysis
- JNK
c-Jun N-terminal kinase
- LCM
laser-capture microdissection
- LH
luteinizing hormone, or lutropin
- MALDI
matrix-assisted laser desorption/ionization
- MAPK
mitogen-activated protein kinase
- MAPKK
MAPK kinase
- MAPKKK
MAPKK kinase
- Mr
relative molecular mass
- MS
mass spectrometry
- MS/MS
tandem mass spectrometry
- MW
molecular weight
- NF
nonfunctional
- Nrf2
nuclear factor E2-related factor-2
- NTAC
nitrotyrosine affinity column
- pI
isoelectric point
- PKA
cyclic AMP-dependent kinase
- PMF
peptide mass fingerprint
- PRL
prolactin
- PTM
post-translational modification
- RKIP
raf kinase inhibitory protein
- RNS
reactive nitrogen species
- ROS
reactive oxygen species
- SELDI
surface-enhanced laser desorption/ionization
- TNF
tumor necrosis factor
- TOF
time-of-flight
- TSH
thyrotropin-stimulating hormone, or thyrotropin
References
- 1.Moreno CS, Evans CO, Zhan X, Okor M, Desiderio DM, Oyesiku NM. Novel molecular signaling in human clinically non-functional pituitary adenomas identified by gene expression profiling and proteomic analyses. Cancer Res. 2005;65:10214–22. doi: 10.1158/0008-5472.CAN-05-0884. [DOI] [PubMed] [Google Scholar]
- 2.Herman V, Fagin J, Gonsky R, Kovacs K, Melmed S. Clonal origin of pituitary adenomas. J Clin Endocrinol Metab. 1990;71:1427–33. doi: 10.1210/jcem-71-6-1427. [DOI] [PubMed] [Google Scholar]
- 3.Alexander JM, Biler BM, Bikkal H, Zervas NT, Arnold A, Klibanski A. Clinically nonfunctioning pituitary tumors are monoclonal in origin. J Clin Invest. 1990;86:336–40. doi: 10.1172/JCI114705. [DOI] [PMC free article] [PubMed] [Google Scholar]
- 4.Melmed S. Mechanisms for pituitary tumorigenesis: the plastic pituitary. J Clin Invest. 2003;112:1603–16018. doi: 10.1172/JCI20401. [DOI] [PMC free article] [PubMed] [Google Scholar]
- 5.Zhan X, Desiderio DM. Comparative proteomics analysis of human pituitary adenomas: current status and future perspectives. Mass Spectrom Rev. 2005;24:783–813. doi: 10.1002/mas.20039. [DOI] [PubMed] [Google Scholar]
- 6.Zhan X, Desiderio DM. Differences in the spatial and quantitative reproducibility between two second-dimension gel electrophoresis systems. Electrophoresis. 2003;24:1834–46. doi: 10.1002/elps.200305389. [DOI] [PubMed] [Google Scholar]
- 7.Zhan X, Desiderio DM. Spot volume versus amount of protein loaded onto a gel. A detailed, statistical comparison of two gel electrophoresis systems. Electrophoresis. 2003;24:1818–33. doi: 10.1002/elps.200305375. [DOI] [PubMed] [Google Scholar]
- 8.Zhan X, Desiderio DM. A reference map of a pituitary adenoma proteome. Proteomics. 2003;3:699–713. doi: 10.1002/pmic.200300408. [DOI] [PubMed] [Google Scholar]
- 9.Unlu M, Morgan ME, Minden JS. Difference gel electrophoresis: a single gel method for detecting changes in protein extracts. Electrophoresis. 1997;18:2071–7. doi: 10.1002/elps.1150181133. [DOI] [PubMed] [Google Scholar]
- 10.Tonge R, Shaw J, Middleton B, Rowlinson E, Currie I, Davison M. Validation and development of fluorescence two-dimensional differential gel electrophoresis proteomics technology. Proteomics. 2001;1:377–96. doi: 10.1002/1615-9861(200103)1:3<377::AID-PROT377>3.0.CO;2-6. [DOI] [PubMed] [Google Scholar]
- 11.Zhou G, Li H, DeCamp D, Chen S, Shu H, Gong Y, et al. 2D differential in-gel electrophoresis for the identification of esophageal scans cell cancer-specific protein markers. Mol Cell Proteomics. 2002;1:117–24. doi: 10.1074/mcp.M100015-MCP200. [DOI] [PubMed] [Google Scholar]
- 12.Wolters DA, Washburn MP, Yates JR., III An automated multidimensional protein identification technology for shotgun proteomics. Anal Chem. 2001;73:5683–90. doi: 10.1021/ac010617e. [DOI] [PubMed] [Google Scholar]
- 13.Aebersold R, Mann M. Mass spectrometry-based proteomics. Nature. 2003;422:198–207. doi: 10.1038/nature01511. [DOI] [PubMed] [Google Scholar]
- 14.MacCoss MJ, McDonald WH, Saraf A, Sadygov R, Clark JM, Tasto JJ, et al. Shotgun identification of protein modifications from protein complexes and lens tissue. Proc Natl Acad Sci USA. 2002;99:7900–5. doi: 10.1073/pnas.122231399. [DOI] [PMC free article] [PubMed] [Google Scholar]
- 15.Regnier FE, Rigs L, Zhang R, Xiong L, Liu P, Chakraborty A, et al. Comparative proteomics based on stable isotope labeling and affinity selection. J Mass Spectrom. 2002;37:133–45. doi: 10.1002/jms.290. [DOI] [PubMed] [Google Scholar]
- 16.Smolka MB, Zhou H, Purkayastha S, Aebersold R. Optimization of the isotope-coded affinity tag-labeling procedure for quantitative proteome analysis. Anal Biochem. 2001;297:25–31. doi: 10.1006/abio.2001.5318. [DOI] [PubMed] [Google Scholar]
- 17.Zhu H, Pan S, Gu S, Bradbury EM, Chen X. Amino acid residue specific stable isotope labeling for quantitative proteomics. Rapid Commun Mass Spectrum. 2002;16:2115–23. doi: 10.1002/rcm.831. [DOI] [PubMed] [Google Scholar]
- 18.Gu S, Pan S, Bradbury EM, Chen X. Precise peptide sequencing and protein identification in the human proteome through in vivo lysine-specific mass tagging. J Am Soc Mass Spectrom. 2003;14:1–7. doi: 10.1016/S1044-0305(02)00799-7. [DOI] [PubMed] [Google Scholar]
- 19.Casado-Vela J, Martinez-Esteso MJ, Rodriguez E, Borras E, Elortza F, Bru-Martinez R. iTRAQ-based quantitative analysis of protein mixtures with large fold change and dynamic range. Proteomics. 2010;10:343–7. doi: 10.1002/pmic.200900509. [DOI] [PubMed] [Google Scholar]
- 20.Griffin TJ, Xie H, Bandhakavi S, Popko J, Mohan A, Carlis JV, et al. iTRAQ reagent-based quantitative proteomic analysis on a linear ion trap mass spectrometer. J Proteome Res. 2007;6:4200–9. doi: 10.1021/pr070291b. [DOI] [PMC free article] [PubMed] [Google Scholar]
- 21.Pierce A, Unwin RD, Evans CA, Griffiths S, Carney L, Zhang L, et al. Eight-channel iTRAQ enables comparison of the activity of six leukemogenic tyrosine kinases. Mol Cell Proteomics. 2008;7:853–63. doi: 10.1074/mcp.M700251-MCP200. [DOI] [PubMed] [Google Scholar]
- 22.Zhan X, Desiderio DM. Signaling pathway networks mined from human pituitary adenoma proteomics data. BMC Med Genomics. 2010;3:13. doi: 10.1186/1755-8794-3-13. [DOI] [PMC free article] [PubMed] [Google Scholar]
- 23.Evans CO, Moreno CS, Zhan X, McCabe MT, Vertino PM, Desiderio DM, et al. Molecular pathogenesis of human prolactinomas identified by gene expression profiling, RT-qPCR, and proteomic analyses. Pituitary. 2008;11:231–45. doi: 10.1007/s11102-007-0082-2. [DOI] [PubMed] [Google Scholar]
- 24.Zhan X, Giorgianni F, Desiderio DM. The proteomics analysis of growth hormone isoforms in human pituitary. Proteomics. 2005;5:1228–41. doi: 10.1002/pmic.200400987. [DOI] [PubMed] [Google Scholar]
- 25.Boguszewski CL, Johannsson G, Bengtsson BA, Johansson A, Carlsson B, Carlsson LM. Circulating non-22-kilodalton growth hormone isoforms in acromegalic men before and after transsphenoidal surgery. J Clin Endocr Metab. 1997;82:1516–21. doi: 10.1210/jc.82.5.1516. [DOI] [PubMed] [Google Scholar]
- 26.Boguszewski CL, Jansson C, Boguszewski MC, Rosberg S, Carlsson B, Albertsson-Wikland K, et al. Increased proportion of circulating non-22-kilodalton growth hormone isoforms in short children: a possible mechanism for growth failure. J Clin Endocr Metab. 1997;82:2944–9. doi: 10.1210/jc.82.9.2944. [DOI] [PubMed] [Google Scholar]
- 27.Giorgianni F, Beranova-Giorgianni S, Desiderio DM. Identification and characterization of phosphorylated proteins in human pituitary. Proteomics. 2004;4:587–98. doi: 10.1002/pmic.200300584. [DOI] [PubMed] [Google Scholar]
- 28.Gambino GM, Beck-Peccoz P, Borgato S, Faglia G, Spada A, Persani L. Bioactivity and glycosylation of circulating prolactin in various physiological and pathological conditions. Pituitary. 1999;2:225–31. doi: 10.1023/A:1009909513790. [DOI] [PubMed] [Google Scholar]
- 29.Hoffmann T, Penel C, Ronin C. Glycosylation of human prolactin regulates hormone bioactivity and metabolic clearance. J Endocrinol Invest. 1993;16:807–16. doi: 10.1007/BF03348932. [DOI] [PubMed] [Google Scholar]
- 30.Hoffmann T, Gunz G, Brue T, Jaquet P, Ronin C. Prolactin isoforms secreted by human prolactinomas. Horm Res. 1992;38:164–70. doi: 10.1159/000182534. [DOI] [PubMed] [Google Scholar]
- 31.Zhan X, Desiderio DM. Nitroproteins from a human pituitary adenoma tissue discovered with a nitrotyrosine affinity column and tandem mass spectrometry. Anal Biochem. 2006;354:279–89. doi: 10.1016/j.ab.2006.05.024. [DOI] [PubMed] [Google Scholar]
- 32.Zhan X, Desiderio DM. The human pituitary nitroproteome: detection of nitrotyrosyl-proteins with two-dimensional Western blotting, and amino acid sequence determination with mass spectrometry. Biochem Biophys Res Commun. 2004;325:1180–6. doi: 10.1016/j.bbrc.2004.10.169. [DOI] [PubMed] [Google Scholar]
- 33.Zhan X, Desiderio DM. Linear ion-trap mass spectrometric characterization of human pituitary nitrotyrosine-containing proteins. Int J Mass Spectrom. 2007;259:96–104. doi: 10.1016/j.ijms.2006.06.009. [DOI] [Google Scholar]
- 34.Maceykaa M, Payneb SG, Milstienb S, Spiegela S. Sphingosine kinase, sphingosine-1-phosphate, and apoptosis. Biochim Biophys Acta. 2002;1585:193–201. doi: 10.1016/s1388-1981(02)00341-4. [DOI] [PubMed] [Google Scholar]
- 35.Schwab SR, Pereira JP, Matloubian M, Xu Y, Huang Y, Cyster JG. Lymphocyte sequestration through S1P lyase inhibition and disruption of S1P gradients. Science. 2005;309:1735–9. doi: 10.1126/science.1113640. [DOI] [PubMed] [Google Scholar]
- 36.Hla T. Dietary factors and immunological consequences. Science. 2005;309:1682–3. doi: 10.1126/science.1118340. [DOI] [PubMed] [Google Scholar]
- 37.Tamura T, Lee DH, Osaka F, Fujiwara T, Shin S, Chung CH, et al. Molecular cloning and sequence analysis of cDNAs for Wve major subunits of human proteasomes (multi-catalytic proteinase complexes) Biochem Biophys Acta. 1991;1089:95–102. doi: 10.1016/0167-4781(91)90090-9. [DOI] [PubMed] [Google Scholar]
- 38.Kristensen P, Johnsen AH, Uerkvitz W, Tanaka K, Hendil KB. Human proteasome subunits from 2-dimensional gels identified by partial sequencing. Biochem Biophys Res Commun. 1994;205:1785–9. doi: 10.1006/bbrc.1994.2876. [DOI] [PubMed] [Google Scholar]
- 39.Pagliarini DJ, Calvo SE, Chang B, Sheth SA, Vafai SB, Ong SE, et al. A mitochondrial protein compendium elucidates complex I disease biology. Cell. 2008;134:112–23. doi: 10.1016/j.cell.2008.06.016. [DOI] [PMC free article] [PubMed] [Google Scholar]
- 40.Koene S, Smeitink J. Mitochondrial medicine: entering the era of treatment. J Intern Med. 2009;265:193–209. doi: 10.1111/j.1365-2796.2008.02058.x. [DOI] [PubMed] [Google Scholar]
- 41.Modica-Napolitano JS, Singh KK. Mitochondria as targets for detection and treatment of cancer. Expert Rev Mol Med. 2002;4:1–19. doi: 10.1017/S1462399402004453. [DOI] [PubMed] [Google Scholar]
- 42.Modica-Napolitano JS, Singh KK. Mitochondrial dysfunction in cancer. Mitochondrion. 2004;4:755–62. doi: 10.1016/j.mito.2004.07.027. [DOI] [PubMed] [Google Scholar]
- 43.Schapira AH. Mitochondrial dysfunction in neurodegenerative diseases. Neurochem Res. 2008;33:2502–9. doi: 10.1007/s11064-008-9855-x. [DOI] [PubMed] [Google Scholar]
- 44.Ballinger SW. Mitochondrial dysfunction in cardiovascular disease. Free Radic Biol Med. 2005;38:1278–95. doi: 10.1016/j.freeradbiomed.2005.02.014. [DOI] [PubMed] [Google Scholar]
- 45.Anderson CM. Mitochondrial dysfunction in diabetes mellitus. Drug Dev Res. 1999;46:67–79. doi: 10.1002/(SICI)1098-2299(199901)46:1<67::AID-DDR10>3.0.CO;2-V. [DOI] [Google Scholar]
- 46.Rabinovich RA, Bastos R, Ardite E, Llinas L, Orozco-Levi M, Gea J, et al. Mitochondrial dysfunction in COPD patients with low body mass index. Eur Respir J. 2007;29:643–50. doi: 10.1183/09031936.00086306. [DOI] [PubMed] [Google Scholar]
- 47.Mabaliraja U, Dinda AK, Kumar S, Roshan R, Gupta P, Sharma SK, et al. Mitochondrial structural changes and dysfunction are associated with experimental allergic asthma. J Immunol. 2008;181:3540–8. doi: 10.4049/jimmunol.181.5.3540. [DOI] [PubMed] [Google Scholar]
- 48.Halabe Bucay A. The biological significance of cancer: Mitochondria as a cause of cancer and the inhibition of glycolysis with citrate as a cancer treatment. Med Hypotheses. 2007;69:826–8. doi: 10.1016/j.mehy.2007.02.002. [DOI] [PubMed] [Google Scholar]
- 49.Goebel HH, Schulz F, Rama B. Ultrastructurally abnormal mitochondria in the pituitary oncocytoma. Acta Neurochir. 1980;51:195–201. doi: 10.1007/BF01406745. [DOI] [PubMed] [Google Scholar]
- 50.Horoupian DS. Large mitochondria in a pituitary adenoma with hyperprolactinemia. Cancer. 1980;46:537–42. doi: 10.1002/1097-0142(19800801)46:3<537::AID-CNCR2820460319>3.0.CO;2-6. [DOI] [PubMed] [Google Scholar]
- 51.Niroi N, Chrousos GP, Kohn B, Lafferty A, Abu-Asab M, Bonat S, et al. Adrenocortical-pitutiary hybrid tumor causing Cushing’s syndrome. J Clin Endocrinol Metab. 2001;86:2631–7. doi: 10.1210/jc.86.6.2631. [DOI] [PubMed] [Google Scholar]
- 52.Saeger W, Ludecke DK, Buchfelder M, Fahlbusch R, Quabbe HJ, Petersenn S. Pathohistological classification of pituitary tumors: 10 years of experience with the German pituitary tumor registry. Eur J Endocrinol. 2007;156:203–16. doi: 10.1530/eje.1.02326. [DOI] [PubMed] [Google Scholar]
- 53.Garber K. Targeting mitochondria emerges as therapeutic strategy. J Natl Cancer Inst. 2005;97:1800–1. doi: 10.1093/jnci/dji455. [DOI] [PubMed] [Google Scholar]
- 54.Galluzzi L, Larochette N, Zamzami N, Kroemer G. Mitochondria as therapeutic targets for cancer chemotherapy. Oncogene. 2006;25:4812–30. doi: 10.1038/sj.onc.1209598. [DOI] [PubMed] [Google Scholar]
- 55.Modica-Napolitano JS, Kulawiec M, Singh KK. Mitochondria and human cancer. Cur Mol Med. 2007;7:121–31. doi: 10.2174/156652407779940495. [DOI] [PubMed] [Google Scholar]
- 56.Bell EL, Klimova T, Chandel NS. Targeting the mitochondria for cancer therapy: regulation of hypoxia-inducible factor by mitochondria. Antioxid Redox Signal. 2008;10:635–40. doi: 10.1089/ars.2007.1655. [DOI] [PubMed] [Google Scholar]
- 57.Tandon VR, Sharma S, Mahajan A, Bardi GH. Oxidative stress: a novel strategy in cancer treatment. J K Science. 2005;7:1–3. [Google Scholar]
- 58.Toyokuni S. Molecular mechanisms of oxidative stress-induced carcinogenesis: from epidemiology to oxygenomics. IUBMB Life. 2008;60:441–7. doi: 10.1002/iub.61. [DOI] [PubMed] [Google Scholar]
- 59.Pinilla L, Tena-Sempere M, Aguilar E. Nitric oxide stimulates growth hormone secretion in vitro through a calcium—and cyclic guanosine monophosphate-independent mechanism. Horm Res. 1999;51:242–7. doi: 10.1159/000023378. [DOI] [PubMed] [Google Scholar]
- 60.Cuttica CM, Giusti M, Bocca L, Sessarego P, Martini D, Valenti S, et al. Nitric oxide modulates in vivo and in vitro growth hormone release in acromegaly. Neuroendocrinology. 1997;66:426–31. doi: 10.1159/000127268. [DOI] [PubMed] [Google Scholar]
- 61.Bocca L, Valenti S, Cuttica CM, Spaziante R, Giordano G, Giusti M. Nitric oxide biphasically modulates GH secretion in cultured cells of GH-secreting human pituitary adenomas. Minerva Endocrinol. 2000;25:55–9. [PubMed] [Google Scholar]
- 62.Valko M, Rhodes CJ, Moncol J, Izakovic M, Mazur M. Free radicals, metals and antioxidants in oxidative stress-induced cancer. Chem Biol Interact. 2006;160:1–40. doi: 10.1016/j.cbi.2005.12.009. [DOI] [PubMed] [Google Scholar]
- 63.Yates MS, Kensler TW. Chemopreventive promise of targeting the Nrf2 pathway. Drug News Perspect. 2007;20:109–17. doi: 10.1358/dnp.2007.20.2.1083437. [DOI] [PubMed] [Google Scholar]
- 64.Lim JH, Kim KM, Kim SW, Hwang O, Choi HJ. Bromocriptine activates NQO1 via Nrf2-PI3K/Akt signaling: novel cytoprotective mechanism against oxidative damage. Pharmacol Res. 2008;57:325–31. doi: 10.1016/j.phrs.2008.03.004. [DOI] [PubMed] [Google Scholar]
- 65.Turner HE, Nagy ZS, Nullivan N, Esiri MM, Wass JAH. Expression analysis of cyclins in pituitary adenomas and the normal pituitary gland. Clin Endocrinol. 2000;53:337–44. doi: 10.1046/j.1365-2265.2000.01088.x. [DOI] [PubMed] [Google Scholar]
- 66.Musat M, Vax VV, Borboli N, Gueorguiev M, Bonner S, Korbonits M, et al. Cell cycle dysregulation in pituitary oncogenesis. Front Horm Res. 2004;32:34–62. doi: 10.1159/000079037. [DOI] [PubMed] [Google Scholar]
- 67.Saeger W. Proliferation markers and cell cycle inhibitors in pituitary adenomas. Front Horm Res. 2004;32:110–26. doi: 10.1159/000079040. [DOI] [PubMed] [Google Scholar]
- 68.Heaney AP. Pituitary tumour pathogenesis. Br Med Bull. 2006;75–76:81–97. doi: 10.1093/bmb/ldh062. [DOI] [PubMed] [Google Scholar]
- 69.Farrell WE, Clayton RN. Molecular pathogenesis of pituitary tumors. Front Neuroendocrinol. 2000;21:174–98. doi: 10.1006/frne.1999.0195. [DOI] [PubMed] [Google Scholar]
- 70.Yu R, Ren SG, Melmed S. Proteasome inhibitors induce apoptosis in growth hormone—and prolactin-secreting rat pituitary tumor cells. J Endocrinol. 2002;174:379–86. doi: 10.1677/joe.0.1740379. [DOI] [PubMed] [Google Scholar]
- 71.Dhillon AS, Hagan S, Rath O, Kolch W. MAP kinase signaling pathways in cancer. Oncogene. 2007;26:3279–90. doi: 10.1038/sj.onc.1210421. [DOI] [PubMed] [Google Scholar]
- 72.Wada T, Penninger JM. Mitogen-activated protein kinases in apoptosis regulation. Oncogene. 2004;23:2838–49. doi: 10.1038/sj.onc.1207556. [DOI] [PubMed] [Google Scholar]
- 73.Johnson GL, Lpadat R. Mitogen-activated protein kinase pathways mediated by ERK, JNK, and p38 protein kinases. Science. 2002;298:1911–2. doi: 10.1126/science.1072682. [DOI] [PubMed] [Google Scholar]
- 74.English JM, Cobb MH. Pharmcological inhibitors of MAPK pathways. Trends Pharmacol Sci. 2002;23:40–5. doi: 10.1016/S0165-6147(00)01865-4. [DOI] [PubMed] [Google Scholar]
- 75.Olson JM, Hallahan AR. p38 MAP kinase: a convergence point in cancer therapy. Trends Mol Med. 2004;10:125–9. doi: 10.1016/j.molmed.2004.01.007. [DOI] [PubMed] [Google Scholar]
- 76.Ewing I, Pedder-Smith S, Franchi G, Ruscica M, Emery M, Vax V, et al. A mutation and expression analysis of the oncogene BRAF in pituitary adenomas. Clin Endocrinol (Oxf) 2007;66:348–52. doi: 10.1111/j.1365-2265.2006.02735.x. [DOI] [PubMed] [Google Scholar]
- 77.Fougner SL, Bollerslev J, Latif F, Hald JK, Lund T, Ramm-Pettersen J, et al. Low levels of raf kinase inhibitory protein in growth hormone-secreting pituitary adenomas correlate with poor response to octreotide treatment. J Clin Endocrinol Metab. 2008;93:1211–6. doi: 10.1210/jc.2007-2272. [DOI] [PubMed] [Google Scholar]
- 78.Dekker LJ, Burgers PC, Kros JM, Smitt PA, Luider TM. Peptide profiling of cerebrospinal fluid by mass spectrometry. Expert Rev Proteomics. 2006;3:297–309. doi: 10.1586/14789450.3.3.297. [DOI] [PubMed] [Google Scholar]
- 79.Weston AD, Hood L. Systems biology, proteomics, and the future of health care: toward predictive, preventative, and personalized medicine. J Proteome Res. 2004;3:179–96. doi: 10.1021/pr0499693. [DOI] [PubMed] [Google Scholar]
- 80.Cheng L, Zhou L, Tao L, Zhang M, Cui J, Li Y. SELDI-TOF MS profiling of serum for detection of laryngeal squamous cell carcinoma and the progression to lymph node metastasis. J Cancer Res Clin Oncol. 2008;134:769–76. doi: 10.1007/s00432-007-0344-4. [DOI] [PMC free article] [PubMed] [Google Scholar]
- 81.Peticoin EF, Ardekani AM, Hitt BA, Levine PJ, Fusaro VA, Steinberg SM, et al. Use of proteomic patterns in serum to identify ovarian cancer. Lancet. 2002;359:572–7. doi: 10.1016/S0140-6736(02)07746-2. [DOI] [PubMed] [Google Scholar]
- 82.Dekker LJ, Boogerd W, Stockhammer G, Dalebout JC, Siccama I, Zheng P, et al. MALDI-TOF mass spectrometry analysis of cerebrospinal fluid tryptic peptide profiles to diagnose leptomeningeal metastases in patients with breast cancer. Mol Cell Proteomics. 2005;4:1341–9. doi: 10.1074/mcp.M500081-MCP200. [DOI] [PubMed] [Google Scholar]
- 83.Diamandis EP. Point: Proteomic patterns in biological fluids: do they represent the future of cancer diagnostics? Clin Chem. 2003;49:1272–5. doi: 10.1373/49.8.1272. [DOI] [PubMed] [Google Scholar]
- 84.Diamandis EP. Analysis of serum proteomic patterns for early cancer diagnosis: drawing attention to potential problems. J Natl Cancer Inst. 2004;96:353–6. doi: 10.1093/jnci/djh056. [DOI] [PubMed] [Google Scholar]
- 85.Diamandis EP. Mass spectrometry as a diagnostic and a cancer biomarker discovery tool: opportunities and potential limitations. Mol Cell Proteomics. 2004;3:367–78. doi: 10.1074/mcp.R400007-MCP200. [DOI] [PubMed] [Google Scholar]
- 86.Diamandis EP, Merwe DE. Plasma protein profiling by mass spectrometry for cancer diagnosis: opportunities and limitations. Clin Cancer Res. 2005;11:963–5. [PubMed] [Google Scholar]
- 87.Dkker LJ, Dalebout JC, Siccama I, Jenster G, Sillevis-Smitt PA, Luider TM. A new method to analyze matrix-assisted laser desorption/ionization time-of-flight peptide profiling mass spectra. Rapid Commun Mass Spectrom. 2005;19:865–70. doi: 10.1002/rcm.1864. [DOI] [PubMed] [Google Scholar]
- 88.Villanueva J, Philip J, Entenberg D, Chaparro CA, Tanwar MK, Holland EC, et al. Serum peptide profiling by magnetic particle-assisted, automated sample processing and MALDI-TOF mass spectrometry. Anal Chem. 2004;76:1560–70. doi: 10.1021/ac0352171. [DOI] [PubMed] [Google Scholar]
- 89.Villanueva J, Martorella AJ, Lawlor K, Philip J, Fleisher M, Robbins RJ, et al. Serum peptidome patterns that distinguish metastatic thyroid carcinoma from cancer-free controls are unbiased by gender and age. Mol Cell Proteomics. 2006;5:1840–52. doi: 10.1074/mcp.M600229-MCP200. [DOI] [PubMed] [Google Scholar]
- 90.Rosenling T, Slim CL, Christin C, Coulier L, Shi S, Stoop MP, et al. The effect of preanalytical factors on stability of the proteome and selected metabolites in cerebrospinal fluid (CSF) J Proteome Res. 2009;8:5511–22. doi: 10.1021/pr9005876. [DOI] [PubMed] [Google Scholar]
- 91.Kader HA, Tchernev VT, Satyaraj E, Lejnine S, Kotler G, Kingsmore SF, et al. Protein microarray analysis of disease activity in pediatric inflammatory bowel disease demonstrates elevated serum PLGF, IL-7, TGF-beta1, and IL-12p40 levels in Crohn’s disease and ulcerative colitis patients in remission versus active disease. Am J Gastroenterol. 2005;100:414–23. doi: 10.1111/j.1572-0241.2005.40819.x. [DOI] [PMC free article] [PubMed] [Google Scholar]
- 92.Joos T, Bachmann J. Protein microarrays: potentials and limitations. Front Biosci. 2009;14:4376–85. doi: 10.2741/3534. [DOI] [PubMed] [Google Scholar]
- 93.Andresen H, Bier FF. Peptide microarrays for serum antibody diagnostics. Methods Mol Biol. 2009;509:123–34. doi: 10.1007/978-1-59745-372-1_8. [DOI] [PubMed] [Google Scholar]
- 94.Ray S, Mehta G, Srivastava S. Label-free detection techniques for protein microarrays: prospects, merits and challenges. Proteomics. 2010;10:731–48. doi: 10.1002/pmic.200900458. [DOI] [PMC free article] [PubMed] [Google Scholar]
- 95.Zhu H, Bilgin M, Bangham R, Hall D, Casamayor A, Bertone P, et al. Global analysis of protein activities using proteome chips. Science. 2001;293:2101–5. doi: 10.1126/science.1062191. [DOI] [PubMed] [Google Scholar]
- 96.Liu Y, Wu J, Yan G, Hou R, Zhuang D, Chen L, et al. Proteomic analysis of prolactinoma cells by immuno-laser capture microdissection combined with online two-dimensional nano-scale liquid chromatography/mass spectrometry. Proteome Sci. 2010;8:2. doi: 10.1186/1477-5956-8-2. [DOI] [PMC free article] [PubMed] [Google Scholar]