

Abstract
MicroRNAs (miRs) are important regulators of gene expression in normal physiology and disease, and are widely misexpressed in cancer. A number of studies have identified miR-21 as an important promoter of oncogenesis. However, as is true of most miRs, the mechanisms behind the aberrant expression of miR-21 in cancer are poorly understood. Herein, we examine the regulation of miR-21 expression in colorectal cancer (CRC) cells by the oncogenic epidermal growth factor (EGF)/Ras pathway and by Ets transcription factors, modulators of epithelial oncogenesis that are frequently misexpressed in CRC. We show that EGF/Ras efficiently induces the miR-21 primary transcript, but this does not rapidly and simply translate into higher mature miR-21 levels. Rather, induction of mature miR-21 by constitutive activation of this pathway is slow, is associated with only minimal activation of mitogen-activated protein kinase, and may involve stimulation of post-transcriptional processing by mechanisms other than Dicer stabilization. We further identify Ets transcription factors as modifiers of miR-21 expression in CRC. The effects of Ets factors on miR-21 expression are cell context-dependent, and appear to involve both direct and indirect mechanisms. The Ets factor Pea3 emerges from our studies as a consistent repressor of miR-21 transcription. Overall, our studies identify a complex relationship between oncogenic pathways and steady-state miR-21 levels in CRC, and highlight the need for greater understanding of the control of miR expression in cancer and other disease states.
A cascade of mutations in signaling gene products has been strongly associated with the development and progression of colon cancer. In this study, the role of microRNA-21 in the regulation of signaling molecules is explored.
Introduction
MicroRNAs (miRs) are a novel class of cellular bioactive molecules with critical functions in the regulation of gene expression in normal biology and disease (Ghildiyal and Zamore, 2009). miRs are short (20–30 nucleotide) RNA molecules that bind to protein-coding messenger RNA (mRNA) molecules, predominantly in the 3′ untranslated region (Ghildiyal and Zamore, 2009). This binding results in decreased synthesis of the coded protein, by a number of mechanisms including increased mRNA degradation and inhibition of translation (Ghildiyal and Zamore, 2009). In cancer, miRs have been shown to function as potent tumor suppressors or oncogenes, capable of modifying all aspects of tumorigenesis, including tumor cell proliferation/apoptosis, invasion/metastasis, and angiogenesis (Sotiropoulou et al., 2009; Visone and Croce, 2009). Importantly, in addition to their interesting intrinsic biology, miRs represent potentially powerful therapeutic agents and/or targets (Weidhaas et al., 2007; Trang et al., 2008; Wang and Wu, 2009; Kota et al., 2009; Trang et al., 2010).
miR-21 is an established pro-oncogenic miR (“oncomiR”) in a wide variety of cancers. miR-21 is overexpressed in many cancers, including those of breast, prostate, lung, and colon, and it regulates many oncogenic processes, including cell proliferation, apoptosis, and migration/invasion (Krichevsky and Gabriely, 2009; Selcuklu et al., 2009). However, as is true of most miRs, much less is known about the regulation of miR-21 levels in normal and diseased, including cancerous, cells. Like ∼50% of all miRs, miR-21 is transcribed as a dedicated precursor (pri-miR) transcript, with a 5′ cap and a polyA tail, from an RNA Polymerase II driven promoter (Cai et al., 2004; Fujita et al., 2008; Davis and Hata, 2009; Kim et al., 2009; Winter et al., 2009). As occurs with most miRs, this transcript is then processed by the Drosha/DGCR8 microprocessor complex to a miR precursor (pre-miR) and subsequently by the Dicer complex to the mature (miR) form (Davis and Hata, 2009; Kim et al., 2009; Winter et al., 2009). The pri-miR-21 promoter has been partially characterized (Loffler et al., 2007; Fujita et al., 2008; Talotta et al., 2009).
miR-21 has been shown to be overexpressed in colorectal cancer (CRC), in a manner that correlates with disease stage and overall prognosis (Schetter et al., 2008). Given the functional importance of miR-21 overexpression in CRC, we were interested in understanding the mechanisms behind miR-21 overexpression in this cancer type. In the present studies, we focused on the role of Ets transcription factors, epidermal growth factor (EGF) signaling, and oncogenic Ras activity, all previously shown to have important, and often cooperative, roles in CRC biology (Wasylyk et al., 1998b; Jedlicka and Gutierrez-Hartmann, 2008; Jedlicka et al., 2009a; Jedlicka et al., 2009b), and all implicated in the control of miR-21 levels in other systems (Fujita et al., 2008; Seike et al., 2009; Talotta et al., 2009).
Materials and Methods
DNA constructs
The N-terminally HA-tagged expression construct for Erm was the same as previously described (Jedlicka et al., 2009a), except that the pcDNA3.1 expression vector was used. The Ets2 expression construct (pCGN-HA/Ets2) has also previously been described (Jedlicka et al., 2009b). The N-terminally HA-tagged Er81 expression construct was generated by subcloning full-length Er81 cDNA, amplified from a mouse embryonic brain library by reverse transcriptase polymerase chain reaction (RT-PCR), into pTRE-HA (Clontech), and then subcloning of the HA-tagged insert into the pSG5 expression vector (Green et al., 1988). The N-terminally HA-tagged (human) Pea3 expression construct was generated using a similar approach. The Elk1 (pTL-Elk1) and ESE1 (pcDNA3.1-ESX) expression constructs have been previously described (Eckel et al., 2003). The HA-epitope-tagged dominant active V12Ras construct pcDNA3.1-HA/V12Ras was obtained from Addgene. The miR-21 promoter [miPPR-21 (−410 to +38), as previously characterized by Fujita et al. (2008)] was PCR-amplified from HT-29 cell genomic DNA and cloned into the pGL4.12 reporter construct (Promega). PCR primers (with flanking XhoI and HindIII restriction sites in bold) were 5′-GAGAGAGACTCGAGGTATTCTGGGTAAGAAGGAGCTCC -3′ (sense), 5′-GAGAGAGAGAGAGAAAGCTTCCAGCAAAAGAGTTAGTCCTCAGAG -3′ (antisense). Whenever PCR was used in the cloning process, the final products were verified by sequencing.
Cell lines, cell culture, and growth factor stimulation
All cell lines (CaCo2, SW48, Colo320, HCT-15, HCT-116, SW480, SW620, GEO, HT-29, and RKO) were obtained from American type culture collection. For quantification of relative pri-miR-21 and miR-21 expression levels, all cell lines were cultured in parallel in Roswell Park Memorial Institute (RPMI) culture media/10% fetal bovine serum (FBS) and harvested at 50%–70% confluence. For experimental manipulation, CaCo2, HT29, and SW48 cells were cultured in Dulbecco's Modified Eagle's Medium (DMEM)/20% FBS, DMEM/10% FBS, and RPMI/10% FBS, respectively. For growth factor experiments, cells were serum starved for 16 h prior to stimulation. EGF (BD Biosciences), reconstituted in phosphate-buffered saline, was delivered at a final concentration of 100 ng/mL. Transforming growth factor (TGF)-β1 (R&D Systems), reconstituted in 4 mM HCl with 1 mg/mL bovine serum albumin for activation, was delivered at a final concentration of 5 ng/mL.
Transient transfections and luciferase assays
For protein and RNA analyses, cells, grown to 50% confluence on 60 mm culture plates, were transfected with 6 ug of total DNA using the Turbofect reagent (Fermentas), according to the manufacturer's instructions. For luciferase assays, cells were plated in 96-well plates at densities of 30,000 cells (CaCo2) or 50,000 cells (SW48) per well. After 24 h, cells were transiently transfected using the Turbofect reagent (Fermentas), according to the manufacturer's instructions. DNA transfection mixes contained 100 ng of expression plasmid(s), 100 ng miPPR-luc reporter construct, and 10 ng Renilla luciferase as an internal control for transfection efficiency. Total DNA was held constant by addition of appropriate control constructs. Extract preparation and quantification of luciferase activity using the Dual-Luciferase Reporter Assay System (Promega) were performed at 48 h post-transfection, as previously described (Jedlicka et al., 2009b).
Stable, lentiviral-mediated knockdown and overexpression
Lentiviral shRNA constructs targeting human Pea3, and off-target control [shRNA to enhanced green fluorescent protein (EGFP)], were obtained from Open Biosystems. The V12Ras stable expression construct was generated by subcloning HA-tagged V12Ras from pcDNA3.1-HA/V12Ras into the pCDH-CMV-MCS-EF1-Puro lentiviral expression vector (System Biosciences), using standard techniques. Replication-incompetent infectious virus was prepared as previously described (McKinsey et al., 2011). Cells were infected with similar titers of virus and selected with Puromycin (2 μg/ml for SW48 cells and 2.5 μg/mL for HT-29 cells). Following stable selection, cell pools were harvested for protein and RNA.
RNA isolation and quantitative expression analysis
Total RNA isolation was performed using the Trizol reagent (Invitrogen) per manufacturer's instructions. cDNA was synthesized from 1 ug of RNA using the miScript Reverse Transcription Kit (Qiagen). Quantitative PCR was performed using the miScript SYBR GREEN PCR Kit (Qiagen) with U6 as an internal control. For quantification of pri-miR-21 expression, the following primers were used: 5′-TTTTGTTTTGCTTGGGAGGA-3′ (F), 5′-AGCAGACAGTCAGGCAGGAT-3′ (R). For quantification of Drosha, Dicer, and Exportin 5 expression, the following primers were used: Drosha: 5′-GTGCTGTCCATGCACCAGATT-3′(F) and 5′-TGCATAACTCAACTGTGCAGG-3′(R); Dicer: 5′-GTACGACTACCACAAGTACTTC-3′(F) and 5′-ATAGTACACCTGCCAGACTGT-3′(R); Exportin 5: 5′-CATTGGGAAACCCTTGGGA-3′(F) and 5′-GATTCAGGGTTCAAAGATGGTGG-3′ (R).
Protein expression analysis
Whole cell lysate preparation, sodium dodecyl sulfate–polyacrylamide gel electrophoresis (SDS-PAGE), and immunoblotting were performed as previously described (Jedlicka et al., 2009b), except for Dicer immunoblotting that used gradient SDS-PAGE, as described (Klase et al., 2007). Primary antibodies used were anti-HA mouse monoclonal (1:1000; Covance); anti-tubulin mouse monoclonal (1:1000; Calbiochem); anti-ESE1 mouse monoclonal (1:500; Walker DM, et al., Open Cancer J, in press); anti-Pea3 mouse monoclonal (1:100; Santa Cruz); anti-Elk1 rabbit polyclonal (1:500; Santa Cruz); anti-p44/42 mitogen-activated protein kinase (MAPK; Erk1/2) rabbit polyclonal (1:1000; Cell Signaling); anti-phospho-p44/42 MAPK (Erk1/2; Thr202/Tyr204) rabbit polyclonal (1:1000; Cell Signaling); anti-phospho-Akt rabbit monoclonal (1:1000; Cell Signaling); anti-Akt rabbit polyclonal (1:1000; Cell Signaling); and anti-Dicer mouse monoclonal (1:1000; AbCam). Secondary antibodies used were horseradish peroxidase-conjugated goat anti-mouse IgG (1:5000; Bio-Rad) and goat anti-rabbit IgG (1:5000; Bio-Rad). Detection was performed using the Western Lightning Plus-ECL Enhanced Chemiluminescence Substrate system (Perkin Elmer).
Results
Expression studies indicate transcriptional and post-transcriptional control of miR-21 levels in CRC cells
To begin to understand the mechanisms underlying the regulation of miR-21 expression in CRC, we began by examining miR-21 levels across a diverse panel of CRC cell lines (Fig. 1). To minimize any effect of culture conditions on global miR levels (Hwang et al., 2009), all cell lines were cultured in the same media and harvested at similar cell density. We observed substantial variation in miR-21 levels across the cell line panel (Fig. 1A). miR expression is regulated at multiple levels, including transcription and processing. To determine the relative contribution of these processes to the control of miR-21 levels in CRC cells, we measured relative levels of the primary transcript (pri-miR-21). As was the case for the mature miR-21 form, there was substantial variation in pri-miR-21 levels. The variation in pri-miR-21 levels trended in a pattern similar to the variation in the levels of the mature miR form, suggesting that transcriptional regulation importantly contributes to the control of mature miR-21 levels in CRC cells. The relative ratio of miR-21 to pri-miR-21 levels did show variation (Fig. 1C), indicating that processing also contributes to the control of miR-21 levels in CRC cells. To determine the extent to which some of the core components of miR processing/maturation contribute to this control, we measured the expression levels of Drosha, a component of the core microprocessor complex that converts pri-miRs into pre-miRs, Dicer, the enzyme responsible for pre-miR to miR conversion, and Exportin 5, the chief miR nuclear-cytoplasmic transporter (Fig. 1D). We observed an overall similar trend between the expression levels of Drosha, Dicer, and Exportin 5 and the miR-21/pri-miR-21 ratio, suggesting that expression levels of the core miR processing/maturation machinery in part determine the efficiency of conversion of pri-miR-21 to miR-21 form in different CRC cell lines.
FIG. 1.

microRNA-21 (miR-21) expression in colorectal cancer cell lines. The indicated cell lines were all grown in the same media (RPMI/10% fetal calf serum), and harvested at similar confluence. Expression levels of the mature miR-21 form (A) and the pri-miR precursor (B) were determined using quantitative reverse transcriptase–polymerase chain reaction (RT-qPCR) with U6 as the internal control. Levels are shown as mean and standard deviation of triplicate RNA samples, with the mean level in CaCo2 cells set to 1. (C) Ratio of miR-21 levels to pri-miR-21 levels. (D) Expression levels of 3 members of core miR processing machinery determined using RT-qPCR, using specific primers.
EGF treatment potently induces the miR-21 primary transcript, but only minimally affects mature miR-21 levels
Activation of the EGF/Ras/MAPK axis plays a pivotal role in CRC pathogenesis, and studies in other cancers have identified an important role for EGF and oncogenic Ras signaling in the control of miR-21 levels (Fujita et al., 2008; Seike et al., 2009; Talotta et al., 2009). We thus asked how activity of the EGF/Ras/MAPK axis impacts miR-21 levels in CRC cells. We first examined the effects of EGF. To do this, we treated CaCo2 cells with EGF and measured levels of mature miR-21 and its primary transcript pri-miR-21. As shown in Figure 2A, EGF treatment resulted in rapid (<1 h) and robust (greater than fivefold) induction of pri-miR-21 levels. Surprisingly, however, this yielded only a very slight (<1.5-fold) increase in levels of the mature miR-21 form. Recently, TGF-β signaling was shown to potently enhance miR-21 processing (Davis et al., 2008). We thus considered the possibility that efficient induction of miR-21 by EGF might require simultaneous stimulation of processing by TGF-β. To test this, we treated CaCo2 cells with TGF-β, alone and in combination with EGF. As shown in Figure 2B, treatment of CaCo2 cells with TGF-β did not affect miR-21 levels. Thus, EGF treatment is a potent inducer of primary transcript, but not mature, miR-21 levels.
FIG. 2.

Control of miR-21 expression by growth factors. (A) CaCo2 cells were serum-starved overnight and then treated with epidermal growth factor (EGF). Pri-miR-21 and miR-21 levels were determined at the indicated time points using RT-qPCR as in Fig. 1. Data are represented as ratio of mean levels in EGF-treated cells to mean levels in vehicle control cells. (B) miR-21 mean expression levels in CaCo2 cells, as a function of EGF or/and TGF-β treatment, determined as in (A); levels in vehicle control cells are set to 1.
Oncogenic Ras induces primary transcript- and mature miR-21 levels, but the latter requires sustained Ras activity
Relative levels of miR precursors tend to be lower than the mature miR form, and our analyses verified this to be the case for miR-21 in CRC cells (data not shown). We thus hypothesized that induction of the mature miR-21 form may require sustained induction of the primary transcript, and that such sustained activation might not be achievable with EGF treatment. To achieve more sustained activation of the EGF/Ras/MAPK axis, we introduced the constitutively active oncogenic Ras allele RasV12 into CaCo2 and SW48 cells, two different CRC cell lines lacking Ras or Raf activating mutations (as per the COSMIC database). As shown in Figure 3A (Caco2 cells) and B (SW48 cells), transient transfection with RasV12 resulted in upregulation of MAPK pathway activity, as indicated by Erk phosphorylation, in both cell lines. Introduction of RasV12 yielded a slight (CaCo2 cells) and robust (nearly twofold, SW48 cells) induction of pri-miR-21 levels. Surprisingly, as with EGF treatment, there was no discernible increase in mature miR-21 levels.
FIG. 3.

Control of miR-21 expression by transiently expressed oncogenic Ras in (A) CaCo2 and (B) SW48 cells. Top panels: RasV12 (detected using its HA epitope tag), pErk, Erk, and tubulin levels determined by immunoblotting of extracts from control and RasV12 transiently transfected cells. Bottom panels: Pri-miR-21 and miR-21 levels in control and RasV12 transiently transfected cells determined by RT-qPCR as in Figure 1. Results represent the mean and SEM of 2–3 independent experiments, each performed in triplicate; p-values were determined using a two-tailed student's t-test with unequal variance.
As an alternative approach, we examined the effects of stable expression of the same RasV12 allele. To do this, we introduced RasV12 into SW48 cells using a lentiviral expression system. As shown in Figure 4A, stable expression of RasV12 yielded a similar (approximately twofold) induction of pri-miR-21 levels. Moreover, stable expression of RasV12 also resulted in a robust (approximately twofold) induction of mature miR-21 levels. Interestingly, this induction was accompanied by only minimal activation of MAPK pathway activity (Fig. 4B). Ras is also known to activate PI3K signaling, and this arm of the Ras pathway has been recently shown to contribute to the activation of miR-21 expression in thyroid cancer cells (Frezzetti et al., 2011). To test whether the PI3K pathway was contributing to the miR-21 induction, we examined its activation by measuring Akt phosphorylation. As shown in Figure 4C, there was no appreciable change in Akt phosphorylation upon stable RasV12 expression in SW48 cells. Recently, MAPK activation was also shown to stimulate miR processing via Transactivating Response RNA-Binding Protein (TRBP)-mediated stabilization of Dicer protein (Paroo et al., 2009). We thus examined Dicer protein levels to determine whether this was a contributory mechanism to miR-21 induction. As shown in Figure 4D, stable RasV12 expression did not alter Dicer protein levels. Taken together, our data suggest that sustained, low-level oncogenic Ras expression induces mature miR-21 expression more effectively than transient, high-level expression, and that this induction acts through sustained upregulation of pri-miR-21 and/or stimulation of miR processing through mechanisms other than MAPK-mediated stabilization of the Dicer protein.
FIG. 4.

Control of miR-21 expression by stably expressed oncogenic Ras in SW48 cells. (A) Pri-miR-21 and miR-21 levels in control and RasV12 stably expressing cells determined by RT-qPCR as in Fig. 1. Results represent the mean and SEM of 3 independent experiments, each performed in triplicate;p-values were determined using a two-tailed student's t-test with unequal variance. (B) RasV12 (detected using its HA epitope tag), pErk, Erk, and tubulin levels in control and RasV12 stably expressing cells determined by immunoblotting. (C and D) pAkt, Akt, Dicer, and tubulin levels in control and RasV12 stably expressing cells determined by immunoblotting.
Ets transcription factors modulate miR-21 transcription by direct and indirect mechanisms
Consistent with an important role of Ras in the control of miR-21 expression in CRC cells, we observed that miR-21, and pri-miR-21, levels tended to be lower in cells lacking Ras or Raf activating mutations (CaCo2, SW48, and Colo320) than in cells with Ras (HCT15, HCT116, SW480, SW620, and GEO) or Raf (HT29 and RKO) activating mutations (Ras and Raf mutational status as per the COSMIC database). This was not universally the case, however. For example, the Ras/Raf wild-type CaCo2 cells had similar miR-21 levels, and higher pri-miR-21 levels, than the Ras mutant GEO cells. The miR-21 levels in these cell lines, namely, the relatively high levels in CaCo2 cells compared with other Ras/Raf wild-type CRC cells and the low levels in GEO cells compared with other Ras/Raf mutant cells, suggest the existence of other mechanisms that determine steady-state miR-21 levels in CRC cells. We hypothesized that Ets transcription factors might represent one important class of such modifiers, since they are known modulators of Ras/MAPK signaling, are frequently aberrantly expressed in CRC, and have been shown to regulate miR-21 expression in other contexts (Fujita et al., 2008; Jedlicka and Gutierrez-Hartmann, 2008; Seike et al., 2009; Talotta et al., 2009).
We thus examined the effects of selected Ets factors on miR-21 levels in CRC cells. We chose all members of the PEA3 Ets subfamily (Pea3, Erm, and Er81), and Ets2, as these have been previously shown to modulate CRC pathogenesis (Jedlicka and Gutierrez-Hartmann, 2008). In addition, we selected Elk1, the “canonical” Ets mediator of growth factor signaling via the MAPK pathway (Wasylyk et al., 1998a), and ESE1, a functionally important Ets factor in normal intestinal epithelium (Jedlicka and Gutierrez-Hartmann, 2008). Each Ets factor was introduced into CaCo2 and SW48 cells by transient transfection (Fig. 5). Following transfection, the effects on endogenous levels of the miR-21 primary transcript (pri-miR-21) and activity of an miR-21 promoter-reporter, were monitored. The data, representing an average of multiple independent experiments, are shown in Figure 6. In CaCo2 cells, the Ets factors Erm and ESE-1 each modestly, but consistently, downregulated endogenous pri-miR-21 levels (Fig. 6A). In SW48 cells, we did not observe pri-miR-21 repression by Ets factors; rather, Er81 upregulated pri-miR-21 levels (Fig. 6B). Interestingly, these effects were not mirrored in the miR-21 promoter-reporter experiments. In both cell lines, ESE-1 tended to enhance, rather than inhibit, promoter activity; this effect was significant in CaCo2 cells (Fig. 6C, D). Erm did show inhibition of promoter-reporter activity, but only in SW48 cells (Fig. 6D), rather than CaCo2 cells, where it repressed endogenous pri-miR-21. Together, these findings suggest that Ets factors are modifiers of miR-21 expression in CRC at the primary transcript level, and that the effects of individual Ets factors are cell context-dependent. Moreover, our findings suggest that some Ets factors may have both direct and indirect effects on pri-miR-21 expression levels. For example, ESE-1 appears to enhance miR-21 promoter activity in CaCo2 cells, but its overall effect on pri- miR-21 levels is inhibitory; this suggests that it either affects the expression of another miR-21 regulatory factor or, alternatively, acts dominantly through a more remote repressor element (not contained in the miR-21 promoter-reporter sequence).
FIG. 5.
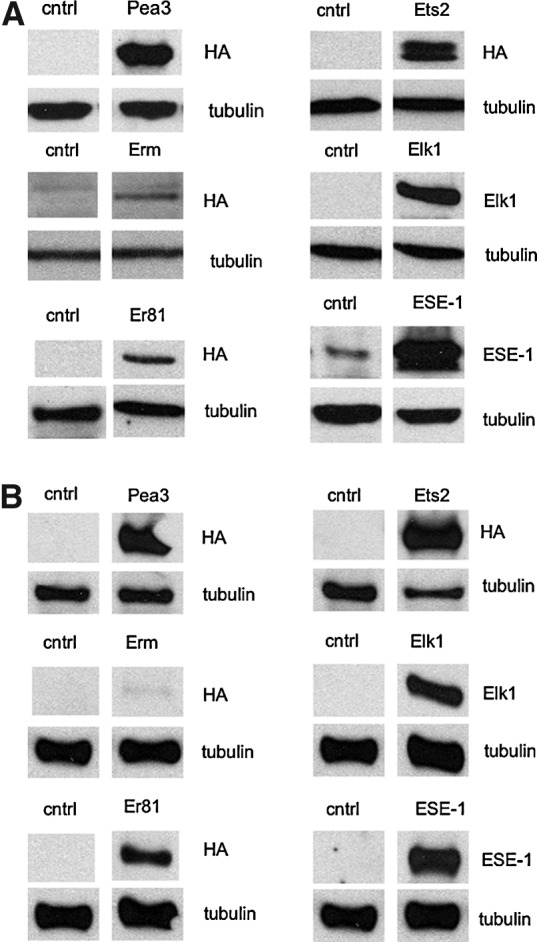
Transient expression of Ets transcription factors in (A) CaCo2 and (B) SW48 cells. Cells were transiently transfected with the indicated Ets transcription factors, and protein expression was determined 48 h later, by immunoblotting against the HA tag or using specific antibodies, as indicated in the figure.
FIG. 6.

Effects of Ets transcription factors on endogenous pri-miR-21 levels and activity of a miR-21 promoter-reporter (miPPR-21-luciferase) in CaCo2 and SW48 cells. (A and B) Pri-miR-21 levels in cells transiently transfected with the indicated Ets factors were determined 48 h following transfection, as in Figure 1. Results represent the mean and SEM of 2–3 independent experiments, each performed in triplicate. Results are normalized to pri-miR-21 levels in control (empty vector transfected) cells; p-values were determined using a two-tailed student's t-test with unequal variance. (C and D) Cells were transiently cotransfected with the indicated Ets factors, the miR-21 promoter-reporter (miPPR-21-luciferase) and renilla luciferase internal control. Reporter activity was measured 48 h later. Results represent the mean and SEM of 2 independent experiments, each performed in triplicate. Results are normalized to reporter activity in control (empty vector transfected) cells; p-values were determined using a two-tailed student's t-test with unequal variance.
Of all the manipulated Ets factors in the above experiments, one Ets factor showed the same trend in both cell lines and experimental systems. Although the effect was modest, Pea3 expression repressed endogenous pri-miR-21 levels and miR-21 promoter-reporter activity in CaCo2 and SW48 cells. To determine the robustness of this regulation, we examined the effects of Pea3 downregulation on miR-21 levels. We first identified a cell line with relatively high endogenous Pea3 levels (HT29; Fig. 7A), and then stably silenced Pea3 protein expression in these cells using a lentiviral shRNA approach (Fig. 7B). As shown in Figure 7C, Pea3 silencing resulted in a rise in endogenous pri-miR-21 levels, relative to the nontargeting shRNA control. Thus, Pea3 is a transcriptional repressor of miR-21 in CRC cells.
FIG. 7.

Effect of Pea3 silencing on pri-miR-21 expression. (A) Pea3 expression levels in CaCo2 and HT29 cells determined using immunoblotting with Pea3 specific antibody and tubulin as loading control. (B) Lentiviral shRNA-mediated silencing of Pea3 expression in HT29 cells, using two different targeting shRNAs, and an off-target control (shRNA to EGFP). Pea3 expression levels were determined as in (A). (C) Pri-miR-21 levels in control (shEGFP) cells and Pea3 stable knockdown HT29 cells determined using RT-qPCR as in Figure 1. Results represent the mean and SEM of 2 independent experiments, each performed in triplicate. Results are normalized to the pri-miR-21 level in the control cells; p-value was determined using a two-tailed student's t-test with unequal variance.
Discussion
miRs are important regulators of gene expression in health and disease, but relatively little is known about the control of miR levels in normal and diseased, including cancerous, cells. We were interested in gaining greater understanding of the control of the levels of miR-21 in CRC, as this miR has previously been shown to become overexpressed in CRC and to mediate aggressive oncogenic phenotypes. Our studies characterize the regulation of miR-21 expression by Ets transcription factors of importance in intestinal biology, and expand on the understanding of the role of the receptor tyrosine kinase/Ras axis in the control of miR-21 expression in cancer.
Ets transcription factors are important regulators of gene expression in development and homeostasis, and are frequently aberrantly expressed in cancer, including CRC (Jedlicka and Gutierrez-Hartmann, 2008). Other studies have identified regulation of miR expression by Ets transcription factors, including activation of miR-21 and miR-223 by PU.1 in hematopoietic cells (Fukao et al., 2007; Fujita et al., 2008), and repression of miR-125a by Pea3 in ovarian carcinoma cells (Cowden Dahl et al., 2009). The extent to which regulation of miR expression mediates the effects of aberrant Ets expression in cancer is largely unknown. Pea3 is a developmentally active Ets factor that is overexpressed in CRC, has tumor-promoting effects, is a nuclear mediator of Ras/MAPK signaling, and is associated with worsened CRC prognosis (Jedlicka and Gutierrez-Hartmann, 2008). Moreover, Pea3 is an activator of matrilysin expression in colon cancer cells (Crawford et al., 2001). Our finding that Pea3 represses expression of miR-21 indicates that, as occurs with some other Ets transcription factors, Pea3 can exert context-dependent activating or repressive effects on gene expression. A similar scenario appears to exist in ovarian cancer where EGF treatment results in Pea3-mediated induction of matrilysin expression (Cowden Dahl et al., 2007), but Pea3- dependent repression of miR-125a expression (Cowden Dahl et al., 2009), again suggesting a dual, promoter context-dependent, role in the regulation of gene expression. The fact that Pea3 can repress the expression of two different miRs in response to similar cues additionally raises the question of whether it might be a more general repressor of miR expression. We further identify the Ets factor ESE1 as a modulator of miR-21 expression. Interestingly, ESE-1 appears to activate the miR-21 promoter, but clearly represses endogenous pri-miR-21 levels in CaCo2 cells. As discussed, this suggests either a dominant indirect repressive mechanism, or a dominant direct repressive effect through a more remote cis-regulatory element.
Receptor tyrosine kinase/Ras/MAPK signaling has been shown to enhance miR-21 levels in cells. Our data suggest that this effect requires sustained activation of the signaling axis. A similar observation, namely a delay in induction of miR-21 levels upon oncogenic Ras expression, has been observed by others (Talotta et al., 2009). The precise mechanism of this delayed induction in CRC cells is unclear. In contrast to other systems (Davis et al., 2008), coexistent TGF-β signaling does not appear to make a critical contribution, possibly due to the relative refractoriness of CRC cells to this growth factor pathway (Ijichi et al., 2001). Further, stabilization of Dicer protein through the recently demonstrated MAPK/TRBP pathway (Paroo et al., 2009) also does not appear to be required. Possible mechanisms may be time-dependent accumulation of sufficient pri-miR-21 levels and stimulation of miR processing by mechanisms other than MAPK/TRBP. Interestingly, our data further suggest that miR-21 induction by oncogenic Ras requires at most only minimal downstream MAPK activation and raise the possibility of other MAPK and PI3K-independent mechanisms.
Conclusion
In the present study, we examined mechanisms controlling expression levels of the “oncomiR” miR-21 in CRC cells. We show that induction of the miR-21 mature form by EGF/Ras is slow, is associated with only minimal activation of MAPK, and may involve stimulation of post-transcriptional processing by mechanisms other than Dicer stabilization. We further identify Ets transcription factors as modifiers of miR-21 expression in CRC. Our findings suggest that the effects of individual Ets factors are cell context-dependent and involve both direct and indirect mechanisms, which, at times, can be opposing. The Ets factor Pea3 emerges from our studies as a modest but consistent repressor of miR-21 transcription. Overall, our studies identify a complex relationship between oncogenic pathways and establishment of miR-21 levels in CRC and highlight the need for greater understanding of the control of miR expression in cancer and other disease states.
Acknowledgments
This work was supported by NIH K08 DK74557, ARRA DK074557-04S1, and American Cancer Society Institutional Research Grant #57-001-47 (to PJ).
Disclosure Statement
No competing financial interests exist.
References
- Cai X. Hagedorn C.H. Cullen B.R. Human microRNAs are processed from capped, polyadenylated transcripts that can also function as mRNAs. Rna. 2004;10:1957–1966. doi: 10.1261/rna.7135204. [DOI] [PMC free article] [PubMed] [Google Scholar]
- Cowden Dahl K.D. Dahl R. Kruichak J.N. Hudson L.G. The epidermal growth factor receptor responsive miR-125a represses mesenchymal morphology in ovarian cancer cells. Neoplasia. 2009;11:1208–1215. doi: 10.1593/neo.09942. [DOI] [PMC free article] [PubMed] [Google Scholar]
- Cowden Dahl K.D. Zeineldin R. Hudson L.G. PEA3 is necessary for optimal epidermal growth factor receptor-stimulated matrix metalloproteinase expression and invasion of ovarian tumor cells. Mol Cancer Res. 2007;5:413–421. doi: 10.1158/1541-7786.MCR-07-0019. [DOI] [PMC free article] [PubMed] [Google Scholar]
- Crawford H.C. Fingleton B. Gustavson M.D. Kurpios N. Wagenaar R.A. Hassell J.A. Matrisian L.M. The PEA3 subfamily of Ets transcription factors synergizes with beta-catenin-LEF-1 to activate matrilysin transcription in intestinal tumors. Mol Cell Biol. 2001;21:1370–1383. doi: 10.1128/MCB.21.4.1370-1383.2001. [DOI] [PMC free article] [PubMed] [Google Scholar]
- Davis B.N. Hata A. Regulation of MicroRNA Biogenesis: A miRiad of mechanisms. Cell Commun Signal. 2009;7:18. doi: 10.1186/1478-811X-7-18. [DOI] [PMC free article] [PubMed] [Google Scholar]
- Davis B.N. Hilyard A.C. Lagna G. Hata A. SMAD proteins control DROSHA-mediated microRNA maturation. Nature. 2008;454:56–61. doi: 10.1038/nature07086. [DOI] [PMC free article] [PubMed] [Google Scholar]
- Eckel K.L. Tentler J.J. Cappetta G.J. Diamond S.E. Gutierrez-Hartmann A. The epithelial-specific ETS transcription factor ESX/ESE-1/Elf-3 modulates breast cancer-associated gene expression. DNA Cell Biol. 2003;22:79–94. doi: 10.1089/104454903321515896. [DOI] [PubMed] [Google Scholar]
- Frezzetti D. De Menna M. Zoppoli P. Guerra C. Ferraro A. Bello A.M. De Luca P. Calabrese C. Fusco A. Ceccarelli M., et al. Upregulation of miR-21 by Ras in vivo and its role in tumor growth. Oncogene. 2011;30:275–286. doi: 10.1038/onc.2010.416. [DOI] [PubMed] [Google Scholar]
- Fujita S. Ito T. Mizutani T. Minoguchi S. Yamamichi N. Sakurai K. Iba H. miR-21 Gene expression triggered by AP-1 is sustained through a double-negative feedback mechanism. J Mol Biol. 2008;378:492–504. doi: 10.1016/j.jmb.2008.03.015. [DOI] [PubMed] [Google Scholar]
- Fukao T. Fukuda Y. Kiga K. Sharif J. Hino K. Enomoto Y. Kawamura A. Nakamura K. Takeuchi T. Tanabe M. An evolutionarily conserved mechanism for microRNA-223 expression revealed by microRNA gene profiling. Cell. 2007;129:617–631. doi: 10.1016/j.cell.2007.02.048. [DOI] [PubMed] [Google Scholar]
- Ghildiyal M. Zamore P.D. Small silencing RNAs: an expanding universe. Nat Rev Genet. 2009;10:94–108. doi: 10.1038/nrg2504. [DOI] [PMC free article] [PubMed] [Google Scholar]
- Green S. Issemann I. Sheer E. A versatile in vivo and in vitro eukaryotic expression vector for protein engineering. Nucleic Acids Res. 1988;16:369. doi: 10.1093/nar/16.1.369. [DOI] [PMC free article] [PubMed] [Google Scholar]
- Hwang H.W. Wentzel E.A. Mendell J.T. Cell-cell contact globally activates microRNA biogenesis. Proc Natl Acad Sci U S A. 2009;106:7016–7021. doi: 10.1073/pnas.0811523106. [DOI] [PMC free article] [PubMed] [Google Scholar]
- Ijichi H. Ikenoue T. Kato N. Mitsuno Y. Togo G. Kato J. Kanai F. Shiratori Y. Omata M. Systematic analysis of the TGF-beta-Smad signaling pathway in gastrointestinal cancer cells. Biochem Biophys Res Commun. 2001;289:350–357. doi: 10.1006/bbrc.2001.5988. [DOI] [PubMed] [Google Scholar]
- Jedlicka P. Gutierrez-Hartmann A. Ets transcription factors in intestinal morphogenesis, homeostasis and disease. Histol Histopathol. 2008;23:1417–1424. doi: 10.14670/hh-23.1417. [DOI] [PMC free article] [PubMed] [Google Scholar]
- Jedlicka P. Sui X. Gutierrez-Hartmann A. The Ets dominant repressor En/Erm enhances intestinal epithelial tumorigenesis in ApcMin mice. BMC Cancer. 2009a;9:197. doi: 10.1186/1471-2407-9-197. [DOI] [PMC free article] [PubMed] [Google Scholar]
- Jedlicka P. Sui X. Sussel L. Gutierrez-Hartmann A. Ets transcription factors control epithelial maturation and transit and crypt-villus morphogenesis in the mammalian intestine. Am J Pathol. 2009b;174:1280–1290. doi: 10.2353/ajpath.2009.080409. [DOI] [PMC free article] [PubMed] [Google Scholar]
- Kim V.N. Han J. Siomi M.C. Biogenesis of small RNAs in animals. Nat Rev Mol Cell Biol. 2009;10:126–139. doi: 10.1038/nrm2632. [DOI] [PubMed] [Google Scholar]
- Klase Z. Kale P. Winograd R. Gupta M.V. Heydarian M. Berro R. McCaffrey T. Kashanchi F. HIV-1 TAR element is processed by Dicer to yield a viral micro-RNA involved in chromatin remodeling of the viral LTR. BMC Mol Biol. 2007;8:63. doi: 10.1186/1471-2199-8-63. [DOI] [PMC free article] [PubMed] [Google Scholar]
- Kota J. Chivukula R.R. O'Donnell K.A. Wentzel E.A. Montgomery C.L. Hwang H.W. Chang T.C. Vivekanandan P. Torbenson M. Clark K.R., et al. Therapeutic microRNA delivery suppresses tumorigenesis in a murine liver cancer model. Cell. 2009;137:1005–1017. doi: 10.1016/j.cell.2009.04.021. [DOI] [PMC free article] [PubMed] [Google Scholar]
- Krichevsky A.M. Gabriely G. miR-21: a small multi-faceted RNA. J Cell Mol Med. 2009;13:39–53. doi: 10.1111/j.1582-4934.2008.00556.x. [DOI] [PMC free article] [PubMed] [Google Scholar]
- Loffler D. Brocke-Heidrich K. Pfeifer G. Stocsits C. Hackermuller J. Kretzschmar A.K. Burger R. Gramatzki M. Blumert C. Bauer K., et al. Interleukin-6 dependent survival of multiple myeloma cells involves the Stat3-mediated induction of microRNA-21 through a highly conserved enhancer. Blood. 2007;110:1330–1333. doi: 10.1182/blood-2007-03-081133. [DOI] [PubMed] [Google Scholar]
- McKinsey E.L. Parrish J.K. Irwin A.E. Niemeyer B.F. Kern H.B. Birks D.K. Jedlicka P. A novel oncogenic mechanism in Ewing sarcoma involving IGF pathway targeting by EWS/Fli1-regulated microRNAs. Oncogene. 2011;30:4910–4920. doi: 10.1038/onc.2011.197. [DOI] [PMC free article] [PubMed] [Google Scholar]
- Paroo Z. Ye X. Chen S. Liu Q. Phosphorylation of the human microRNA-generating complex mediates MAPK/Erk signaling. Cell. 2009;139:112–122. doi: 10.1016/j.cell.2009.06.044. [DOI] [PMC free article] [PubMed] [Google Scholar]
- Schetter A.J. Leung S.Y. Sohn J.J. Zanetti K.A. Bowman E.D. Yanaihara N. Yuen S.T. Chan T.L. Kwong D.L. Au G.K., et al. MicroRNA expression profiles associated with prognosis and therapeutic outcome in colon adenocarcinoma. Jama. 2008;299:425–436. doi: 10.1001/jama.299.4.425. [DOI] [PMC free article] [PubMed] [Google Scholar]
- Seike M. Goto A. Okano T. Bowman E.D. Schetter A.J. Horikawa I. Mathe E.A. Jen J. Yang P. Sugimura H., et al. MiR-21 is an EGFR-regulated anti- apoptotic factor in lung cancer in never-smokers. Proc Natl Acad Sci U S A. 2009;106:12085–12090. doi: 10.1073/pnas.0905234106. [DOI] [PMC free article] [PubMed] [Google Scholar]
- Selcuklu S.D. Donoghue M.T. Spillane C. miR-21 as a key regulator of oncogenic processes. Biochem Soc Trans. 2009;37:918–925. doi: 10.1042/BST0370918. [DOI] [PubMed] [Google Scholar]
- Sotiropoulou G. Pampalakis G. Lianidou E. Mourelatos Z. Emerging roles of microRNAs as molecular switches in the integrated circuit of the cancer cell. Rna. 2009;15:1443–1461. doi: 10.1261/rna.1534709. [DOI] [PMC free article] [PubMed] [Google Scholar]
- Talotta F. Cimmino A. Matarazzo M.R. Casalino L. De Vita G. D'Esposito M. Di Lauro R. Verde P. An autoregulatory loop mediated by miR-21 and PDCD4 controls the AP-1 activity in RAS transformation. Oncogene. 2009;28:73–84. doi: 10.1038/onc.2008.370. [DOI] [PubMed] [Google Scholar]
- Trang P. Medina P.P. Wiggins J.F. Ruffino L. Kelnar K. Omotola M. Homer R. Brown D. Bader A.G. Weidhaas J.B. Slack F.J. Regression of murine lung tumors by the let-7 microRNA. Oncogene. 2010;29:1580–1587. doi: 10.1038/onc.2009.445. [DOI] [PMC free article] [PubMed] [Google Scholar]
- Trang P. Weidhaas J.B. Slack F.J. MicroRNAs as potential cancer therapeutics. Oncogene. 2008;27(Suppl 2):S52–S57. doi: 10.1038/onc.2009.353. [DOI] [PMC free article] [PubMed] [Google Scholar]
- Visone R. Croce C.M. MiRNAs and cancer. Am J Pathol. 2009;174:1131–1138. doi: 10.2353/ajpath.2009.080794. [DOI] [PMC free article] [PubMed] [Google Scholar]
- Wang V. Wu W. MicroRNA-based therapeutics for cancer. BioDrugs. 2009;23:15–23. doi: 10.2165/00063030-200923010-00002. [DOI] [PubMed] [Google Scholar]
- Wasylyk B. Hagman J. Gutierrez-Hartmann A. Ets transcription factors: nuclear effectors of the Ras-MAP-kinase signaling pathway. Trends Biochem Sci. 1998a;23:213–216. doi: 10.1016/s0968-0004(98)01211-0. [DOI] [PubMed] [Google Scholar]
- Wasylyk B. Hagman J. Gutierrez-Hartmann A. Ets transcription factors: nuclear effectors of the Ras-MAP-kinase signaling pathway. Trends Biochem Sci. 1998b;23:213–216. doi: 10.1016/s0968-0004(98)01211-0. [DOI] [PubMed] [Google Scholar]
- Weidhaas J.B. Babar I. Nallur S.M. Trang P. Roush S. Boehm M. Gillespie E. Slack F.J. MicroRNAs as potential agents to alter resistance to cytotoxic anticancer therapy. Cancer Res. 2007;67:11111–11116. doi: 10.1158/0008-5472.CAN-07-2858. [DOI] [PMC free article] [PubMed] [Google Scholar]
- Winter J. Jung S. Keller S. Gregory R.I. Diederichs S. Many roads to maturity: microRNA biogenesis pathways and their regulation. Nat Cell Biol. 2009;11:228–234. doi: 10.1038/ncb0309-228. [DOI] [PubMed] [Google Scholar]