Abstract
The parabrachial nucleus (PB) is a brainstem cell group that receives a strong input from the nucleus tractus solitarius regarding the physiological status of the internal organs and sends efferent projections throughout the forebrain. Since the neuroanatomical organization of the PB remains unclear, our first step was to use specific antibodies against two neural lineage transcription factors: Forkhead box protein2 (FoxP2) and LIM homeodomain transcription factor 1 beta (Lmx1b) to define the PB in adult rats. This allowed us to construct a cytoarchitectonic PB map based on the distribution of neurons that constitutively express these two transcription factors. Second, the in situ hybridization method combined with immunohistochemistry demonstrated that mRNA for glutamate vesicular transporter Vglut2 (Slc17a6) was present in most of the Lmx1b+ and FoxP2+ parabrachial neurons, indicating these neurons use glutamate as a transmitter. Third, conscious rats were maintained in a hypotensive or hypertensive state for two hours, and then, their brainstems were prepared by the standard c-Fos method which is a measure of neuronal activity. Both hypotension and hypertension resulted in c-Fos activation of Lmx1b+ neurons in the external lateral-outer subdivision of the PB (PBel-outer). Hypotension, but not hypertension, caused c-Fos activity in the FoxP2+ neurons of the central lateral PB (PBcl) subnucleus. The Kölliker-Fuse nucleus as well as the lateral crescent PB and rostralmost part of the PBcl contain neurons that co-express FoxP2+ and Lmx1b+, but none of these were activated after blood pressure changes. Salt-sensitive FoxP2 neurons in the pre-locus coeruleus and PBel-inner were not c-Fos activated following blood pressure changes. In summary, the present study shows that the PBel-outer and PBcl subnuclei originate from two different neural progenitors, contain glutamatergic neurons, and are affected by blood pressure changes, with the PBel-outer reacting to both hypo- and hypertension, and the PBcl signaling only hypotensive changes.
The brainstem neurons that regulate the cardiovascular system have been well-defined, although there are still gaps in our knowledge (Dampney, 1994, Blessing, 1997, Pilowsky and Goodchild, 2002, Guyenet, 2006, Goodchild and Moon, 2009). High pressure receptors (viz., baroreceptors) originating from the aortic arch and carotid sinus as well as low pressure receptors (viz., volume receptors) distributed in the walls of the atria and entrance sites of the great veins (viz., superior and inferior venae cavae) send afferent information via the vagus nerve into the nucleus tractus solitarius (NTS). The NTS is the first-order relay site in the brain for cardiovascular as well as other visceral information, and it functions like a clearing house by processing this incoming information and then, sending outputs to the numerous brainstem and forebrain targets for reflex adjustments and general integrative alterations of the autonomic and neuroendocrine systems (Loewy, 1990).
The NTS sends one of its strongest outputs to the parabrachial nucleus (PB) - a cell group that lies in the dorsolateral pons surrounding the brachium conjunctivum. This fiber bundle, also termed the superior cerebellar peduncle, divides the PB region into two main divisions: medial and lateral, but subsequent research divided the PB into ten subnuclei (Fulwiler and Saper, 1984). The latter nomenclature will be used here.
The NTS projection to the PB targets selective PB subnuclei in a viscerotopic fashion (Herbert et al., 1990), although some PB subnuclei receive converging inputs from multiple NTS regions. The medial and commissural NTS regions, which receive primary afferent inputs from the cardiovascular, gastrointestinal, and respiratory systems, project to five different PB sites: central lateral PB (PBcl), dorsal lateral PB (PBdl), PB external lateral (PBel), PB ventral lateral (PBvl), and medial PB (PBm) subnuclei (Herbert et al., 1990, Karimnamazi et al., 2002). The rostral NTS, a taste recipient region, is equally complex since it projects to four PB sites: medial PB (PBm), external medial PB (PBem), waist area of PB (PBwa), and PBvl. (Herbert et al., 1990, Karimnamazi et al., 2002). The ventrolateral NTS, which subserves respiratory functions, targets three PB subnuclei: Kölliker-Fuse nucleus, PBem, and PBcl (Herbert et al., 1990) For the most part, with the exception for the PBvl, these projections are non-overlapping and suggest a pattern of viscerotopic organization within the PB, but its exact organization remains unknown.
Several c-Fos studies have described the location of PB neurons that become activated by blood pressure changes (Li and Dampney, 1994, Graham et al., 1995, Rocha and Herbert, 1996, Potts et al., 1997, Potts et al., 2000). For example, blood pressure sensitive PB neurons have been localized in three PB subnuclei: PBcl, PBdl, and PBel (Rocha and Herbert, 1996), but Dampney and colleagues found that only the PBel becomes activated after prolonged hypotension or hypertension in conscious rabbits (Potts et al., 1997). Some doubt, therefore, remains regarding which PB subnuclei are activated during blood pressure changes.
A detailed electrophysiological map of the PB in the rat reported that the firing rate of PBcl, PBel, and Kölliker-Fuse neurons increased during hemorrhage and remained elevated during restoration of blood volume by blood transfusion (Ward, 1989). By using multivariate regression analysis, Ward (1989) suggested that neurons found in these three sites were more likely to be responding to arterial blood pressure changes than blood volume changes. Neurons in the dorsal cap of the PBcl and caudal medial PB were selectively responsive to blood volume changes. Even though these results correlate well with the findings of Rocha and Herbert (1996), we felt it was reasonable to re-examine the issue because the Fos-activation pattern has not yet been related to the chemical nature of the individual neurons that form the PB subnuclei (see below).
A further unresolved issue is little is known about the neurotransmitters expressed in the PB neurons, although several papers have detailed the presence of neuropeptide-containing PB neurons (Uhl et al., 1979, Block and Hoffman, 1987, Herbert and Saper, 1990, Guo et al., 2005, D'Hanis et al., 2007, Westberg et al., 2009). With the exception of one report (Guo et al., 2005), nothing is known about the PB neuronal phenotypes that are involved in processing cardiovascular information. This latter study found that stimulation of the cardiac sympathetic afferents on the surface of the heart, which is similar to the sensory events that occur during myocardial infarction, resulted in Fos-activation of PBel neurons that express both glutamate and neuronal nitric oxide synthase (Guo et al., 2005).
An alternative way to examine the PB is to determine which transcription factors (TFs) that are present at embryonic and early postnatal developmental stages (Gray et al., 2004, Gray, 2008) are also constitutively expressed in the adult rat brain. The combinational pattern of TF expression within specific neurons has been proposed to define essential components of neural identity such as neurotransmitter, axonal projection pattern, and dendritic morphology. As such, differences in TF expression can be causal to functional differences between adjacent neuronal populations. Because of their relative specificity, TFs have been remarkably useful tools for defining unique subpopulations of neurons, especially within highly heterogeneous neural complexes. Here, we used the TFs as a means to identify the PB subgroups that are responsive to blood pressure changes. Earlier, we reported the localization and efferent projections of the Forkhead box protein2 (FoxP2) neurons in the PB of adult rats that are sensitive to sodium deprivation (Stein and Loewy, 2010, Geerling et al., 2011, Shin et al., 2011).
The PB complex contains neurons derived from at least two developmental progenitor populations, one expressing the proneural TF Atoh 1 (atonal homolog 1) and a second expressing the LIM homeodomain transcription factor 1 beta (Lmx1b). FoxP2 is expressed in several brainstem populations including a subset of Atoh-derived PB neurons. To differentiate these populations, here, we used another antibody to localize PB neurons that express Lmx1b. In this report, we utilized specific antibodies directed against FoxP2 and Lmx1b to define specific PB subnuclei, and then, subsequently, used these reagents in combination with the standard c-Fos method (a marker of neuronal activity) to describe the PB areas that become excited during sustained blood pressure changes.
EXPERIMENTAL PROCEDURES
General Background
The surgical and experimental procedures were approved by the St. Louis University and Washington University School of Medicine Institutional Animal Care and Use Committees and followed NIH guidelines. At the end of each experiment, the rats were anesthetized with 3.5% chloral hydrate, and perfused through the heart with 0.9% saline, followed by 4% paraformaldehyde in 0.1 M sodium phosphate buffer (pH = 7.4), and their brains were removed immediately and placed in fixative for 1–2 weeks.
Immunohistochemistry
Transverse sections of the pons were cut on freezing microtome at 50 µm thick, collected, and stored as a one-in-five series in 0.1 M sodium phosphate buffer (pH = 7.4) solution containing 1% sodium azide. Tissues were processed with the following combinations of primary antibodies: FoxP2 & Lmx1b, c-Fos & FoxP2, c-Fos & Lmx1b, cFos & FoxP2 & Lmx1b, c-Fos & tyrosine hydroxylase & FoxP2, c-Fos & tyrosine hydroxylase & Lmx1b, Lmx1b & calcitonin gene-related peptide, and FoxP2 & dynorphin A.
The primary antibodies used in this study were as follows: rabbit anti-calcitonin gene-related peptide (1:8K; cat # AB 1971; Millipore, Temecula, CA), rabbit anti-dynorphin A (1:6K; cat. # H021-03; Phoenix, Burlingame, CA), rabbit anti-Fos (1:10K; cat. #PC38; Calbiochem, San Diego, CA), sheep anti-FoxP2 (1:5K; cat. #AF5647; R&D Systems, Minneapolis, MN), guinea pig anti-Lmx1b (1:2K; C. Birchmeier and T. Jessell), rabbit anti-Lmx1b (1:250 or 1:500; Y.-Q. Ding), and mouse anti-tyrosine hydroxylase (1:1K; cat. # MAB318; Millipore, Temecula, CA).
The histochemical protocol used here has been described previously (Miller et al., 2011). The histochemical procedure involved sequential ABC reactions, using avidin and biotin blocking steps that followed the application of each primary antibody. Specific biotinylated secondary antibodies (1:250; Jackson ImmunoResearch, West Grove, PA) were used, followed by treatment with an ABC solution made from a standard Vectastain ABC kit (#PK-4000: Vector Labs, Burlingame, CA) and colorized with Cy3-streptavidin (1:250; Jackson), Alexa 488-streptavidin (1:250, Invitrogen, Carlsbad, CA), or Cy5-streptavidin (1:250; Jackson). Sections were mounted on gelatinized glass slides, dried, and coverslipped with a non-fade solution made with a buffered glycerol solution containing 0.1% n-propyl gallate.
Combined in situ hybridization and immunohistochemistry method
Rats (n = 4, female, 250 gm) were perfused as described above, and their brains quickly removed, and stored overnight in fixative. The brainstems were transferred to a 30% sucrose solution made in 0.1 M sodium phosphate buffer for 2 days, removed, surrounded with OCT embedding compound (Tissue-Tek, Sakura Finetek, Torrance, CA), frozen, and stored at −80° C for several weeks. The brainstem was removed from the freezer, mounted on a chuck, and placed in a cryostat which was −20° C. Then, frozen sections were cut at 20 µm, thaw mounted onto glass slides, and then, the slides were subsequently stored in a −20° C freezer until needed.
Linearized rat Vglut2 and Lmx1b cDNA fragments were generated by PCR using sequence specific primers coupled with T7 and T3 polymerase sequences (Vglut2 plasmid was provided by Dr. R. Stornetta (Stornetta et al., 2002), forward AATTAACCCTCACTAAAGGGTGCGGTCCCACACCTGGTCA, reverse GTAATACGACTCACTATAGGCACGTGACTGCCGCCACAGA, 892 base pair product), Lmx1b, (Plasmid from Open Biosystems, clone ID 7107597), AATTAACCCTCACTAAAGAGTTCGTCATGCGGGCGCT, GTAATACGACTCACTATAGGCATTCTGGCATTGGGGCGCGT, 650 base pair product) . Digoxigenin (DIG) labeled anti-sense RNA probes were made using PCR products as templates and T7 RNA polymerase (Roche). cRNA probes were purified using Quick Spin columns (Roche) and quantified by spectrophotometry.
After the slides were removed from the freezer, they were allowed to come to room temperature, immersed in 4% paraformaldehyde, permeabilized with RIPA buffer (150 mM NaCl, 1% NP-40, 0.5% Na deoxycholate, 0.1% SDS, 1mM EDTA, 50mM Tris pH 8.0), returned to 4% paraformaldehyde, and then, washed in 0.1 M triethanolamine-HCl with 0.25% acetic anhydride. Once blocked in hybridization buffer at 65°C, slides were incubated in hybridization buffer containing 1 µg/ml DIG labeled anti-sense cRNA overnight at 65°C. Slides were then washed in 2x SSC (300 mM NaCl, 30 mM sodium citrate, pH 7.0) at 62°C, blocked with 10% normal horse serum in a modified 0.1M PBS (0.1 M sodium phosphate buffer, 2 mg/ml bovine serum albumin, and 0.1% Triton X-100), and incubated in alkaline phosphatase labeled anti-DIG antibody (Roche) (1:2000, 10% NHS) overnight. Sections were washed and colorized using Nitro blue tetrazolium (NBT) and 5-bromo-4-chloro-3-indolyl phosphate (BCIP) (Roche). Staining was stopped after visual inspection. Sections were washed, then fixed in 4% paraformaldehyde. Tissue slides were washed in PBS containing 0.5% Triton X-100, blocked in 10% heat inactivated normal horse sera, incubated in sheep anti-FoxP2 antibody (1:5K) or rabbit-anti Lmx1b (1:500) overnight at 4°C, incubated in Cy3 conjugated donkey anti-sheep or Cy3 conjugated donkey anti-rabbit secondary antibody for 2–3 hours, washed, and then, coverslipped in Vectashield mounting medium (Vector Laboratories).
Image acquisition for the in situ hybridization and immunohistochemical material
Combined immunofluorescence and brightfield images were acquired using a Nikon 90i microscope (Nikon Instruments, Melville, NY), Roper H2 cooled CCD camera (Photometrics, Tucson, AZ), and Optigrid Structured Illumination Confocal with a Prior (Rockland, MA) motorized translation stage. Pseudo-colored images were acquired in Volocity program (Perkin Elmer, Waltham, MA), and modified in Adobe Photoshop (Adobe, San Jose, CA) and exported as 8 bit JPEG images. Images were filtered and levels were modified for clarity.
Blood pressure experiments
Male Sprague-Dawley rats (Harlan Laboratories, Indianapolis, IN) weighing 300–350 g were housed under conditions with 12 h of light and 12 h of darkness. All surgical instrumentation was performed under 2.0 % isoflurane anesthesia using aseptic technique. The femoral artery and vein were cannulated with sterile polyvinyl chloride tubing (PVC, ID 0.5 mm × OD 0.8 mm, Critchley Electrical Products, Auburn, NSW Australia) inserted into Tygon microbore tubing (ID 0.020” × OD 0.060”, Norton Performance Plastics, Akron, OH) for arterial pressure determination and intravenous drug infusion, respectively. Prior to insertion into the blood vessels, the catheters were sterilized, and filled with sterile saline. The PVC portion of the catheters were advanced 2.5 cm into the respective blood vessels, and tied in place with sterile 3-0 silk. The free-end of each catheter was tunneled subcutaneously to the suprascapular region, diverted through the skin, and sutured to the underlying muscle and skin. Catheters were then filled with a 70% sucrose solution containing 100 U/ml heparin and 10 mg/ml cefotaxime. The exteriorized end of each catheter was plugged with a 23 g needle cut to 1 cm and melted to seal. All animals received enrofloxacin (10mg/kg; Baytril, Bayer) the day prior to surgery, day of surgery, and 3–4 days post surgery.
After 3–4 days of recovery, each rat was maintained in its own individual home cage. The rats were not disturbed for approximately 16–18 hours before attaching cannulas for arterial pressure measurement and venous infusion. Arterial pressure was determined during a constant, low volume infusion of sterile saline (3.5 ml/hr) to maintain patency beginning at 7 AM. The venous infusions began at 9:00AM. Then, 20 min later, the same protocol was repeated for the second rat, and after an additional 20 min, the experiment with the third rat was begun. Infusions occurred over a 2 hour period.
Infusion Method
The venous catheter was connected to an infusion pump for drug administration. Arterial pressure and heart rate were recorded continuously during the intravenous infusion of phenylephrine hydrochloride (0.5 mg/ml; infused at 300–600 µl/hr: # P6126; Sigma, St. Louis, USA) or sodium nitroprusside (1.5 mg/ml; infused at 200–800 µl/hr; #71778; Sigma). Phenylephrine, an α1-adrenergic receptor agonist that does not cross the blood brain barrier, was used to increase arterial pressure by causing peripheral vasoconstriction. Sodium nitroprusside, a nitric oxide donor, was used to cause peripheral vasodilation resulting in hypotension, and as used in the present experiments, it probably did not affect CNS neurons due to the short half life of nitric oxide.
Data were recorded using a Grass chart recorder and a data acquisition system (DATAQ Instruments, Inc., Akron, OH). Control rats received 500 µl/hr sterile saline intravenous infusions for 2 hours. A second group of control rats were catheterized as described above, and maintained for 2 hours in their home cage but they did not receive any infusion; these rats were prepared to evaluate the potential effects that the surgery may have had on Fos-activation in the PB.
At the end of each experiment, the rats were anesthetized with an intravenous injection of freshly prepared 3.5% chloral hydrate and in < 3 minutes, they were perfused through the heart with saline, followed by 4% buffered paraformaldehyde. Their brains were removed immediately and placed in fixative for 1–2 weeks.
Cell counts of PB from the blood pressure experiments
Systematic cell counts were made of the Fos-activated FoxP2, Fos-activated Lmx1b, and Fos-activated co-labeled FoxP2 and Lmx1b neurons. First, fluorescence images of the PB were acquired with a Nikon Eclipse E800 fluorescence microscope (Nikon Instruments, Melville, NY) using a Q Imaging CCD camera and PM Capture Pro software (Surrey, BC Canada V3S 6K3). The images were montaged, and adjustments in brightness, contrast, pseudocolor, and cropping were made using Adobe Photoshop (Adobe, San Jose, CA). Then, cell counts were made of selected PB regions using MetaMorph software (Molecular Devices, Sunnyvale, CA ), in a similar manner as performed in earlier report from our laboratory where specific templates for the PB subnucleus were constructed and using for counting (Geerling and Loewy, 2007).
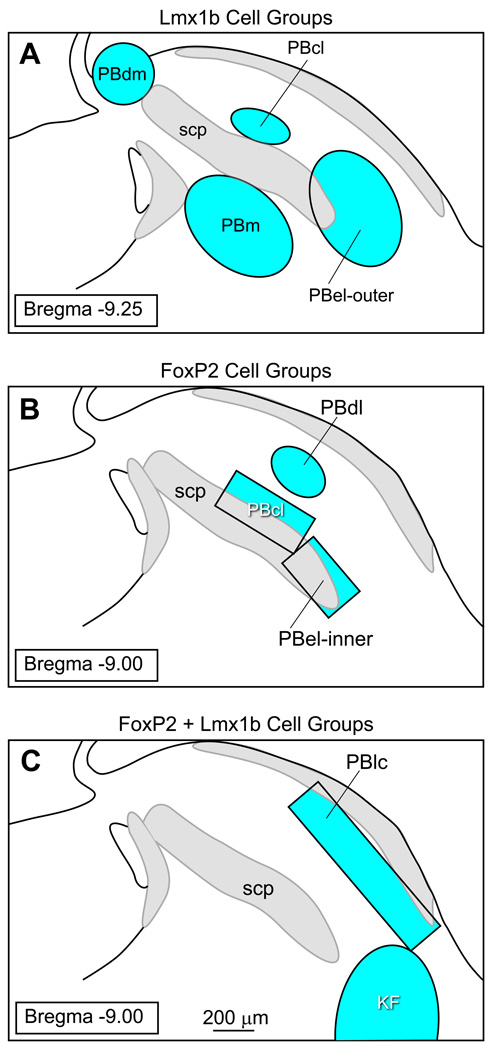
Figure 9 illustrates the templates used for sampling the PB subnuclei. Four Lmx1b groups were analyzed: PBcl, PBdl, PBel-outer, and PBm. Three FoxP2 cell groups were sampled: PBcl, PBdl, and PBel-inner. Two areas containing co-labeled FoxP2 and Lmx1b neurons were also evaluated: KF and PBlc. Unilateral counts were done on all areas except where specified otherwise. Each PB region was defined by the presence of FoxP2, Lmx1b, or FoxP2 & Lmx1b neurons.
Figure 9.
Templates used for sampling selective regions of the parabrachial nucleus.
The templates for the sampling the Lmx1b cell groups were constructed as follows: PBdm = 300 µm diameter circle involving two sections (Bregma = −9.00 and 9.25 mm), PBcl = 300 × 150 µm oval involving one section at Bregma level −9.25 mm (average of right and left sides), PBel-outer = 600 × 400 µm oval involving three sections at Bregma levels −9.00, −9.25, and −9.5 mm, and PBm = 600 × 400 µm oval at three Bregma levels −9.00, 9.25, and 9.5 mm.
The templates used for the analysis of the FoxP2 cell groups were as follows: PBdl = 300 × 200 µm oval involving 2 sections at Bregma −9.00 and −9.25, PBcl = 450 × 200 µm rectangle at Bregma −9.00 mm level (average of right and left sides), and PBel-inner = 350 × 200 µm rectangle at Bregma −9.00 level (average of right and left sides).
The templates for the co-labeled FoxP2 and Lmx1b were as follows: KF = 800 × 500 µm oval applied at the Bregma −9.00 mm level (average of right and left sides), and the PBlc = 600 × 150 µm rectangle at the Bregma levels of −9.00, −9.25, and −9.50 mm.
Data were entered into a Microsoft Excel spreadsheet. All comparisons shown here were compared by one-way ANOVA in GraphPad Prism software (San Diego, CA, USA). A p-value of less than 0.05 was chosen as signifying statistical significance for this study. The primary comparison was the number of neurons double-labeled for c-Fos & Lmx1b or c-Fos & FoxP2 between control and hypotensive/hypertensive animals. All group data are presented here as mean ± SEM.
Confocal images
Confocal imaging was performed using an Olympus Fluoview FV500b laser-scanning microscope. Montage images were acquired as multiple individual stacks using a 20× (NA 1.17) or 40× (NA 1.35) oil objective in 0.621 or 0.311 µm, respectively throughout the full tissue depth. Each z-frame from each image tile in the montage was collapsed into a single two-dimensional, maximum-projection image to produce individual tiles each at a resolution of 1024 × 1024 pixels (roughly 642 × 642 µm). Manipulation of confocal stacks, z-frame compression and pseudocoloration was performed with MetaMorph software (Molecular Devices, Sunnyvale, CA, USA). Individual 2D panels were then aligned into larger-area photomontages after brightness and contrast normalization of each channel in Adobe Photoshop.
RESULTS
Distribution of FoxP2 and Lmx1b neurons in the dorsolateral pons
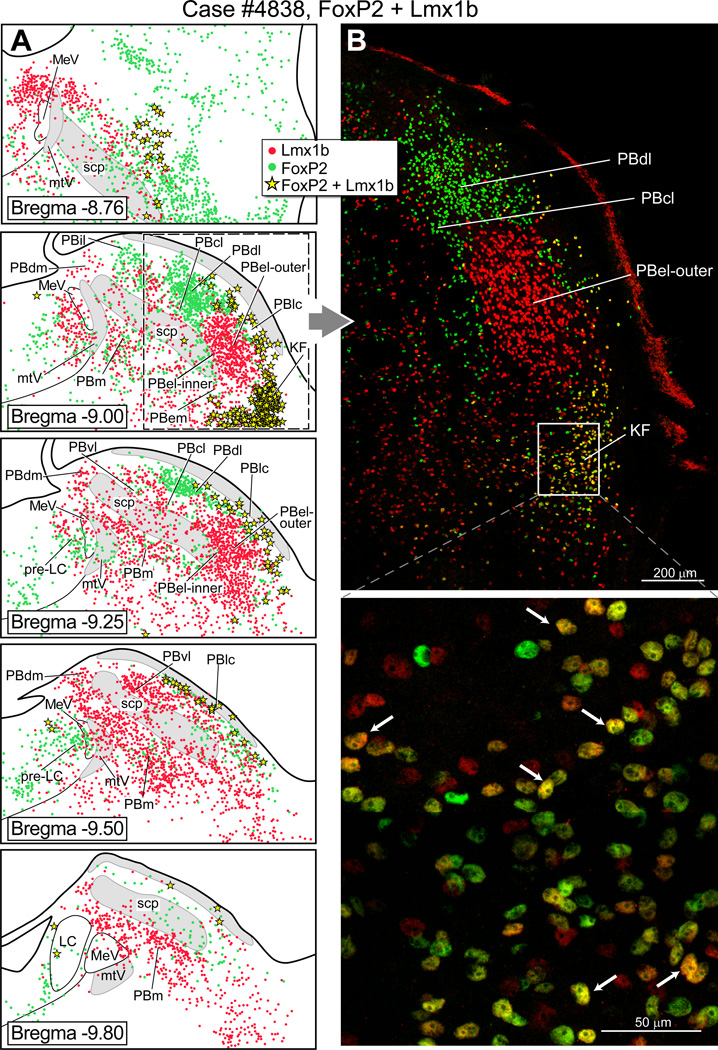
Fig. 1 shows the distribution of FoxP2+ and Lmx1b+ neurons in a series of coronal sections through the rat PB. (Note: Throughout this paper we use the plus sign “+ “as a shorthand way to refer to immunoreactive neurons.) In the lateral parabrachial region, FoxP2+ neurons were present in internal lateral PB (PBil), dorsal lateral PB (PBdl), rostral part of the central lateral PB (PBcl) and external lateral-inner subdivision of the PB (PBel-inner). The Fox-P2 neurons that lie in the PBel-inner were documented in detail in an earlier report (Geerling et al., 2011), and these neurons were often embedded in the ventrolateral part of the superior cerebellar peduncle. In the present material, we could not identify the superior lateral PB subgroup (PBsl) perhaps because the neurons lying in this area express the transcription factor Runx1, as has been reported for the mouse (Zagami and Stifani, 2010). In the medial PB (PBm), relatively few FoxP2+ neurons were observed. FoxP2+ neurons were also clustered in the pre-locus coeruleus nucleus, confirming earlier work (Stein and Loewy, 2010, Geerling et al., 2011). Lmx1b+ neurons were densely concentrated in the PBel-outer subdivision, and localized in additional sites including the ventral lateral PB (PBvl), caudal part of the PBcl, and external medial PB (PBem). Single FoxP2+ and Lmx1b+ neurons were embedded in the superior cerebellar peduncle, including in the PB waist region and the ventrolateral part of the superior cerebellar peduncle. Double-labeled FoxP2+ and Lmx1b+ neurons were distributed in three sites: Kölliker-Fuse nucleus, lateral crescent PB, and rostral PBcl.
Figure 1.
Cytoarchitectonic map of the rat parabrachial nucleus showing neurons that express the transcription factors FoxP2 and Lmx1b. (A) Line drawings of transverse sections of the dorsolateral pons illustrating the distribution of FoxP2 +and Lmx1b+ neurons in parabrachial subgroups. Bregma levels (in millimeters) are indicated on the lower left side of each drawing, based a standard rat brain atlas (Paxinos and Watson, 2005). (B) Upper panel: Photo image of the lateral parabrachial region to show collections of FoxP2+ neurons (green dots) in the PBdl and PBcl subnuclei. A dense cluster of Lmx1b+ neurons (red dots) is shown in the PBel-outer subdivision. Lower panel: Higher magnification of the Kölliker-Fuse nucleus (KF) neurons to show that most of these cells co-express FoxP2 and Lmx1b (yellow).
Parcellation of the subgroups that lie in the rostral PB level (Bregma = −8.76 mm in Figs. 1, 5–7) was problematic. This region contains the PBcl, PBvl, and PBsl cell groups (Fulwiler and Saper, 1984), but we were not confident that we could accurately define these regions in our material, so we left these regions unlabeled. However, we did observe there were neurons that co-expressed FoxP2+ and Lmx1b+ in this area (Fig. 1A) and these may represent the rostral extension of the PBlc, although according to Fulwiler and Saper (1984), this region is the PBcl.
Figure 5.
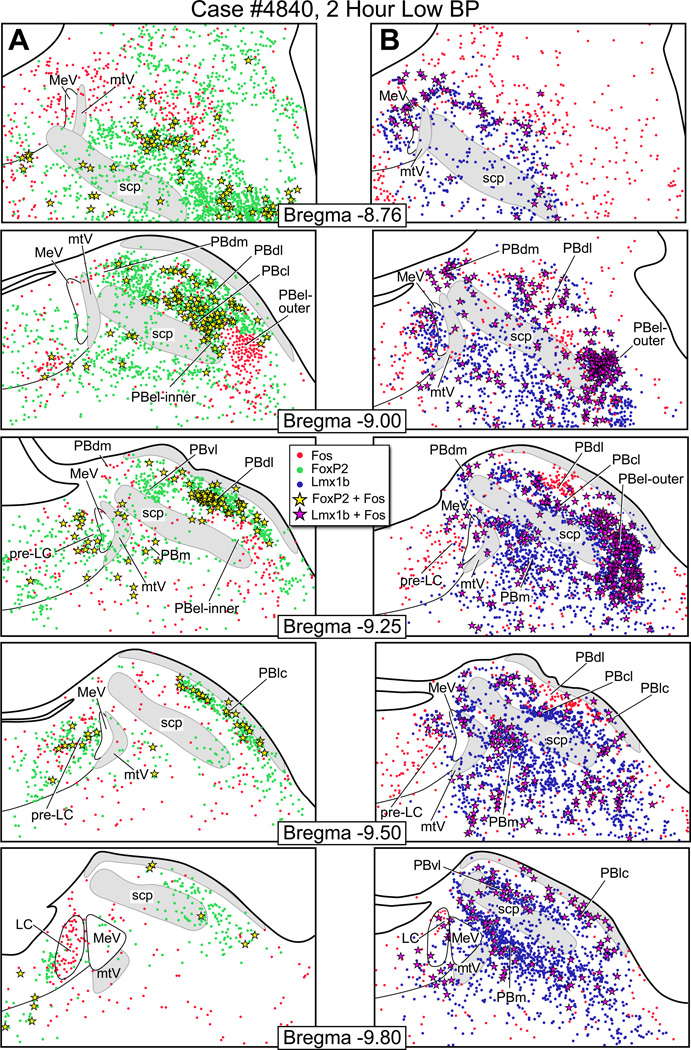
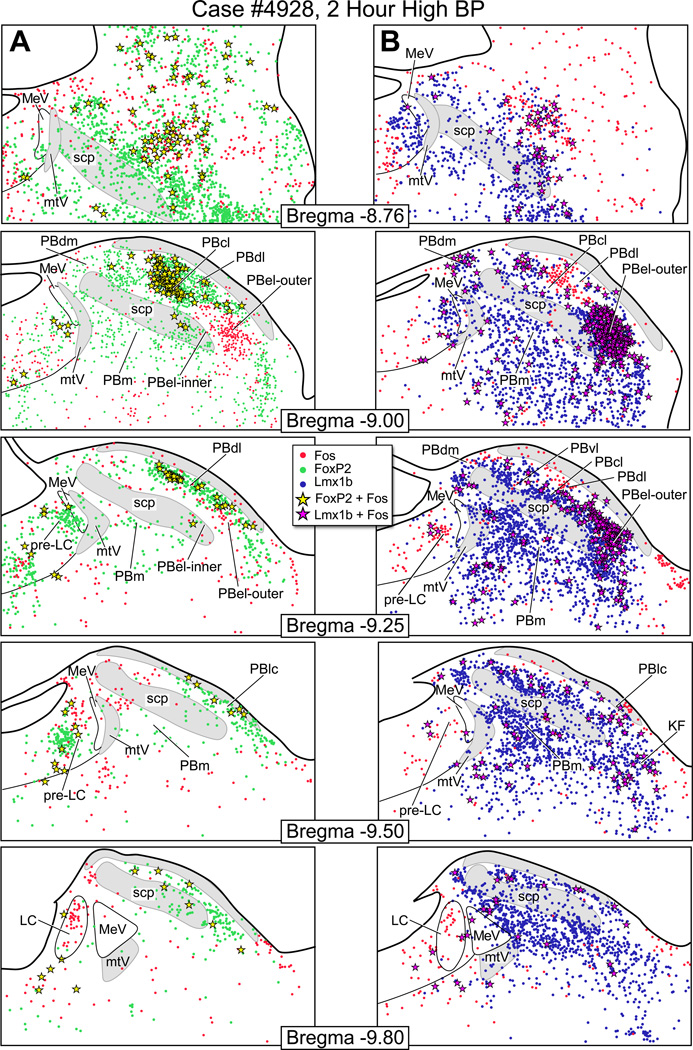
Fos activation in the parabrachial nucleus after two hours of hypotension. (A) Line drawings showing Fos-activated neurons (red dots), FoxP2+ neurons (green dots), and co-labeled Fos & FoxP2+ neurons (yellow stars) after hypotension. (B) Fos-activated neurons (red), Lmx1b+ neurons (blue), and co-labeled Fos & Lmx1b+ neurons (magenta stars) after hypotension In Panel A, the bregma −9.0 shows a large concentration of Fos & FoxP2+ co-labeled neurons in the PBcl. In Panel B, the bregma −9.0 and −9.25 levels show a large number of Fos & Lmx1b+ co-labeled neurons in the PBel-outer.
Figure 7.
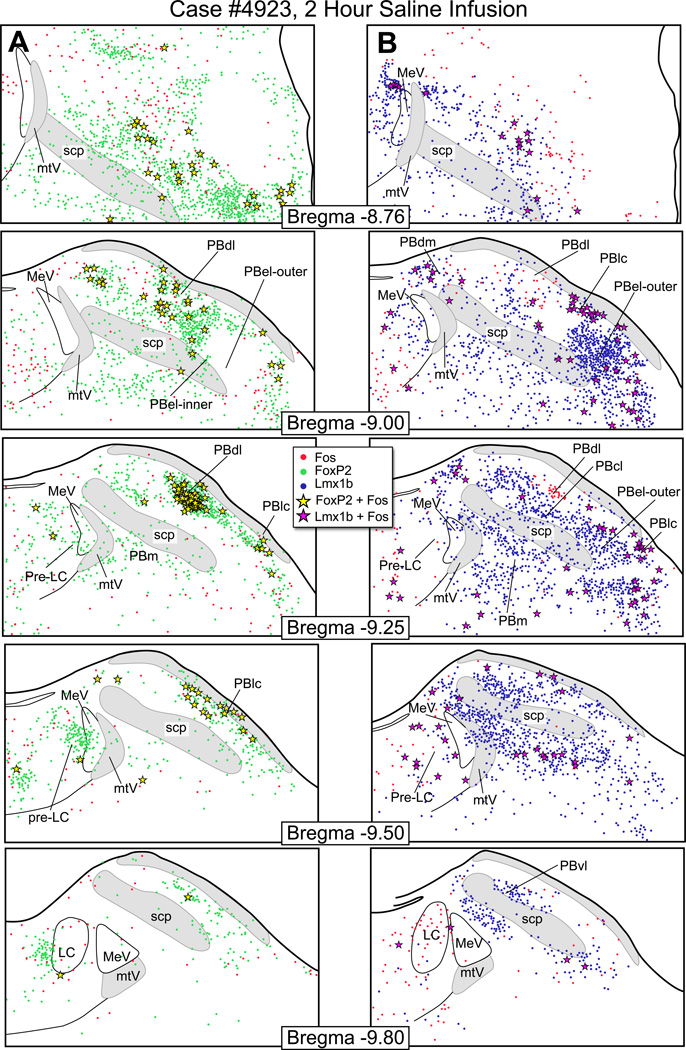
Fos activation pattern in the parabrachial nucleus from a saline infused control rat. (A) These drawings show the distribution of Fos-activated neurons (red dots), FoxP2+ neurons (green dots), and co-labeled Fos & FoxP2+ neurons (yellow stars). (B) The distribution of Fosactivated neurons (red), Lmx1b+ neurons (blue), and co-labeled Fos & Lmx1b+ neurons (magenta stars).
Co-localization of dynorphin A in FoxP2 neurons and CGRP in Lmx1b neurons of the PB
Examples of dynorphin A+ neurons that co-express FoxP2+ are shown in Fig. 2. These neurons were located mainly in the dorsomedial part of the PBdl, with a few in the PBel-inner, which is in agreement with earlier work (Hermanson et al., 1998, Engblom et al., 2004). The lower half of this figure shows examples of co-localization of Lmx1b in CGRP immunoreactive neurons in the PBel; nearly 90% of the CGRP neurons also express Lmx1b.
Figure 2.
(A): Left panel: Line drawing showing the distribution of neurons that co-express FoxP2+ and dynorphin A+ (yellow stars) in lateral parabrachial nucleus. Most of these neurons were localized in the PBdl, and a few were identified in the PBel-inner. Right panel: Photoimage of FoxP2+ neurons that co-express dynorphin A immunoreactivity from a colchicine-treated rat (100 µg in 10 µl in lateral ventricle; 2 day survival). (B): Left panel: Line drawing showing the distribution of neurons that co-express Lmx1b+ and CGRP+ (magenta stars). Right panel: PBel-outer region contains neurons that co-express Lmx1b and CGRP immunoreactivity.
Vglut2 mRNA localization in FoxP2 and Lmx1b neurons in the PB
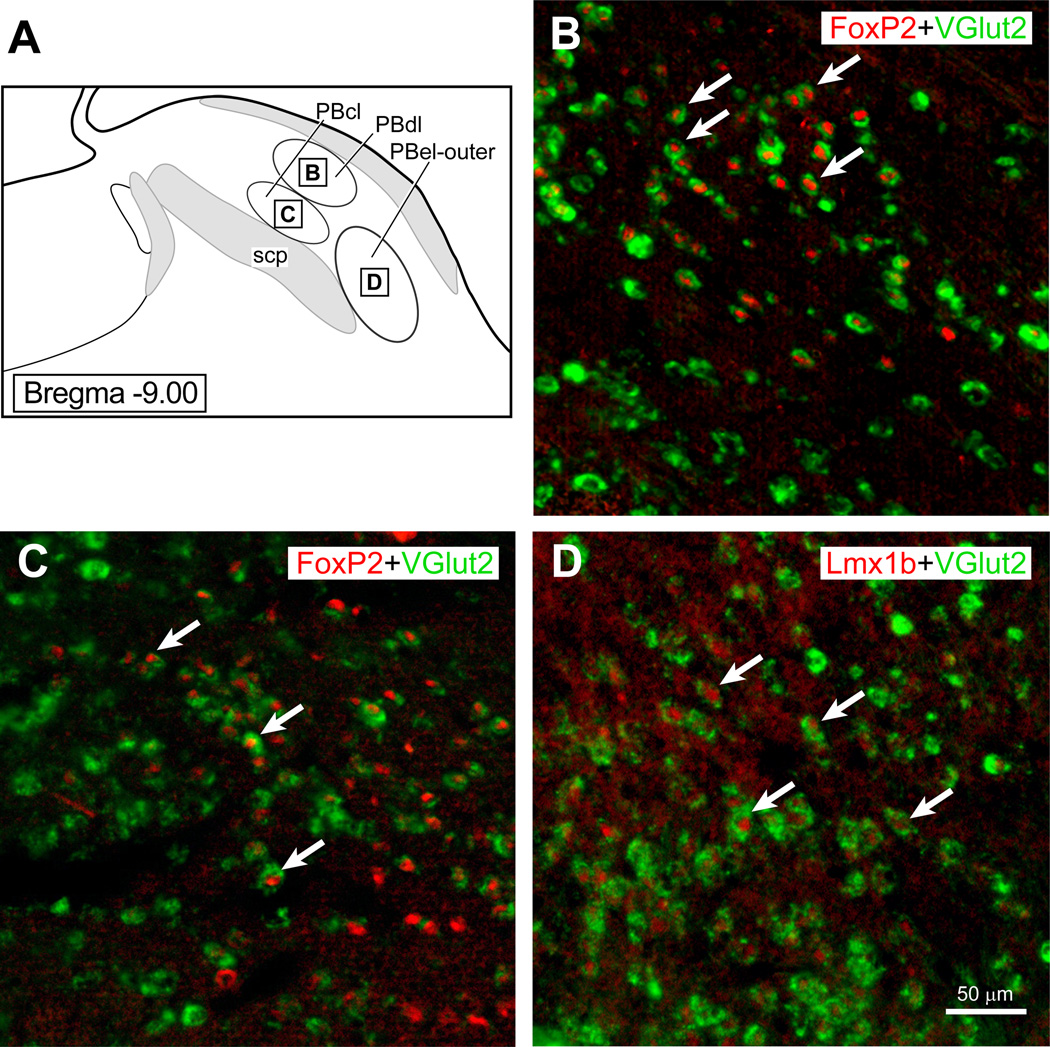
Fig. 3 shows an in situ hybridization preparation for Vglut2 mRNA which had also been immunostained for FoxP2 (upper panel). The lower panel shows another Vglut2 mRNA preparation that was immunostained with antibodies against Lmx1b (lower panel). The examples shown to the right of these panels shows higher magnification of double-labeled neurons in these respective regions.
Figure 3.
(A) The parabrachial region showing the three PB subnuclei (PBdl, PBcl, and PBel-outer) with insert squares to indicate where photoimages presented in (B–D) were taken. Pseudocolors were added to the scanned images presents in B–C. (B): PBdl region that shows Vglut2 mRNA labeling in the neuronal cytoplasm (Gray et al.) and FoxP2 (red) immunoreactivity in the nuclei of these neurons. (B): PBcl region that shows Vglut2 mRNA labeling in the cytoplasm (Gray et al.) and FoxP2 (red) immunoreactivity. (C): PBel-outer region that shows VGlut2 mRNA labeling (Gray et al.) and Lmx1b immunoreactivity in the nuclei of these cells (red).
Blood pressure experiments
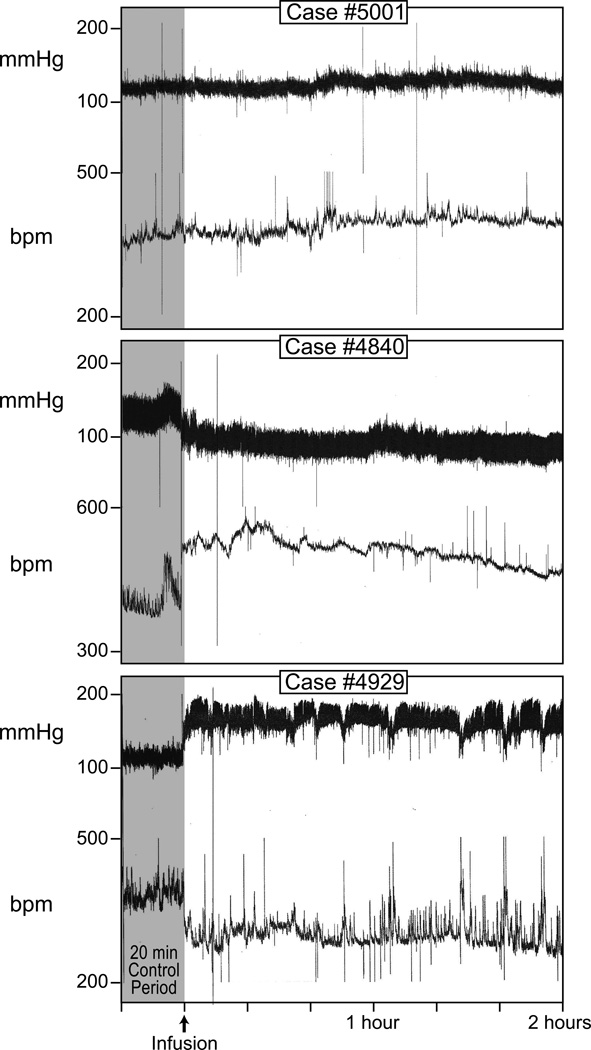
Fig. 4 presents chart records from three blood pressure (BP) experiments. The top panel shows a recording from a control rat that received a continuous intravenous infusion of sterile saline for 2 hours; no change in BP or heart rate occurred. The middle panel is from a rat that had a 2 hour period of sustained hypotension. During this period, as expected, this rat displayed a compensatory tachycardia. The bottom panel shows a record from a rat that had a 2 hour period of sustained hypertension, along with a compensatory bradycardia.
Figure 4.
Blood pressure and heart rate recordings from a saline-infused control rat, hypotensive rat, and hypertensive rat. All experiments were performed on conscious, unrestrained rats.
Fos-activation pattern in PB after hypotension
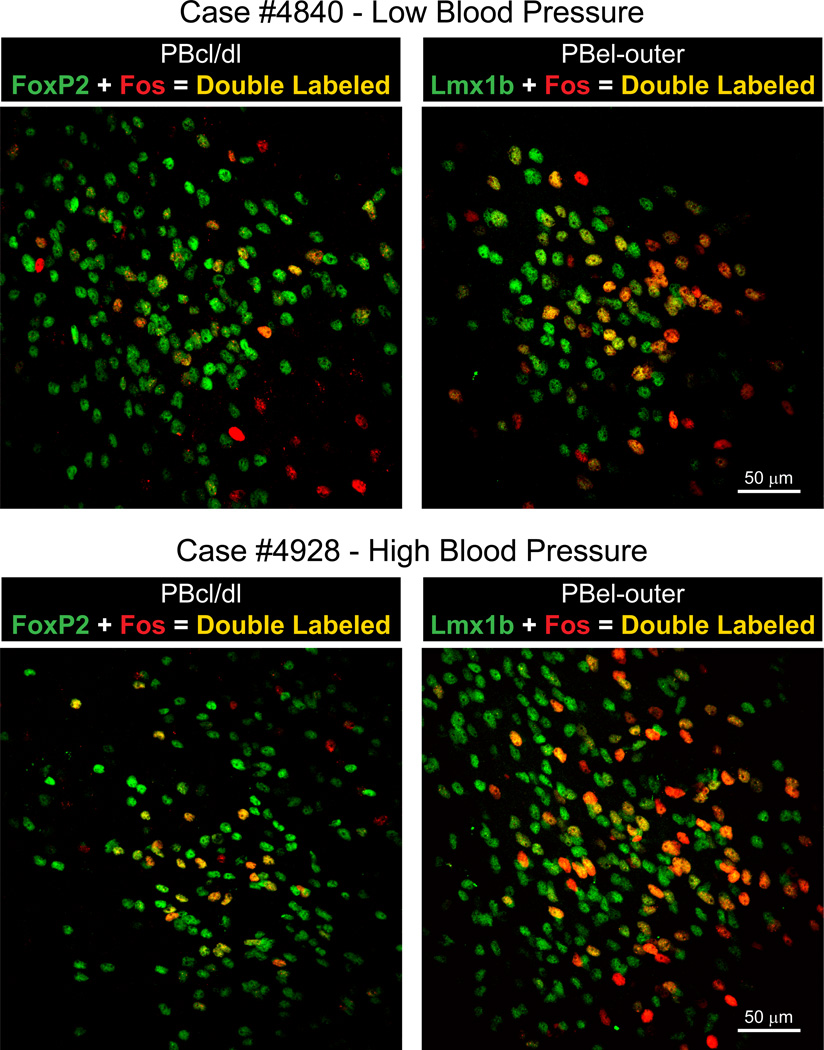
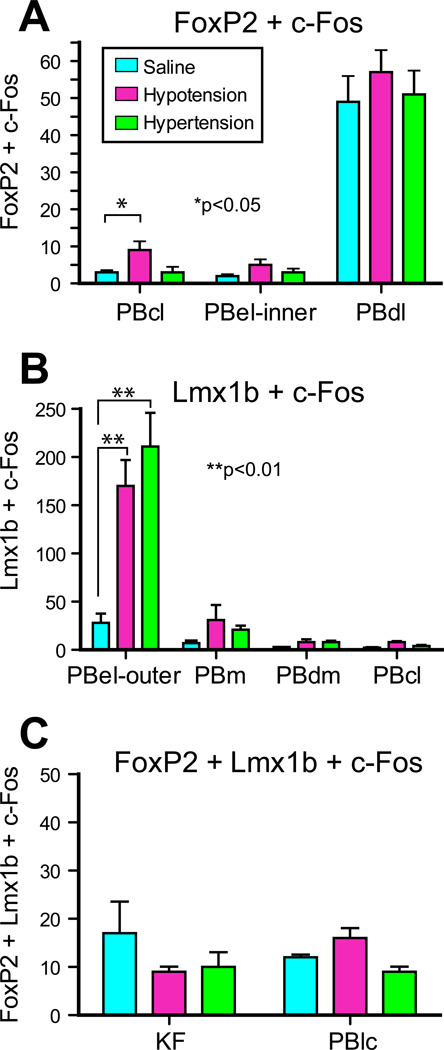
Fig. 5A shows the distribution of Fos-activated FoxP2+ neurons and Fig. 5B illustrates the pattern of Fos-activated Lmx1b+ neurons from a rat that had been maintained hypotensive for two hours. Photoimages of these findings are presented in Fig. 8. When these findings are compared to the control animals (Fig. 7), the only region with consistent Fos-activation of the FoxP2 neurons was the PBcl (9 ± 2 vs. 3 ± 0). This was best seen at the bregma −9.0 mm level. Other FoxP2 cell groups, such as the PBel-inner, appeared to have an increase number of Fos-activated neurons, but when this region was compared to the control material (Fig. 7), the two groups were not statistically different. Fig. 5B shows that there was a prominent Fos-activation of the Lmx1b neurons of the PBel-outer subdivision; these were statistically different from the control group 170 ± 27 vs. 28 ± 11). Other groups of Lmx1b neurons showed Fos-activation, such as the PBdm, PBcl, and PBm, but when they were compared to the control material, they were not statistically different. Figure 10 presents bar graphs of these data.
Figure 8.
Top Panels: Left side contains a photoimage of the PBcl/dl region from a hypotensive rat showing Fos-activated neurons (red), FoxP2+ neurons (Gray et al.), and co-labeled Fos & FoxP2+ neurons (yellow). Right side contains a photoimage of PBel-outer region from a hypotensive rat to show Fos-activated neurons (red), Lmx1b+ neurons (Gray et al.) and Fos & Lmx1b+ co-labeled neurons (yellow) neurons. Lower Panels: On the left is a photoimage of the PBcl/dl region from a hypertensive rat to show Fos-activated neurons (red), FoxP2+ neurons (Gray et al.), and co-labeled Fos & FoxP2+ neurons (yellow). On the right is a photoimage of PBel-outer region from a hypertensive rat to show Fos-activated neurons (red), Lmx1b+ (Gray et al.), and Fos & Lmx1b+ co-labeled neurons (yellow) neurons.
Figure 10.
Bar graphs showing the number of c-Fos activated FoxP2, Lmx1b, and co-expressing FoxP2 and Lmbx1 neurons in the individual parabrachial subnuclei. See list for Abbreviations.
Fos-activation pattern in PB after hypertension
The distribution of Fos-activated neurons in the PB region after two hours of hypertension is presented in Fig. 6A which shows a moderate concentration of Fos-activated FoxP2+ neurons in the PBcl (Fig. 8), but this change was not statistically different from the control group (3 ± 1 vs. 3 ± 0). On other hand, as shown in Figs. 6B and 8, a large concentration of Fos-activated Lmx1b+ neurons were seen the PBel-outer subdivision, and these results were statistically different than the control group (211 ± 35 vs. 28 ± 11). Other areas, such as the rostral PBcl, PBdm, and PBm, contained Fos-activated Lmx1b neurons but these subpopulations were not statistically different from the control group. Figure 10 summarizes these findings as bar graphs.
Figure 6.
Line drawings through the parabrachial nucleus illustrating the distribution pattern of Fos activation after two hours of hypertension. (A) Series of rostral to caudal drawings showing the distribution of Fos-activated neurons (red dots), FoxP2 neurons (green dots), and co-labeled Fos & FoxP2+ neurons (yellow stars). (B) These brainstem drawings to illustrate the distribution of Fos-activated neurons (red dots), Lmx1b+ neurons (blue dots), and co-labeled Fos & Lmx1b+ neurons (magenta stars). In Panel B, the bregma −9.0 and −9.25 levels had a large number of c-Fos activated Lmx1b+ neurons in the PBel-outer subgroup.
Fos-activation was present in the locus coeruleus, as defined by tyrosine hydroxylase immunoreactive neurons, in both the hypo- and hypertension experiments, but none of the locus coeruleus neurons expressed FoxP2 or Lmx1b.
Fos-activation in saline-infused and non saline-infused control rats
Fig. 7 illustrates the pattern of Fos-activation seen in a control animal that was infused with saline for 2 hours, and it had a relatively low number of Fos-activated neurons in the PB. The PBdl, however, had c-Fos activity that was higher than what we reported for normal rats (Geerling et al., 2011). The other control rats that had been only catheterized and not infused with saline had Fos-activity in the PBdl region as well. The data from the saline infused rats are presented as bar graphs in Figure 10.
Cell Counts
Fig. 9 shows the areas in the PB were templates were applied to obtain cell counts of the individual subnuclei that form the PB complex.
DISCUSSION
The present study demonstrates that the Lmx1b+ neurons of the PBel-outer subdivision are the major group of PB neurons that becomes activated during sustained blood pressure changes; they were activated during hypotension and hypertension. In addition, the FoxP2+ neurons of the PBcl were activated during hypotension, but not during hypertension. The in situ hybridization data revealed that the majority of PB neurons express Vglut2 mRNA, and thus, are glutamatergic neurons, and this includes both the FoxP2+ neurons of the PBcl and the Lmx1b neurons of the PBel-outer. However, we did not show that glutamatergic PB neurons per se become Fos-activated during blood pressure manipulations. Nevertheless, this needs to be tested directly. Similarly, it is highly probable that the blood pressure sensitive FoxP2+ and Lmx1b+ neurons are also glutamatergic neurons. Over 90% of the CGRP neurons in the PBel-outer also express Lmx1b, and these, too, probably use glutamate (and other chemicals) as a neurotransmitter.
A subset of FoxP2+ neurons in the PBdl were dynorphin A+; they reside in a restricted zone in the medial part of the PBdl that receives an input from the medial/commissural NTS (Herbert et al., 1990). The initial reason why we examined these neurons was our uncertaininty regarding the border between the FoxP2+ neurons in the PBdl versus PBcl at the Bregma −9.00 mm level. At more caudal levels, the distinction between the FoxP2+ neurons to the PBdl and Lmx1 neurons of the PBcl was clear. Studies by Blomqvist and colleagues suggested that the dynorphin A+ neurons were involved in processing nociceptive information (Hermanson et al., 1998). In the present study, we failed to show that these neurons were affected by blood pressure changes.
A comparison between the neuroanatomical studies describing the NTS→PB projections and the c-Fos data presented here reveals three potential areas where there was a mismatch between to the two sets of data. Prior to discussing these three differences, it is worth noting that the medial NTS is highly complex and does not solely process cardiovascular sensory information. For background to this discussion, Phaseolus vulgaris-leucoagglutinin (PHAL) axonal tracing studies have demonstrated that the medial and commissural NTS regions, which receive blood pressure afferents as well as sensory information from other general visceral systems including gastrointestinal and respiratory organs, project heavily to the PBel-outer, PBcl, and medial part of the PBdl (see Fig. 8 (Herbert et al., 1990). The medial NTS, but not the commissural NTS, projects weakly to the PBm, PBwa, and PBvl. Similar results were reported by Travers and co-workers (Karimnamazi et al., 2002). Here we showed that following hypo- or hypertension, the PBel-outer was strongly Fos-activated, and the PBcl was activated only after hypotension, but the other PB sites were not Fos-activated by blood pressure manipulations.
First, the dynorphin A+ PBdl displayed relatively high c-Fos activation pattern in our saline infused control material (Fig. 7) which initially was puzzling to us, especially because we did not see this type of c-Fos labeling in normal rats (Geerling et al 2011). Since the rats used in this study were conscious and ambulatory during the 2 hour test period, there surely was continuous somatosensory feedback from the limb and trunk skeletal muscles as well as from skin surfaces of the feet as the rats were engaged in foraging during this period; this type of motor activity was not seen in normal rats used in a previous study (Geerling et al., 2011). Presumably this feedback was transmitted from the dorsal horn to brainstem and thalamic sites. One of the brainstem sites that receives a strong input from the dorsal horn is the PBdl (Feil and Herbert, 1995). Thus, one potential explanation for the Fos-activation of the PBdl in the control rats was it may have been the result of ongoing ascending somatosensory activity. Another explanation could be that it was the result of due ongoing post-surgical pain since previous work showed peripheral pain results in c-Fos activity in the PBdl and other PB sites (Hermanson and Blomqvist, 1996, Buritova et al., 1998). However, as shown in the top panels of Fig. 7, there was minimal c-Fos activity in the rostral PB region, including the PBsl area– which is one of the nociceptive PB sites that becomes Fos-activated following peripheral pain (Hermanson and Blomqvist, 1996, Buritova et al., 1998). Finally, a third possible explanation for the Fosactivation of the PBdl region may that it was caused by the otolith activation and a subsequent excitation of the vestibuloparabrachial pathway (Porter and Balaban, 1997). Porter and Balaban (1997) reported that the vestibular nuclei provide a widespread input to the lateral PB, and the PB innervation arising from these nuclei appear to be more focused in the PBcl and PBel than the PBdl.
Second, the medial NTS projects to the dorsal part of the PBm and PBwa (see Fig. 8G in Herbert et al. (1990)), and these two latter sites have been implicated in gustatory functions. In the present experiments, we did not see c-Fos activity in these two PB sites. In addition, the commissural NTS, a general visceral processing region, does not project to these PB regions (Herbert et al, 1990). Thus, we suggest that the medial NTS projection to the PBwa and PBm represents a taste pathway which is carrying information from taste buds lying in the mucosa of the palatopharyngeal arch and pharynx first to the medial NTS, and then, this information is relayed to the PB. As shown earlier, these two organs send strong afferent inputs into the medial NTS, and they innervate a rather extensive length of the medial NTS which extends caudally to the level of the area postrema (Hayakawa et al., 2001). Thus, PHAL injections in the medial NTS, as presented by Herbert and co-workers (1990), would undoubtedly have labeled these gustatory NTS receptive neurons, and therefore, could account for the medial NTS projections of the PBm and PBwa.
The third mismatch between the axonal tracing data and our c-Fos results relates to the medial NTS projection to PBvl. Besides the NTS, a major input to the PBvl originates from the paratrigeminal nucleus (Feil and Herbert, 1995), which is a medullary cell group that receives primary afferent inputs from the pharynx, larynx, and trigeminal nerve (Saxon and Hopkins, 1998, 2006), and since the paratrigeminal nucleus is mainly involved in oral cavity and upper airway functions, this could explanation why we did not see Fos-activation in this region after blood pressure manipulations.
Over 90% of the lateral PB neurons that project to the perifornical and dorsomedial hypothalamic areas are glutamatergic (Niu et al., 2010)and based on our earlier work (Shin et al, 2011), this projection is likely to originate from the FoxP2+ neurons of the PBdl. In addition, we showed in this report that the Lmx1b+ neurons of the PBel-outer are glutamatergic. Previous work found the PBel neurons contain other neurotransmitters or neuromodulaters, including CGRP and neurotensin (Schwaber et al., 1988, Yamano et al., 1988, D'Hanis et al., 2007).
PB neurons become activated by a range of stimuli. For example, PBel neurons are activated by pain (Bernard and Besson, 1990, Bester et al., 1997, Richard et al., 2005), immune challenge (Engblom et al., 2001, 2004, Richard et al., 2005, Paues et al., 2006, Abulafia et al., 2009, Gaykema et al., 2009), anorexia (Ruud and Blomqvist, 2007), nausea (Yamamoto et al., 1994, Paues et al., 2006), and bitter taste (Yamamoto et al., 1994). The common feature of these neurons is that they respond to pathophysiological challenges, and thus, may be an important link to the forebrain that serves as general alarm system, which would trigger behavioral and autonomic/neuroendocrine adjustments.
One of the pathways by which the PBel may influence higher brain functions is via its extensive projections to the midline and intralaminar thalamic nuclei (Bester et al., 1999, Krout and Loewy, 2000); these thalamic sites have direct connections to the medial prefrontal, cingulate, and frontal areas of the cerebral cortex (Berendse and Groenewegen, 1991) and thus, provide an explanation of how this ascending pathway could influence cognitive functions. One such projection of note is the strong efferent connection from PBel to the caudal ventral medial thalamic nucleus (VMc) (Krout and Loewy, 2000). This projection may produce global cortical effects since the VMc provides widespread projections to layer I of the entire frontal regions of the cerebral cortex (Herkenham, 1979). Subsequent work has shown that nociceptive information is disseminated to the cerebral cortex in this widespread manner (Monconduit et al., 1999). A second pathway that may have an effect on higher brain functions is via the PBel projection to the paraventricular thalamic nucleus (Krout and Loewy, 2000). The paraventricular thalamic nucleus innervates the amygdala, hippocampus, and medial prefrontal cortex (Berendse and Groenewegen, 1991, Vertes and Hoover, 2008), and hence, may modulate a range of affective and cognitive functions.
Besides these cortical effects, the PBel may influence motor activity via its projection to the parafascicular thalamic nucleus; this thalamic nucleus provides very strong projection to the motor cortex (Berendse and Groenewegen, 1991). The parafascicular thalamic nucleus also projects heavily to the caudate-putamen, innervating the regions that effect the regions which modulate the neck, forelimb, trunk, and hindlimb muscles (Berendse and Groenewegen, 1990, Voorn et al., 2004). Whether the PBel neurons provide blood pressure related information into this somatosensory system is unknown, evidence now exists showing that the parafascicular thalamic nucleus receives vagal afferents (Ito and Craig, 2008) which perhaps serve to integrate cardiovascular and somatomotor functions.
Finally, the concept of the ‘ascending reticular formation’ as part of the arousal system is slowly being displaced with evidence showing that the PB, and its projections to the basal forebrain (viz., bed nucleus of stria terminalis and substantia innominata) play the critical role in cortical arousal (Fuller et al., 2011). This is a major shift in our understanding regarding the neural basis of arousal. It highlights the importance of the parabrachial nucleus in transmitting information to select forebrain regions, and several of the PB subnuclei, including the PBel, PBvl, PBcl, and PBm subgroups contribute to the ascending projections to the bed nucleus of the stria terminalis and substantia innominata (see Figure 6 in (Shin et al., 2011)).
The data presented by Shin and co-workers was focused on connections of the FoxP2 neurons of the PB that are part of the salt-sensing neural pathway. This behavior, also termed salt appetite, is dependent on a visceral sensory feedback system that provides information to forebrain areas that elict a well-defined behavorial drive – the search for salt (Geerling and Loewy, 2008). Severely salt-deprived animals would most certainly have heightened levels of arousal as they search for salt. Thus, sensory feedback from both somatosensory and the internal milieu (visceral sensory feedback) is relayed via connections in the parabrachial nucleus as well as to the nearby pre-locus coeruleus appear to be key neural groups that contribute to arousal processing mechanisms (Fuller et al., 2011, Shin et al., 2011).
CONCLUSIONS
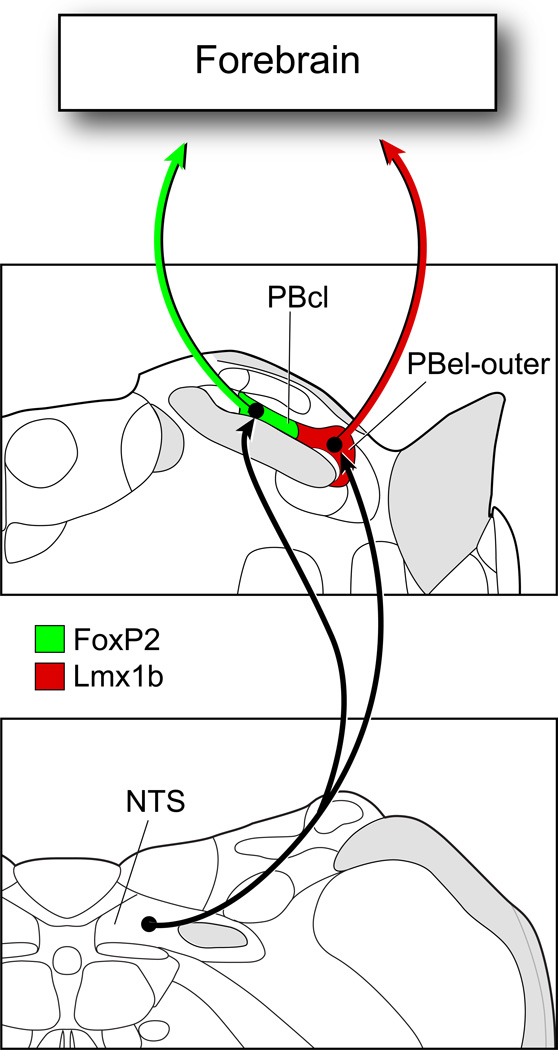
The PB can be defined into cytoarchitectonic subgroups in adult rats on the basis of the localization of FoxP2+ and Lmx1b+ neurons, and both groups of neurons project to the forebrain (Figure 11). In addition, mRNA for glutamate vesicular transporter Vglut2 was present in the majority of these neurons, suggesting that the bulk of the ascending projections arising from the PB may utilize glutamate, along with neuropeptides and other neurochemicals, as neuromodulators or transmitters. The Lmx1b+ neurons of the PBel-outer region were Fos-activated during hypo-and hypertension, and since the vast majority of neurons found in the PBel-outer are glutamatergic/CGRP+, this is likely to be an excitatory projection system that affects the forebrain. FoxP2+ neurons of the PBcl were activated by hypotension, and represent another group of glutamate-containing PB neurons which provide ascending projections to the forebrain, and at this time, there is no information on what other transmitters and neuromodulators may be present in these cells.
Figure 11.
The NTS projects to two blood pressure sensitive sites in the parabrachial nucleus: PBcl and PBel-outer. The former contains FoxP2+ neurons and the latter is made up of Lmx1b+ neurons. Most neurons localized in these two PB sites express Vglut2 mRNA, and thus, are presumed to be glutamatergic neurons. The Lmx1b+ neurons contain immunoreactive CGRP, while the presumed co-neurotransmitters of the FoxP2+ PBcl neurons are unknown. The FoxP2+ neurons in the PBcl were Fos-activated by hypotension, and the Lmx1b+ neurons of the PBelouter were activated by both hypotension and hypertension.
Highlights.
Parabrachial neurons express the transcription factors FoxP2 and Lmx1b
FoxP2 and Lmx1b neurons express glutamate vesicular transporter Vglut2
Hypertension and hypotension induce c-Fos activation of parabrachial neurons
Acknowledgements
We thank Julie Langasek, Laura A. Willingham, and Xay Van Nguyen for their technical assistance, Marcy Hartstein for constructing the computer graphics, and Dennis Oakley of the Bakewell Neuroimaging Laboratory at Washington University for assistance with confocal images. We thank C. Birchmeier, Y.-Q. Ding, and T.M. Jessell for the Lmx1b antibodies, and R. Stornetta for VGLUT2 probes. Special thanks go to Dr. Susan P. Travers for helpful discussions. This study was supported by National Institute of Heart, Lung, and Blood of the NIH, Grant numbers: HL-25449 (ADL), HL-089742 (PAG), DA0017371 (MMK), Bakewell Imaging Center Fund, and National Institutes of Health, Grant number NS057105, Neuroscience Blueprint Core Grant.
Abbreviations
- Atoh 1
atonal homolog 1
- BP
blood pressure
- CGRP
calcitonin gene related peptide
- FoxP2
Forkhead box protein 2
- Lmx1b
LIM homeodomain transcription factor 1 beta
- NTS
nucleus tractus solitarius
- PB
parabrachial nucleus
- PBcl
central lateral parabrachial nucleus
- PBdl
dorsal lateral parabrachial nucleus
- PBdm
dorsal medial parabrachial nucleus
- PBel
external lateral parabrachial nucleus
- PBem
external medial parabrachial nucleus
- PBil
internal lateral parabrachial nucleus
- PBlc
lateral crescent parabrachial nucleus
- PBm
medial parabrachial nucleus
- PBsl
superior lateral parabrachial nucleus
- PBvl
ventral lateral parabrachial nucleus
- PBwa
waist area of parabrachial nucleus
- PHAL
Phaseolus vulgaris leucoagglutinin
- RunX1
Runt-related transcription factor 1
- TF
transcription factor
- Vglut2
vesicular glutamate transporter 2
- VMc
caudal ventral medial thalamic nucleus
Footnotes
Publisher's Disclaimer: This is a PDF file of an unedited manuscript that has been accepted for publication. As a service to our customers we are providing this early version of the manuscript. The manuscript will undergo copyediting, typesetting, and review of the resulting proof before it is published in its final citable form. Please note that during the production process errors may be discovered which could affect the content, and all legal disclaimers that apply to the journal pertain.
Literature Cited
- Abulafia R, Zalkind V, Devor M. Cerebral activity during the anesthesia-like state induced by mesopontine microinjection of pentobarbital. J Neurosci. 2009;29:7053–7064. doi: 10.1523/JNEUROSCI.1357-08.2009. [DOI] [PMC free article] [PubMed] [Google Scholar]
- Berendse HW, Groenewegen HJ. Organization of the thalamostriatal projections in the rat, with special emphasis on the ventral striatum. The Journal of comparative neurology. 1990;299:187–228. doi: 10.1002/cne.902990206. [DOI] [PubMed] [Google Scholar]
- Berendse HW, Groenewegen HJ. Restricted cortical termination fields of the midline and intralaminar thalamic nuclei in the rat. Neuroscience. 1991;42:73–102. doi: 10.1016/0306-4522(91)90151-d. [DOI] [PubMed] [Google Scholar]
- Bernard JF, Besson JM. The spino(trigemino)pontoamygdaloid pathway: electrophysiological evidence for an involvement in pain processes. J Neurophysiol. 1990;63:473–490. doi: 10.1152/jn.1990.63.3.473. [DOI] [PubMed] [Google Scholar]
- Bester H, Bourgeais L, Villanueva L, Besson JM, Bernard JF. Differential projections to the intralaminar and gustatory thalamus from the parabrachial area: a PHA-L study in the rat. The Journal of comparative neurology. 1999;405:421–449. [PubMed] [Google Scholar]
- Bester H, Matsumoto N, Besson JM, Bernard JF. Further evidence for the involvement of the spinoparabrachial pathway in nociceptive processes: a c-Fos study in the rat. The Journal of comparative neurology. 1997;383:439–458. [PubMed] [Google Scholar]
- Blessing WW. The lower brainstem and bodily homeostasis. New York: Oxford University Press; 1997. [Google Scholar]
- Block CH, Hoffman GE. Neuropeptide and monoamine components of the parabrachial pontine complex. Peptides. 1987;8:267–283. doi: 10.1016/0196-9781(87)90102-1. [DOI] [PubMed] [Google Scholar]
- Buritova J, Besson JM, Bernard JF. Involvement of the spinoparabrachial pathway in inflammatory nociceptive processes: a c-Fos protein study in the awake rat. The Journal of comparative neurology. 1998;397:10–28. doi: 10.1002/(sici)1096-9861(19980720)397:1<10::aid-cne2>3.0.co;2-l. [DOI] [PubMed] [Google Scholar]
- D'Hanis W, Linke R, Yilmazer-Hanke DM. Topography of thalamic and parabrachial calcitonin gene-related peptide (CGRP) immunoreactive neurons projecting to subnuclei of the amygdala and extended amygdala. The Journal of comparative neurology. 2007;505:268–291. doi: 10.1002/cne.21495. [DOI] [PubMed] [Google Scholar]
- Dampney RA. Functional organization of central pathways regulating the cardiovascular system. Physiol Rev. 1994;74:323–364. doi: 10.1152/physrev.1994.74.2.323. [DOI] [PubMed] [Google Scholar]
- Engblom D, Ek M, Ericsson-Dahlstrand A, Blomqvist A. Activation of prostanoid EP(3) and EP(4) receptor mRNA-expressing neurons in the rat parabrachial nucleus by intravenous injection of bacterial wall lipopolysaccharide. The Journal of comparative neurology. 2001;440:378–386. doi: 10.1002/cne.1391. [DOI] [PubMed] [Google Scholar]
- Engblom D, Ek M, Ericsson-Dahlstrand A, Blomqvist A. EP3 and EP4 receptor mRNA expression in peptidergic cell groups of the rat parabrachial nucleus. Neuroscience. 2004;126:989–999. doi: 10.1016/j.neuroscience.2004.03.042. [DOI] [PubMed] [Google Scholar]
- Feil K, Herbert H. Topographic organization of spinal and trigeminal somatosensory pathways to the rat parabrachial and Kolliker-Fuse nuclei. The Journal of comparative neurology. 1995;353:506–528. doi: 10.1002/cne.903530404. [DOI] [PubMed] [Google Scholar]
- Fuller PM, Sherman D, Pedersen NP, Saper CB, Lu J. Reassessment of the structural basis of the ascending arousal system. The Journal of comparative neurology. 2011;519:933–956. doi: 10.1002/cne.22559. [DOI] [PMC free article] [PubMed] [Google Scholar]
- Fulwiler CE, Saper CB. Subnuclear organization of the efferent connections of the parabrachial nucleus in the rat. Brain Res Rev. 1984;7:229–259. doi: 10.1016/0165-0173(84)90012-2. [DOI] [PubMed] [Google Scholar]
- Gaykema RP, Daniels TE, Shapiro NJ, Thacker GC, Park SM, Goehler LE. Immune challenge and satiety-related activation of both distinct and overlapping neuronal populations in the brainstem indicate parallel pathways for viscerosensory signaling. Brain research. 2009;1294:61–79. doi: 10.1016/j.brainres.2009.07.076. [DOI] [PMC free article] [PubMed] [Google Scholar]
- Geerling JC, Loewy AD. Sodium deprivation and salt intake activate separate neuronal subpopulations in the nucleus of the solitary tract and the parabrachial complex. The Journal of comparative neurology. 2007;504:379–403. doi: 10.1002/cne.21452. [DOI] [PubMed] [Google Scholar]
- Geerling JC, Loewy AD. Central regulation of sodium appetite. Exp Physiol. 2008;93:177–209. doi: 10.1113/expphysiol.2007.039891. [DOI] [PubMed] [Google Scholar]
- Geerling JC, Stein MK, Miller RL, Shin JW, Gray PA, Loewy AD. FoxP2 expression defines dorsolateral pontine neurons activated by sodium deprivation. Brain research. 2011;1375:19–27. doi: 10.1016/j.brainres.2010.11.028. [DOI] [PMC free article] [PubMed] [Google Scholar]
- Goodchild AK, Moon EA. Maps of cardiovascular and respiratory regions of rat ventral medulla: focus on the caudal medulla. J Chem Neuroanat. 2009;38:209–221. doi: 10.1016/j.jchemneu.2009.06.002. [DOI] [PubMed] [Google Scholar]
- Graham JC, Hoffman GE, Sved AF. c-Fos expression in brain in response to hypotension and hypertension in conscious rats. J Auton Nerv Syst. 1995;55:92–104. doi: 10.1016/0165-1838(95)00032-s. [DOI] [PubMed] [Google Scholar]
- Gray PA. Transcription factors and the genetic organization of brain stem respiratory neurons. J Appl Physiol. 2008;104:1513–1521. doi: 10.1152/japplphysiol.01383.2007. [DOI] [PubMed] [Google Scholar]
- Gray PA, Fu H, Luo P, Zhao Q, Yu J, Ferrari A, Tenzen T, Yuk DI, Tsung EF, Cai Z, Alberta JA, Cheng LP, Liu Y, Stenman JM, Valerius MT, Billings N, Kim HA, Greenberg ME, McMahon AP, Rowitch DH, Stiles CD, Ma Q. Mouse brain organization revealed through direct genome-scale TF expression analysis. Science. 2004;306:2255–2257. doi: 10.1126/science.1104935. [DOI] [PubMed] [Google Scholar]
- Guo ZL, Moazzami AR, Longhurst JC. Stimulation of cardiac sympathetic afferents activates glutamatergic neurons in the parabrachial nucleus: relation to neurons containing nNOS. Brain research. 2005;1053:97–107. doi: 10.1016/j.brainres.2005.06.051. [DOI] [PubMed] [Google Scholar]
- Guyenet PG. The sympathetic control of blood pressure. Nat Rev Neurosci. 2006;7:335–346. doi: 10.1038/nrn1902. [DOI] [PubMed] [Google Scholar]
- Hayakawa T, Takanaga A, Maeda S, Seki M, Yajima Y. Subnuclear distribution of afferents from the oral, pharyngeal and laryngeal regions in the nucleus tractus solitarii of the rat: a study using transganglionic transport of cholera toxin. Neurosci Res. 2001;39:221–232. doi: 10.1016/s0168-0102(00)00218-2. [DOI] [PubMed] [Google Scholar]
- Herbert H, Moga MM, Saper CB. Connections of the parabrachial nucleus with the nucleus of the solitary tract and the medullary reticular formation in the rat. The Journal of comparative neurology. 1990;293:540–580. doi: 10.1002/cne.902930404. [DOI] [PubMed] [Google Scholar]
- Herbert H, Saper CB. Cholecystokinin-, galanin-, and corticotropin-releasing factor-like immunoreactive projections from the nucleus of the solitary tract to the parabrachial nucleus in the rat. The Journal of comparative neurology. 1990;293:581–598. doi: 10.1002/cne.902930405. [DOI] [PubMed] [Google Scholar]
- Herkenham M. The afferent and efferent connections of the ventromedial thalamic nucleus in the rat. The Journal of comparative neurology. 1979;183:487–517. doi: 10.1002/cne.901830304. [DOI] [PubMed] [Google Scholar]
- Hermanson O, Blomqvist A. Subnuclear localization of FOS-like immunoreactivity in the rat parabrachial nucleus after nociceptive stimulation. The Journal of comparative neurology. 1996;368:45–56. doi: 10.1002/(SICI)1096-9861(19960422)368:1<45::AID-CNE4>3.0.CO;2-K. [DOI] [PubMed] [Google Scholar]
- Hermanson O, Telkov M, Geijer T, Hallbeck M, Blomqvist A. Preprodynorphin mRNA-expressing neurones in the rat parabrachial nucleus: subnuclear localization, hypothalamic projections and colocalization with noxious-evoked fos-like immunoreactivity. Eur J Neurosci. 1998;10:358–367. doi: 10.1046/j.1460-9568.1998.00021.x. [DOI] [PubMed] [Google Scholar]
- Ito S, Craig AD. Striatal projections of the vagal-responsive region of the thalamic parafascicular nucleus in macaque monkeys. The Journal of comparative neurology. 2008;506:301–327. doi: 10.1002/cne.21513. [DOI] [PubMed] [Google Scholar]
- Karimnamazi H, Travers SP, Travers JB. Oral and gastric input to the parabrachial nucleus of the rat. Brain research. 2002;957:193–206. doi: 10.1016/s0006-8993(02)03438-8. [DOI] [PubMed] [Google Scholar]
- Krout KE, Loewy AD. Parabrachial nucleus projections to midline and intralaminar thalamic nuclei of the rat. J Comp Neurol. 2000;428:475–494. doi: 10.1002/1096-9861(20001218)428:3<475::aid-cne6>3.0.co;2-9. [DOI] [PubMed] [Google Scholar]
- Li YW, Dampney RA. Expression of Fos-like protein in brain following sustained hypertension and hypotension in conscious rabbits. Neuroscience. 1994;61:613–634. doi: 10.1016/0306-4522(94)90439-1. [DOI] [PubMed] [Google Scholar]
- Loewy AD. Central autonomic pathways. In: Loewy AD, Spyer KM, editors. Central Regulation of Autnomic Functions. New York: Oxford Univ Press; 1990. pp. 88–103. [Google Scholar]
- Miller RL, Stein MK, Loewy AD. Serotonergic inputs to FoxP2 neurons of the pre-locus coeruleus and parabrachial nuclei that project to the ventral tegmental area. Neuroscience. 2011;193:229–240. doi: 10.1016/j.neuroscience.2011.07.008. [DOI] [PMC free article] [PubMed] [Google Scholar]
- Monconduit L, Bourgeais L, Bernard JF, Le Bars D, Villanueva L. Ventromedial thalamic neurons convey nociceptive signals from the whole body surface to the dorsolateral neocortex. J Neurosci. 1999;19:9063–9072. doi: 10.1523/JNEUROSCI.19-20-09063.1999. [DOI] [PMC free article] [PubMed] [Google Scholar]
- Niu JG, Yokota S, Tsumori T, Qin Y, Yasui Y. Glutamatergic lateral parabrachial neurons innervate orexin-containing hypothalamic neurons in the rat. Brain research. 2010;1358:110–122. doi: 10.1016/j.brainres.2010.08.056. [DOI] [PubMed] [Google Scholar]
- Paues J, Mackerlova L, Blomqvist A. Expression of melanocortin-4 receptor by rat parabrachial neurons responsive to immune and aversive stimuli. Neuroscience. 2006;141:287–297. doi: 10.1016/j.neuroscience.2006.03.041. [DOI] [PubMed] [Google Scholar]
- Paxinos G, Watson C. The rat brain in stereotaxic coordinates. Amsterdam: Elsevier; 2005. [DOI] [PubMed] [Google Scholar]
- Pilowsky PM, Goodchild AK. Baroreceptor reflex pathways and neurotransmitters: 10 years on. J Hypertens. 2002;20:1675–1688. doi: 10.1097/00004872-200209000-00002. [DOI] [PubMed] [Google Scholar]
- Porter JD, Balaban CD. Connections between the vestibular nuclei and brain stem regions that mediate autonomic function in the rat. J Vestib Res. 1997;7:63–76. [PubMed] [Google Scholar]
- Potts PD, Ludbrook J, Gillman-Gaspari TA, Horiuchi J, Dampney RA. Activation of brain neurons following central hypervolaemia and hypovolaemia: contribution of baroreceptor and non-baroreceptor inputs. Neuroscience. 2000;95:499–511. doi: 10.1016/s0306-4522(99)00426-1. [DOI] [PubMed] [Google Scholar]
- Potts PD, Polson JW, Hirooka Y, Dampney RA. Effects of sinoaortic denervation on Fos expression in the brain evoked by hypertension and hypotension in conscious rabbits. Neuroscience. 1997;77:503–520. doi: 10.1016/s0306-4522(96)00459-9. [DOI] [PubMed] [Google Scholar]
- Richard S, Engblom D, Paues J, Mackerlova L, Blomqvist A. Activation of the parabrachio-amygdaloid pathway by immune challenge or spinal nociceptive input: a quantitative study in the rat using Fos immunohistochemistry and retrograde tract tracing. The Journal of comparative neurology. 2005;481:210–219. doi: 10.1002/cne.20384. [DOI] [PubMed] [Google Scholar]
- Rocha MJ, Herbert H. c-fos expression in the parabrachial nucleus following cardiovascular and blood volume changes. J Hirnforsch. 1996;37:389–397. [PubMed] [Google Scholar]
- Ruud J, Blomqvist A. Identification of rat brainstem neuronal structures activated during cancer-induced anorexia. The Journal of comparative neurology. 2007;504:275–286. doi: 10.1002/cne.21407. [DOI] [PubMed] [Google Scholar]
- Saxon DW, Hopkins DA. Efferent and collateral organization of paratrigeminal nucleus projections: an anterograde and retrograde fluorescent tracer study in the rat. The Journal of comparative neurology. 1998;402:93–110. [PubMed] [Google Scholar]
- Saxon DW, Hopkins DA. Ultrastructure and synaptology of the paratrigeminal nucleus in the rat: primary pharyngeal and laryngeal afferent projections. Synapse. 2006;59:220–234. doi: 10.1002/syn.20233. [DOI] [PubMed] [Google Scholar]
- Schwaber JS, Sternini C, Brecha NC, Rogers WT, Card JP. Neurons containing calcitonin gene-related peptide in the parabrachial nucleus project to the central nucleus of the amygdala. The Journal of comparative neurology. 1988;270:416–426. 398–419. doi: 10.1002/cne.902700310. [DOI] [PubMed] [Google Scholar]
- Shin JW, Geerling JC, Stein MK, Miller RL, Loewy AD. FoxP2 brainstem neurons project to sodium appetite regulatory sites. J Chem Neuroanat. 2011;42:1–23. doi: 10.1016/j.jchemneu.2011.05.003. [DOI] [PMC free article] [PubMed] [Google Scholar]
- Stein MK, Loewy AD. Area postrema projects to FoxP2 neurons of the pre-locus coeruleus and parabrachial nuclei: brainstem sites implicated in sodium appetite regulation. Brain research. 2010;1359:116–127. doi: 10.1016/j.brainres.2010.08.085. [DOI] [PMC free article] [PubMed] [Google Scholar]
- Stornetta RL, Sevigny CP, Guyenet PG. Vesicular glutamate transporter DNPI/VGLUT2 mRNA is present in C1 and several other groups of brainstem catecholaminergic neurons. The Journal of comparative neurology. 2002;444:191–206. doi: 10.1002/cne.10141. [DOI] [PubMed] [Google Scholar]
- Uhl GR, Goodman RR, Kuhar MJ, Childers SR, Snyder SH. Immunohistochemical mapping of enkephalin containing cell bodies, fibers and nerve terminals in the brain stem of the rat. Brain research. 1979;166:75–94. doi: 10.1016/0006-8993(79)90651-6. [DOI] [PubMed] [Google Scholar]
- Vertes RP, Hoover WB. Projections of the paraventricular and paratenial nuclei of the dorsal midline thalamus in the rat. The Journal of comparative neurology. 2008;508:212–237. doi: 10.1002/cne.21679. [DOI] [PubMed] [Google Scholar]
- Voorn P, Vanderschuren LJ, Groenewegen HJ, Robbins TW, Pennartz CM. Putting a spin on the dorsal-ventral divide of the striatum. Trends Neurosci. 2004;27:468–474. doi: 10.1016/j.tins.2004.06.006. [DOI] [PubMed] [Google Scholar]
- Ward DG. Neurons in the parabrachial nuclei respond to hemorrhage. Brain research. 1989;491:80–92. doi: 10.1016/0006-8993(89)90089-9. [DOI] [PubMed] [Google Scholar]
- Westberg L, Sawa E, Wang AY, Gunaydin LA, Ribeiro AC, Pfaff DW. Colocalization of connexin 36 and corticotropin-releasing hormone in the mouse brain. BMC Neurosci. 2009;10:41. doi: 10.1186/1471-2202-10-41. [DOI] [PMC free article] [PubMed] [Google Scholar]
- Yamamoto T, Shimura T, Sakai N, Ozaki N. Representation of hedonics and quality of taste stimuli in the parabrachial nucleus of the rat. Physiol Behav. 1994;56:1197–1202. doi: 10.1016/0031-9384(94)90366-2. [DOI] [PubMed] [Google Scholar]
- Yamano M, Hillyard CJ, Girgis S, Emson PC, MacIntyre I, Tohyama M. Projection of neurotensin-like immunoreactive neurons from the lateral parabrachial area to the central amygdaloid nucleus of the rat with reference to the coexistence with calcitonin gene-related peptide. Exp Brain Res. 1988;71:603–610. doi: 10.1007/BF00248753. [DOI] [PubMed] [Google Scholar]
- Zagami CJ, Stifani S. Molecular characterization of the mouse superior lateral parabrachial nucleus through expression of the transcription factor Runx1. PLoS One. 2010;5:e13944. doi: 10.1371/journal.pone.0013944. [DOI] [PMC free article] [PubMed] [Google Scholar]


