Abstract
During breathing, lung inflation is a dynamic process involving a balance of mechanical factors, including trans-pulmonary pressure gradients, tissue compliance and airway resistance. Current techniques lack the capacity for dynamic measurement of ventilation in vivo at sufficient spatial and temporal resolution to allow the spatio-temporal patterns of ventilation to be precisely defined. As a result, little is known of the regional dynamics of lung inflation, in either health or disease. Using fast synchrotron-based imaging (up to 60 frames s−1), we have combined dynamic computed tomography (CT) with cross-correlation velocimetry to measure regional time constants and expansion within the mammalian lung in vivo. Additionally, our new technique provides estimation of the airflow distribution throughout the bronchial tree during the ventilation cycle. Measurements of lung expansion and airflow in mice and rabbit pups are shown to agree with independent measures. The ability to measure lung function at a regional level will provide invaluable information for studies into normal and pathological lung dynamics, and may provide new pathways for diagnosis of regional lung diseases. Although proof-of-concept data were acquired on a synchrotron, the methodology developed potentially lends itself to clinical CT scanning and therefore offers translational research opportunities.
Keywords: tomography, phase contrast, imaging, lung function, velocimetry
1. Introduction
Studies into lung function have focused on regional differences in ventilation, but little is known about the temporal patterns of inflation. Spatial variation in mechanical properties, such as airway resistance, lung tissue compliance and differential compliance of chest-wall components, affects both the degree of regional ventilation and the temporal patterns of inflation and deflation. The system is further complicated by the nonlinear stiffness properties of the lung parenchyma, which displays an increasing stiffness with increasing strain [1,2].
The lack of experimental research into dynamic lung function is due to the inability of current measurement techniques to provide adequate temporal and spatial resolution to accurately characterize the dynamics of the breathing lung. Global techniques such as spirometry and gas wash-out methods offer high temporal resolution but yield little spatial information. Electrical impedance tomography [3–5] suffers from poor spatial resolution, is unable to provide morphological information and is typically limited to measurements within a two-dimensional transverse slice. Magnetic resonance imaging [6,7] and positron emission tomography [8,9] have been used for three-dimensional lung imaging and also motion measurement; however, both suffer from relatively poor spatial and temporal resolution, and require the introduction of contrast agents [10–12].
Computed tomography (CT) has long been the gold standard for high-resolution medical imaging, and is typically performed on static samples to reduce motion artefacts. Thus, application to lung function, which is inherently characterized by lung motion, has been hindered by a lack of temporal resolution, although this is increasingly being addressed by multi-detector scanners and by techniques that allow respiratory gating. Regional expansion has been measured by registration-based techniques [13–16]. However, owing to the lack of dynamic imaging capacity, previous studies have resorted to inferring information from static breath-hold images, which are unlikely to contain information on the dynamics of pulmonary function. Clinical four-dimensional CT techniques, which make use of respiratory gating, have been recently developed to dynamically image the human lung for radiotherapy planning applications. Nevertheless, these studies have achieved a temporal resolution of 0.4 s at best [17–19].
Synchrotron X-ray sources, because of their brightness and coherence, are able to provide dynamic, high-resolution imaging of the lung during breathing through the use of phase-contrast imaging [20–22]. Lung tissue is an ideal sample for this technology, consisting of small air-filled sacs surrounded by soft tissue. This structure provides many air–tissue interfaces, which exhibit sharp refractive index gradients, on which the edge enhancement of phase-contrast imaging is most effective.
We have developed and implemented in vivo, dynamic CT of the lung by using the advantages of synchrotron phase-contrast imaging. The high signal-to-noise ratio achieved by phase contrast, combined with the brightness of the synchrotron X-ray source, resulted in imaging of the lung at up to 60 frames s−1. We combined this imaging with CT reconstruction to provide dynamic four-dimensional imaging of the lung. Although synchrotron radiation provides the ability to deliver unparalleled spatial and temporal resolution, the methodology developed in this proof-of-concept study can potentially be translated into the clinical domain using high-resolution four-dimensional-CT protocols on high-end multi-detector scanners.
A post-processing procedure was developed to measure dynamic functional information within the lung. Time-resolved measurements of tissue motion and expansion were acquired using cross-correlation velocimetry. Expiratory time constant, a common clinical measure of respiratory function, was calculated directly from the measured expansion on a regional basis. By allocating regions of tissue to their corresponding supplying airways, the flow of air throughout the airways was estimated. Verification and error estimation is presented for each stage in the methodology.
The newly developed technique was applied to the measurement of lung motion, local expansion and regional time constants in situ, in both mice and mechanically ventilated newborn rabbits using the medical imaging beamline BL20B2 at the SPring-8 Synchrotron, Japan.
2. Material and methods
2.1. Imaging
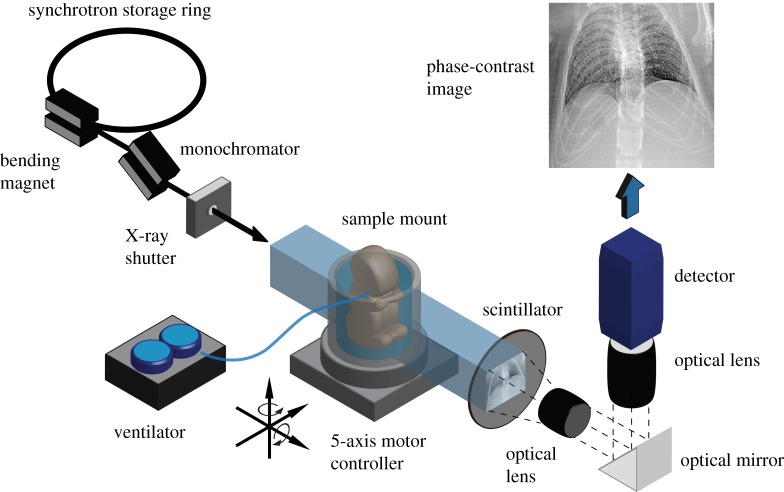
Phase-contrast images were acquired at the SPring-8 synchrotron, Japan. Figure 1 illustrates the experimental set-up. X-rays are generated at the BL20B2 beam-line using a bending magnet source. The X-ray beam then passes through a monochromator crystal (Si-111) tuned to deliver a monochromatic X-ray beam at 24 keV. An X-ray shutter is used to minimize the delivered radiation dose between image acquisitions. A large source-to-sample distance of approximately 210 m ensures that the X-rays can be considered to be a parallel plane wave. Images were acquired using a Hamamatsu X-ray converter (BM5). The X-rays transmit through the sample onto a scintillator (P43), which converts the X-ray photons into the visible spectrum. The visible light generated by the scintillator is imaged using an optical lens configuration and detector. A mirror is used to remove the detector from the path of the X-ray beam to avoid damage to the sensor.
Figure 1.
Schematic of the imaging set-up. Monochromatic X-rays transmit through the sample onto a scintillator, which is imaged using an optical detector system. The animal, ventilated using a self-developed ventilator system, is positioned and aligned using a 5-axis robotic stage. A fast X-ray shutter is used for dose minimization.
During imaging, the animal is placed upright in a self-developed holder, which is mounted on a 5-axis motor controller. This allows precise alignment and rotation of the sample to reduce artefacts in the subsequent tomographic reconstructions. A custom-designed ventilator, based on the device described by Kitchen et al. [23] provides stable, pressure-controlled ventilation, and provides triggering to the imaging system for synchronization with the ventilation cycle.
The animal is ventilated continuously at constant inspiratory pressure (pi), expiratory pressure (pe), inspiration time (ti) and expiration time (te). Imaging is synchronized with the ventilator, so that images are acquired at specific time points within the ventilation cycle. During imaging, the animal is rotated through 180° with respect to the imaging axis, providing projection images at specific time points throughout the ventilation cycle, at multiple projection angles. In other words, a CT scan for each specified time point within the ventilation cycle is acquired. Typically, parameters were chosen so that approximately 400 projections were acquired for each time point.
Radiation dose is an important consideration for in vivo X-ray CT. The dose delivered during imaging at an energy of 24 keV on the beamline used is approximately 2 mGy s−1 [24,25]. Therefore, each time point (equating to 400 images at an approx. 20 ms exposure time) imparts a radiation dose of approximately 16 mGy. This is approximately 5–10 times lower than a typical small animal micro-CT scan [26,27]. The dose delivered during a scan (up to 50 time points) is therefore well below the dose threshold for radiation-induced lung damage, which is around 10–15 Gy [26].
2.2. Animal experimental procedures
Two animal models were used for this study. Measurements were performed on C57BL6 adult male mice (n = 3; denoted M1, M2 and M3) for verification and error estimation of the airflow and tissue expansion measurement procedure. Measurement of tissue expansion, local time constant and flow throughout the bronchial tree was performed on a newborn rabbit pup (New Zealand white)—a common model for neonatal lung studies [20,28].
Mice were anaesthetized with Somnopentyl (pentobarbitone sodium; i.p. 70 mg kg−1), orally intubated with an endotracheal tube and placed upright in a custom sample mount. Anaesthesia was maintained during imaging using a constant infusion (pentobarbitone sodium; i.p. 0.012 mg min−1). A self-developed inline flowmeter was used to measure airflow at the mouth during mechanical ventilation via non-surgical intubation. The flowmeter consisted of a small orifice and differential pressure transducer. The pressure drop across the orifice is measured, which corresponds to the flowrate through the flowmeter. The flowmeter is calibrated prior to imaging, using a syringe pump (Harvard Apparatus PHD 2000) to provide an accurate reference flow. The inherent error within the calibration was tested and the flowmeter was found to be accurate to 0.1 ml s−1 (r.m.s.) in the range −1.0 to 1.0 ml s−1. Conventional positive pressure ventilation was used to ventilate the mice with parameters of pi/pe = 16/3 cmH20 and ti/te = 0.3/0.6 s. Images were captured at either 50 frames per breath at 60 frames s−1 (M1), or 35 frames per breath at 50 frames s−1 (M2, M3), triggered at the start of inspiration. Images were acquired using a Hamamatsu X-ray converter (BM5) in conjunction with a CMOS detector (SA2, Photron, USA).
Pregnant New Zealand white rabbits were anaesthetized by intravenous injection of propofol (Rapinovet; 12 mg kg−1 bolus) and intubated. Anaesthesia was maintained by isoflourane inhalation (1.5–4%). Pups were delivered by Caesarean section and sedated (Nembutal; i.p. 0.1 mg), placed in a pre-warmed water bath and ventilated via surgical intubation with an endotracheal tube, as previously described [20,28]. The water bath was necessary to keep the pup warm and comfortable during imaging procedure. This resulted in a slightly reduced imaging rate when compared with the mouse experiments, owing to the attenuation of the water. Conventional positive pressure ventilation was used, with a ti and te of 1 s and 1.5 s, respectively. Inspiratory and expiratory pressures were 27 cmH2O and 5 cmH2O, respectively. Images were acquired at 20 time points within the breathing cycle: 10 during inspiration and 10 during expiration, triggered at the start of inspiration and expiration, respectively, and at a rate of 34.5 frames s−1, capturing the most rapidly changing portions of the ventilation cycle. Images were acquired using a Hamamatsu X-ray converter equipped with an EMCCD detector (C9100-02).
2.3. Image analysis
A flowchart of the analysis procedure is shown in figure 2. Four-dimensional movies of the lung morphology are reconstructed from the acquired images. These movies are used to calculate the tissue velocity fields, tissue expansion fields and to segment the airway network for the entire ventilation cycle. The airflow distribution is then calculated by associating regions of tissue with their corresponding supplying airways.
Figure 2.
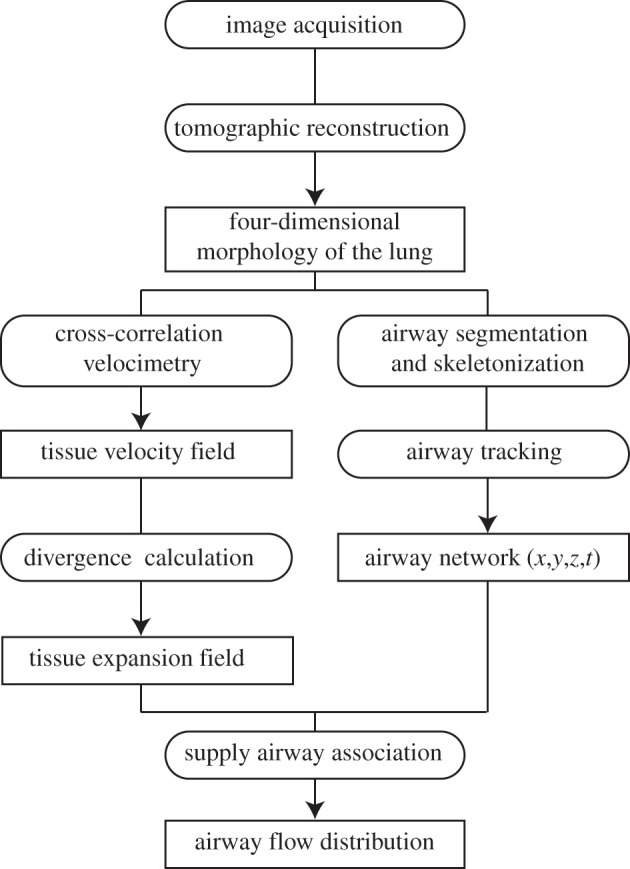
Flowchart of the image analysis. Four-dimensional movies of the lung morphology are reconstructed from the acquired images. These movies are used to calculate the tissue velocity fields, tissue expansion fields and to segment the airway network for the entire ventilation cycle. The airflow distribution is then calculated by associating regions of tissue with their corresponding supplying airways.
2.3.1. Motion and expansion measurement
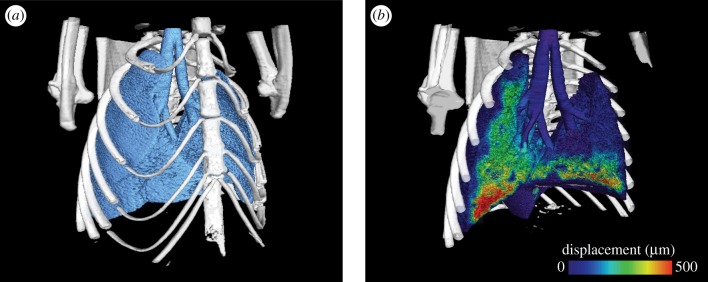
Images from each time point were collated and reconstructed. As the image acquisition was synchronized with the ventilation, the point in the breath for which each image was acquired is known. It is therefore a simple procedure to collate the images into their respective time points. Images first undergo a flat-dark correction, followed by single-image phase retrieval [29]. An algebraic tomographic reconstruction was then performed at each time point to yield a four-dimensional movie of the morphology of the lungs (figure 3a; electronic supplementary material, movie S1). The simultaneous algebraic reconstruction technique (sART) [30] was used for reconstruction, owing to its simplicity and the ability to perform accurate reconstructions with relatively few projections. However, any standard tomography method, including filtered back-projection, could be used with similar results.
Figure 3.
(a) Three-dimensional representation of lung morphology and (b) total lung tissue displacement at the end-inspiration for a single time point (end-inspiration) of the four-dimensional dataset for mouse M1. Measurements were acquired at 60 frames s−1, and with a voxel size of 20 µm. Tissue displacement is shown as the total displacement from end-expiration, and half of the data are rendered as transparent to allow visualization. The full movie of both lung morphology and tissue displacement can be viewed in the electronic supplementary material.
The expansion of the lung tissue was calculated using a technique based on the discipline of particle image velocimetry (PIV). PIV is routinely used in fluid mechanics studies to accurately measure the velocity of tracer particles within a fluid flow, traditionally in two dimensions [31], but has recently been expanded to be three-dimensional [32]. The basic principle is as follows: corresponding regions (known as interrogation regions) of images acquired at a known time interval are cross-correlated. The position of the maximum in the correlation map will be equal to the most common inter-frame displacement of the particles within the interrogation region. Division of the displacement by the known interframe time interval yields velocity. Lung tissue is well suited to this form of analysis as it consists of many small airsacs, providing a high density of information with which to track the motion. In this way, the airsacs act, in place of the particles, as motion tracers. The cross-correlation analysis was performed in three dimensions. Cross-correlation was performed on interrogation regions of the images between consecutive frames. These regions, cubes of 64 × 64 × 64 voxels, were spaced regularly on a rectangular grid with eight voxels between the location of the centre of each interrogation region. An iterative approach was used, whereby the first iteration provides an estimate of the displacement, and subsequent iterations are performed with the second image region being offset by this estimate [33], reducing the errors associated with parts of tissue leaving the interrogation region. The universal outlier detection method [34] was employed to eliminate errors owing to spurious measurements. The PIV analysis thus yields the displacement and velocity of the lung tissue throughout the breath (figure 3b; electronic supplementary material, movie S3).
An alternative approach for tissue displacement measurement may also be used, in which a single CT scan is acquired as a morphological reference, and tissue velocity is measured using the method recently developed by the authors—computed tomographic X-ray velocimetry (CTXV) [35,36]. This approach is capable of providing accurate tissue displacement information from a very low number of projections, with significant reductions in radiation dose imparted to the sample.
The lung tissue rate of expansion was calculated as the divergence of the velocity field:
| 2.1 |
where vx, vy and vz are the tissue velocity in the x, y and z directions.
Assuming that both the air inside the lung, and the tissue itself, is incompressible, the expansion calculated directly represents airflow into and out of these lung regions. The partial derivatives in equation (2.1) were calculated using a two-step procedure: a polynomial is fitted to the velocity data via least-square analysis, followed by analytical differentiation of the fitting polynomial [37]. Integration of the instantaneous expansion data with respect to time yields the change in volume from end-expiration.
2.3.2. Bronchial tree segmentation and tracking
In order to relate the expansion of lung tissue to the flow through the bronchial tree, the airway tree must be segmented from the three-dimensional reconstructions. To achieve this, a semi-automated method based on an image intensity threshold was used. However, alternative methods could be implemented to achieve a similar result [38,39]. The bronchial tree was segmented from the three-dimensional image at the first time point using the Amira software (Visage Imaging GmbH, Germany). The three-dimensional reconstruction was first binarized using a thresholding procedure to identify the voxels that correspond to air. The binary selection is then contracted by one voxel. The main airway tree is then selected, and the binary image is expanded by one voxel to return to the original dimensions. The Amira software auto-skeleton feature was used to form the airway tree network. This yields a representation of the airway tree that consists of bifurcation points joined in space by cylindrical segments. Thus, information on the airway centerlines, bifurcation points and diameter is provided for a single time point.
In order to define the airway tree at all time points, two approaches are available. One option is to repeat the segmentation procedure at each time point. However, this is time-consuming, particularly when many time points are acquired. The approach we have taken is to use the cross-correlation velocimetry analysis to track the motion of the airways. However, rather than interrogating regions of the images on a regular grid, interrogation regions are placed at each point within the airway network tree. Thus, the displacement of each point within the tree between frames is measured providing the morphology and location of each segment throughout the ventilation cycle.
2.3.3. Estimation of flow throughout the bronchial tree
In order to relate the measured expansion field to airway flow, each region of tissue was associated with the airway that supplies that tissue. Since the tissue expansion results from flow into, or out of, the peripheral gas exchange airways, the airway flow is directly represented by the expansion of the tissue supplied by that airway. Each voxel was associated with its closest supplying airway. A supplying airway is defined as an airway that has a parent but no children. The airflow through each supplying airway can be directly inferred from the expansion of its associated tissue region.
The mammalian bronchial tree is a dichotomous bifurcation network [40–42]. The root is the trachea, and subsequent asymmetric bifurcations occur, with each airway (the parent), splitting into two daughter airways. Assuming negligible compressibility effects, the principle of continuity dictates that at each bifurcation the flow through a parent branch must equal the sum of the flow through its daughter branches. As the flow in each supplying airway is known, the flow through the entire tree can therefore be calculated by recursively summing the flowrates in daughter branches at each bifurcation to calculate the parent branch flowrate.
2.3.4. Time constant calculation
The expiratory time constant is a commonly used clinical measure of respiratory mechanics. During expiration, the lung undergoes an exponential decrease in volume, following
| 2.2 |
where V(t) is the lung volume (relative to the reference volume, which in this case is the volume at end-expiration), t the time from the start of expiration, VT the change in volume from end-expiration to end-inspiration (i.e. the tidal volume), t the time from the start of expiration and τ the expiratory time constant. The time constant τ represents the time for V(t) to reach 63 per cent of complete expiration, with 5τ defining the time to reach 99.3 per cent of complete expiration. Typically, τ is termed the RC time constant; the product of system resistance (R) and compliance (C) [43,44]. The expiratory time constant is usually measured as a global parameter of the entire respiratory system. The capability to measure regional volume–time curves provides the opportunity to directly calculate the expiratory time constant at a regional level. We used regional volume–time curves to measure local time constants of lung tissue, and also of the individual lung lobes. For each region i, the lung tissue will approximately follow the exponential decrease in volume of the lung
| 2.3 |
where Vi(t), VTi and τi are the regional lung volume, regional tidal volume and regional time constant for region i, respectively. The region i may refer to tissue within an interrogation region, a region of tissue associated with a specific supplying airway or tissue belonging to a specific lung lobe. A weighted least-squares regression fit [45] was used to determine τi from regional volume–time curves. The logarithm of equation (2.3) was taken
| 2.4 |
This step increases smaller values of Vi(t) with respect to larger values. Therefore, a standard linear regression would be weighted towards these smaller values. In order to provide equal weighting between all points, a weighted linear regression was performed, and the following equation was minimized
 |
2.5 |
In order to determine the quality of the fit parameters, the coefficient of determination (R2) value was calculated based on the errors of the curve fit of equation (2.3) and the measured volume data. Regression lines with an R2 < 0.95 were considered unacceptable and were omitted from the presented results. For local time-constant measurements, where the regions were based on the interrogation regions, the number of measurements rejected in this manner was approximately 7 per cent. For all time-constant calculations based on regions of tissue associated with specific lung lobes, R2 > 0.99 indicating an excellent agreement of the measured data and the fitted curves.
3. Results
3.1. Expansion measurement validation
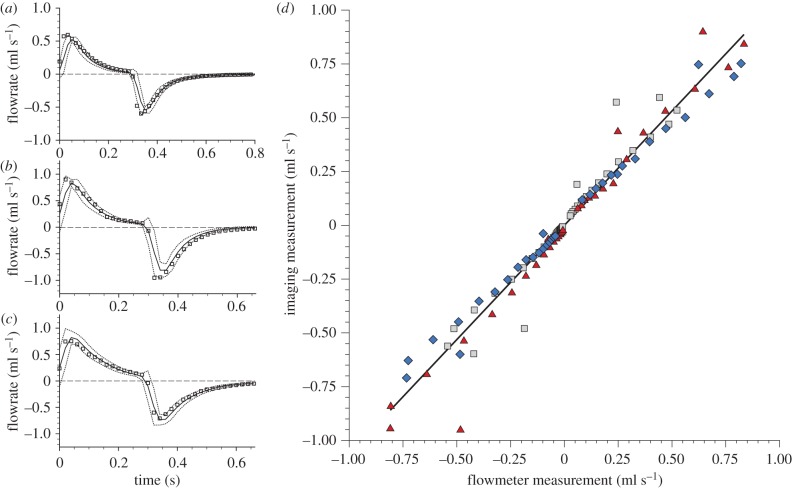
In order to demonstrate the accuracy of the expansion and flow measurement procedure, the flow in the trachea of mice (n = 3) was measured in vivo using the developed methodology. A total of 120 independent flow measurements were acquired and verified against an inline flowmeter placed in the ventilation line. Figure 4a–c shows the total flowrate through the trachea for the three mice (M1, M2 and M3, respectively). The flowmeter data represent phase-averaged measurements (solid line) with the dashed line showing the average ±3σ, where σ is the standard deviation of the measurements within the phase bin. The squares represent the flowrate measured using the imaging method. The error of the imaging method was 0.08 ml s−1 (r.m.s.): within the known calibration uncertainty of the flowmeter (0.10 ml s−1 (r.m.s.)). Figure 4d shows a comparison of both the methods. The solid line shows a linear regression fit, which has a gradient of 1.06 and a correlation coefficient of R2 = 0.96, demonstrating excellent accuracy of the imaging method in measuring expansion within the lung.
Figure 4.
Flow measurement validation. Flow through the trachea over the entire breath was measured in three mice M1 (a), M2 (b), M3 (c)—using the new imaging method (squares) and compared with flow measured using an inline flowmeter (solid line). (d) Data measured using the imaging method plotted against the flowmeter measurements: M1 (squares), M2 (diamonds), M3 (triangles). A linear regression fit exhibited a gradient of 1.06 and a coefficient of correlation of R2 = 0.96, demonstrating excellent accuracy of the new imaging method.
3.2. Local expansion and time constant
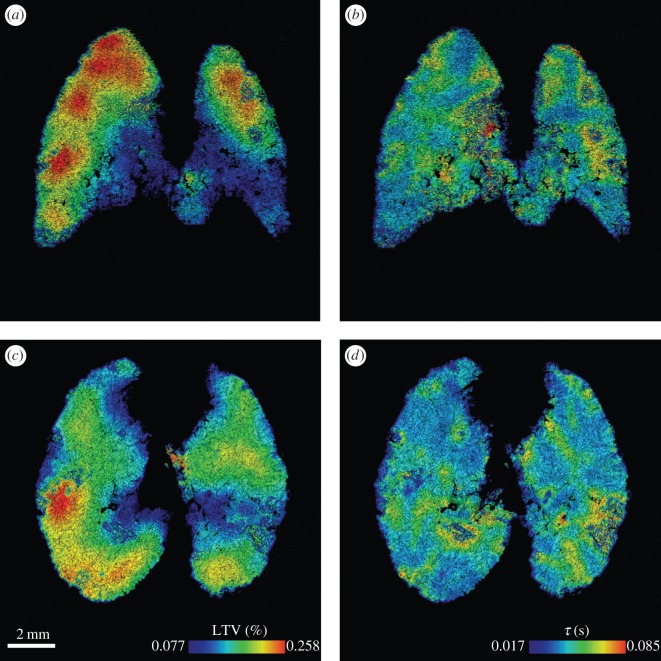
Local expansion and time constant were measured in a newborn rabbit pup. Results are shown in figure 5. The expansion is presented as the local tidal volume (LTV), which is defined as the instantaneous expansion integrated over the inflation phase of ventilation; that is, the change in local tissue volume from end-expiration to end-inspiration. The lungs exhibit regional variations in LTV and time constant. The local expansion shows large spatial scale variations, with regions of high expansion occurring at the apex of both the left and right lungs. The local time constant shows a more evenly distributed heterogeneity. The average LTV and time constant for transverse planes are shown in figure 6. In this figure, z represents the vertical position with respect to the base of the lung along the cranio-caudal axis. The local expansion exhibits an increase from the base to the apex of the lung. This is probably because of regional differences in pleural pressure resulting from gravitational effects [46,47]. The local time constant shows no clear relationship with z. This is expected as the time constant results from the mechanical properties of the lung (compliance and resistance), which are relatively constant throughout the healthy lung, and not a function of the orientation of the lung relative to gravity.
Figure 5.
(a,c) Local tidal volume and (b,d) local time constant measured in a newborn rabbit pup. (a,b) A coronal plane and (c,d) transverse plane of the three-dimensional measurement is shown for each parameter with contours chosen to range from the average ±2 s.d. of the three-dimensional dataset.
Figure 6.
(a) Average expansion and (b) average time constant of horizontal slices of the data presented in figure 5. In these figures, z represents the vertical position with respect to the base of the lung, and the error bars represent ±1 s.d. of the transverse plane. The local expansion exhibits an increase from the base to the apex of the lung, while the the local time constant shows no clear relationship.
3.3. Measurement of flow through the airway tree
The flow throughout the airway tree of a newborn rabbit pup was measured using the developed methodology. Airways were segmented from the four-dimensional CT reconstruction at the first time point. The airway segmentation procedure specified airways to 15 generations. Using the ordering system proposed by Horsfield [48], the resulting network shows the expected exponential distribution [48] of airways versus order number (figure 7a), indicating successful segmentation of the airway network. The airway network was tracked over the ventilation cycle using the cross correlation-based analysis. To confirm the accuracy of the airway motion measurements, the initial segmented airway tree was compared with the tree at the end of the ventilation cycle. Since the ventilation is periodic, the airway returns to its original position during each period of the cycle. Errors in tracking the motion of the airways will accumulate over the cycle. The discrepancy between the initial airway network and that at the end of the cycle therefore provides an estimate of the error accumulated over the cycle. A histogram of the error accumulated over the entire cycle as a percentage of the maximum displacement is shown in figure 7b. The average accumulated error in airway motion over the entire breath was calculated to be 1.36 ± 0.8% (s.d.) of the maximum displacement. The maximum accumulated error in the location of airway end branches was 25.1 µm; far less than a typical alveolar diameter (approx. 100 µm), and so errors in the association of tissue expansion to terminal branches owing to airway tracking will be negligible over the entire breath.
Figure 7.
Airway segmentation and tracking verification. Histogram of the number of branches (black bars) and average supplied volume (grey bars) of air versus Horsfield order (a) exhibiting the expected exponential relationships. Histogram of the error of the airway tracking measurement accumulated over the entire ventilation cycle, and plotted as a percentage of the maximum airway displacement (b). The average percentage error accumulated over the entire breath is 1.36 ±0.8% (s.d).
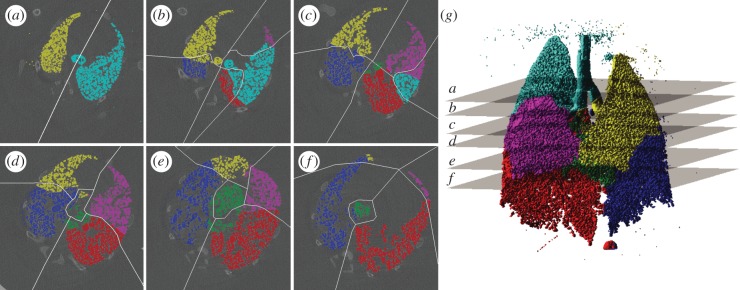
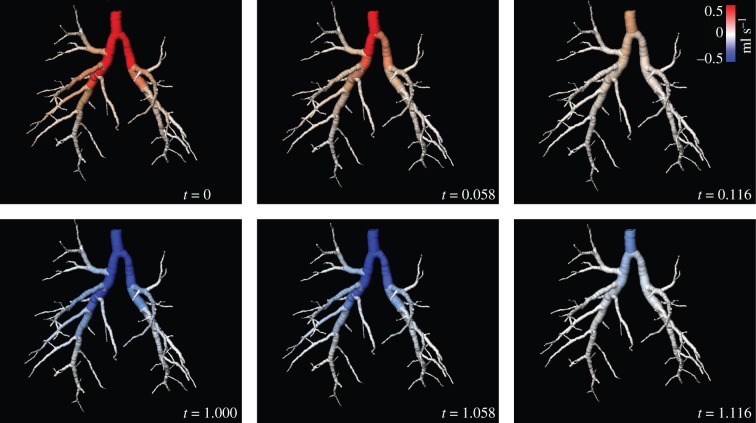
Voxels in the expansion field were associated with their corresponding supplying airway to yield the flow throughout the airway tree for each time point imaged within the ventilation cycle. The accuracy of the airway association was assessed by comparing manually ascertained lobe boundaries with those dictated by the distance criteria used in this study. Slices were chosen that exhibit clearly visible lobe boundaries to facilitate accurate manual demarcation of the lobes, and to span a large portion of the lungs (figure 8g). This assessment demonstrated that 91.5 per cent of voxels were associated to the correct lobe supplying airway. Figure 9 shows the airway flow for six out of the 20 measured time points. The average flow through the airways for each Horsfield order (figure 7b) exhibits the expected exponential distribution [48], indicating accurate flow measurement throughout the airway tree.
Figure 8.
Lung tissue supply airway association. Lobe boundaries manually ascertained in six reconstructed transverse slices at the first time point are shown as white lines (a–f). Associations defined by the distance criteria scheme are shown as colours (yellow, left upper lobe; blue, left lower lobe; cyan, right upper lobe; magenta, right middle lobe; red, right lower lobe; green, right accessory lobe). The three-dimensional association rendered in (g) illustrates the position of the cross sections used in (a–f). The accuracy of the distance criteria for allocation of voxels was found to be 91.5%.
Figure 9.
Distribution of flow throughout the airway tree. Instantaneous flow of air through the rabbit pup airway tree at six time points (out of 20) during ventilation. Positive flow indicates flow into the lungs and negative flow indicates flow out of the lungs. The full movie of this data is shown in the electronic supplementary material.
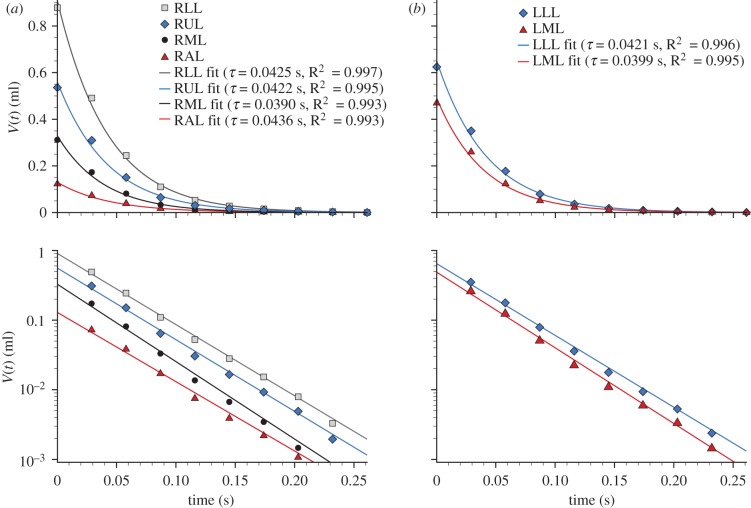
By integrating the airway flow over time, the volume–time curves for regions supplied by each airway are available. Selecting the airways that supply each lung lobe allowed the expiratory time constant from each lobe to be calculated (figure 10). This approach can be applied not only to the lobes, but also any region of the lung. Measurements of a similar form to spirometry or plethysmography can therefore be achieved on a regional basis, greatly enhancing the information available over these global measurement methods.
Figure 10.
Local expiratory time constant (τ) for each lung lobe. The symbols show the measured volume (relative to end-expiration) for the expiration phase for the lobes in the (a) right and (b) left lungs, and the solid lines show the curve fit used for the time constant calculation. The data are plotted on both (upper) linear and (lower) log scales. RUL, right upper lobe; RML, right middle lobe; RAL, right accessory lobe; RLL, right lower lobe; LML, left middle lobe; LLL, left lower lobe.
4. Discussion and conclusions
We have developed a method for high-resolution, regional dynamic in vivo lung function measurement, by using CT combined with cross-correlation velocimetry. Accurate measurements of tissue expansion, local time constant and airway flow were achieved in mice and in a newborn rabbit pup at a temporal resolution of up to 60 frames s−1. The measurements were performed on healthy lungs, and application of the method to pathological lungs have not been presented. Further investigation is underway to definitively test the applicability of the method in lungs that have altered function owing to disease. However, we have previously shown that altered lung motion, measured using a two-dimensional variant of the technique, is a sensitive indicator of lung injury [49], and anticipate that the methodology will be useful in a wide range of lung mechanics problems.
The technique lends itself to evaluation of respiratory conditions in which there may be alteration in the compliance of lung, chest wall and diaphragmatic function or airway flow patterns. In particular, it may provide new insights into the regional consequences of restrictive lung disease, chronic obstructive airway diseases and asthma. For example, the functional deficit during a provoked asthma attack has been shown to be highly regional [50], and our method may provide further insight into the dynamics of this effect.
The ability to measure volume–time curves for regions supplied by specific airways, as demonstrated in figure 10, could prove invaluable in ascertaining dynamic boundary conditions for airway flow modelling. This capacity can provide experimental data on the effects of airway geometry on regional airflow distributions in vivo, where studies were previously limited to numerical simulation [15,51,52]. Furthermore, this information can be used for validation of numerical studies.
Another enticing application for these techniques lies in the diagnosis of lung pathology. For example, lung diseases that alter the lung tissue structure or airway calibre, such as cancer [53,54], asthma [2,9,10] and chronic obstructive pulmonary disease [2,44], may dramatically affect the temporal inflation patterns, and so regional time constants could provide a more sensitive indicator than regional ventilation measures.
The application of this technology to human lungs is highly promising. This study used phase-contrast imaging to increase signal-to-noise and temporal resolution, but clinical CT scanners employ polychromatic beams, which makes it much more difficult to perform effective phase-contrast imaging. Nevertheless, the methods described are independent of the imaging mode, and could potentially be used with current four-dimensional-CT clinical scanners in the absorption imaging mode, albeit at a reduced resolution. Furthermore, recent advances in CT technology, such as high-end multi-row scanners and respiratory-gating methods are fast overcoming the current resolution shortcomings.
An alternative velocimetry approach, CTXV [35,36] has been recently developed by the authors, which is capable of providing accurate motion measurement from very few projections. The combination of CTXV with future developments in clinical phase-contrast X-ray imaging [24,55] could provide similar measurements to those presented in this paper, with significantly reduced dose levels over current four-dimensional-CT methods.
Clinical application would provide effective diagnosis and monitoring of treatment during therapy for a variety of lung diseases, particularly if combined with these low-dose scanning methods.
Acknowledgments
All procedures were approved by the SPring-8 Synchrotron Facility and Monash University's School of Biomedical Science's Animal Ethics Committee.
This research was supported by Australian Research Council (Discovery Project, DP110101498); National Health and Medical Research Council, Australia (Project grant, APP1006846); American Asthma Foundation; the Multi-modal Australian ScienceS Imaging and Visualisation Environment (MASSIVE; www.massive.org.au); and the Monash e-Research Center. The synchrotron radiation experiments were performed at the BL20B2 of SPring-8 with the approval of the Japan Synchrotron Radiation Research Institute (JASRI; proposal nos 2009B0022, 2010B0022). The views expressed herein are those of the authors and are not necessarily those of the supporting entities. We thank K. Uesugi, N. Yagi, M. J. Wallace, B. J. Allison and K.Wheeler for assistance with experiments. We thank R. Hicks and D. Lo Jacono for discussions.
We acknowledge travel funding provided by the International Synchrotron Access Program (ISAP) managed by the Australian Synchrotron and funded by the Australian Government.
References
- 1.Weibel E. R. 2009. What makes a good lung? the morphometric basis of lung function. Swiss Med. Wkly 139, 375–386 [DOI] [PubMed] [Google Scholar]
- 2.Faffe D. S., Zin W. A. 2009. Lung parenchymal mechanics in health and disease. Physiol. Rev. 89, 759–775 10.1152/physrev.00019.2007 (doi:10.1152/physrev.00019.2007) [DOI] [PMC free article] [PubMed] [Google Scholar]
- 3.Frerichs I. 2000. Electrical impedance tomography (EIT) in applications related to lung and ventilation: a review of experimental and clinical activities. Physiol. Measure. 21, R1–R21 10.1088/0967-3334/21/2/201 (doi:10.1088/0967-3334/21/2/201) [DOI] [PubMed] [Google Scholar]
- 4.Metherall P., Barber D. C., Smallwood R. H., Brown B. H. 1996. Three-dimensional electrical impedance tomography. Nature 380, 509–512 10.1038/380509a0 (doi:10.1038/380509a0) [DOI] [PubMed] [Google Scholar]
- 5.Victorino J. A., et al. 2004. Imbalances in regional lung ventilation: a validation study on electrical impedance tomography. Am. J. Resp. Crit. Care Med. 169, 791–800 10.1164/rccm.200301-133OC (doi:10.1164/rccm.200301-133OC) [DOI] [PubMed] [Google Scholar]
- 6.Albert M. S., Cates G. D., Driehuys B., Happer W., Saam B., Springer C. S., Wishnia A. 1994. Biological magnetic-resonance-imaging using laser polarized Xe-129. Nature 370, 199–201 10.1038/370199a0 (doi:10.1038/370199a0) [DOI] [PubMed] [Google Scholar]
- 7.Ebert M., et al. 1996. Nuclear magnetic resonance imaging with hyperpolarised helium-3. Lancet 347, 1297–1299 10.1016/S0140-6736(96)90940-X (doi:10.1016/S0140-6736(96)90940-X) [DOI] [PubMed] [Google Scholar]
- 8.Musch G., Layfield J. D. H., Harris R. S., Melo M. F. V., Winkler T., Callahan R. J., Fischman A. J., Venegas J. G. 2002. Topographical distribution of pulmonary perfusion and ventilation, assessed by PET in supine and prone humans. J. Appl. Physiol. 93, 1841–1851 [DOI] [PubMed] [Google Scholar]
- 9.Venegas J. G., et al. 2005. Self-organized patchiness in asthma as a prelude to catastrophic shifts. Nature 434, 777–782 10.1038/nature03490 (doi:10.1038/nature03490) [DOI] [PubMed] [Google Scholar]
- 10.Jannasch K., Missbach-Guentner J., Alves F. 2009. Using in vivo imaging for asthma. Drug Discov. Today: Disease Models 6, 129–135 10.1016/j.ddmod.2009.12.003 (doi:10.1016/j.ddmod.2009.12.003) [DOI] [Google Scholar]
- 11.Voorhees A., An J., Berger K. I., Goldring R. M., Chen Q. 2005. Magnetic resonance imaging-based spirometry for regional assessment of pulmonary function. Magn. Reson. Med. 54, 1146–1154 10.1002/mrm.20682 (doi:10.1002/mrm.20682) [DOI] [PubMed] [Google Scholar]
- 12.Tustison N. J., Awate S. P., Cai J., Altes T. A., Miller G. W., de Lange E. E., Mugler J. P., III, Gee J. C. 2010. Pulmonary kinematics from tagged hyperpolarized helium-3 MRI. J. Magn. Reson. Imag. 31, 1236–1241 10.1002/jmri.22137 (doi:10.1002/jmri.22137) [DOI] [PMC free article] [PubMed] [Google Scholar]
- 13.Christensen G. E., Song J. H., Lu W., El Naqa I., Low D. A. 2007. Tracking lung tissue motion and expansion/compression with inverse consistent image registration and spirometry. Med. Phys. 34, 2155–2163 10.1118/1.2731029 (doi:10.1118/1.2731029) [DOI] [PubMed] [Google Scholar]
- 14.Reinhardt J. M., Ding K., Cao K., Christensen G. E., Hoffman E. A., Bodas S. V. 2008. Registration-based estimates of local lung tissue expansion compared to xenon CT measures of specific ventilation. Med. Image Anal. 12, 752–763 10.1016/j.media.2008.03.007 (doi:10.1016/j.media.2008.03.007) [DOI] [PMC free article] [PubMed] [Google Scholar]
- 15.Yin Y., Choi J., Hoffman E. A., Tawhai M. H., Lin C.-L. 2010. Simulation of pulmonary air flow with a subject-specific boundary condition. J. Biomech. 43, 2159–2163 10.1016/j.jbiomech.2010.03.048 (doi:10.1016/j.jbiomech.2010.03.048) [DOI] [PMC free article] [PubMed] [Google Scholar]
- 16.Ding K., Bayouth J. E., Buatti J. M., Christensen G. E., Reinhardt J. M. 2010. 4DCT-based measurement of changes in pulmonary function following a course of radiation therapy. Med. Phys. 37, 1261. 10.1118/1.3312210 (doi:10.1118/1.3312210) [DOI] [PMC free article] [PubMed] [Google Scholar]
- 17.Guerrero T., Sanders K., Castillo E., Zhang Y., Bidaut L., Pan T. S., Komaki R. 2006. Dynamic ventilation imaging from four-dimensional computed tomography. Phys. Med. Biol. 51, 777–791 10.1088/0031-9155/51/4/002 (doi:10.1088/0031-9155/51/4/002) [DOI] [PubMed] [Google Scholar]
- 18.Pan T., Lee T.-Y., Rietzel E., Chen G. T. Y. 2004. 4D-CT imaging of a volume influenced by respiratory motion on multi-slice CT. Med. Phys. 31, 333–340 10.1118/1.1639993 (doi:10.1118/1.1639993) [DOI] [PubMed] [Google Scholar]
- 19.Zhao T., Lu W., Yang D., Mutic S., Noel C. E., Parikh P. J., Bradley J. D., Low D. A. 2009. Characterization of free breathing patterns with 5D lung motion model. Med. Phys. 36, 5183. 10.1118/1.3246348 (doi:10.1118/1.3246348) [DOI] [PMC free article] [PubMed] [Google Scholar]
- 20.Hooper S. B., et al. 2007. Imaging lung aeration and lung liquid clearance at birth. FASEB J. 21, 3329–3337 10.1096/fj.07-8208com (doi:10.1096/fj.07-8208com) [DOI] [PubMed] [Google Scholar]
- 21.Fouras A., Kitchen M. J., Dubsky S., Lewis R. A., Hooper S. B., Hourigan K. 2009. The past, present, and future of x-ray technology for in vivo imaging of function and form. J. Appl. Phys. 105, 102009. 10.1063/1.3115643 (doi:10.1063/1.3115643) [DOI] [Google Scholar]
- 22.Lewis R. A., et al. 2005. Dynamic imaging of the lungs using X-ray phase contrast. Phys. Med. Biol. 50, 5031–5040 10.1088/0031-9155/50/21/006 (doi:10.1088/0031-9155/50/21/006) [DOI] [PubMed] [Google Scholar]
- 23.Kitchen M. J., Habib A., Fouras A., Dubsky S., Lewis R. A., Wallace M. J., Hooper S. B. 2010. A new design for high stability pressure-controlled ventilation for small animal lung imaging. J. Instrum. 5, T02002. 10.1088/1748-0221/5/02/T02002 (doi:10.1088/1748-0221/5/02/T02002) [DOI] [Google Scholar]
- 24.Lewis R. A. 2004. Medical phase contrast X-ray imaging: current status and future prospects. Phys. Med. Biol. 49, 3573–3583 10.1088/0031-9155/49/16/005 (doi:10.1088/0031-9155/49/16/005) [DOI] [PubMed] [Google Scholar]
- 25.Kitchen M. J., et al. 2008. Dynamic measures of regional lung air volume using phase contrast X-ray imaging. Phys. Med. Biol. 53, 6065–6077 10.1088/0031-9155/53/21/012 (doi:10.1088/0031-9155/53/21/012) [DOI] [PubMed] [Google Scholar]
- 26.Cavanaugh D., Johnson E., Price R. E., Kurie J., Travis E. L., Cody D. D. 2004. In vivo respiratory-gated micro-CT imaging in small-animal oncology models. Mol. Imag. 3, 55–62 10.1162/153535004773861723 (doi:10.1162/153535004773861723) [DOI] [PubMed] [Google Scholar]
- 27.Figueroa S. D., Winkelmann C. T., Miller W. H., Volkert W. A., Hoffman T. J. 2008. TLD assessment of mouse dosimetry during microCT imaging. Med. Phys. 35, 3866–3874 10.1118/1.2959847 (doi:10.1118/1.2959847) [DOI] [PMC free article] [PubMed] [Google Scholar]
- 28.Siew M. L., et al. 2009. Positive end-expiratory pressure enhances development of a functional residual capacity in preterm rabbits ventilated from birth. J. Appl. Physiol. 106, 1487–1493 10.1152/japplphysiol.91591.2008 (doi:10.1152/japplphysiol.91591.2008) [DOI] [PubMed] [Google Scholar]
- 29.Irvine S. C., Paganin D. M., Dubsky S., Lewis R. A., Fouras A. 2008. Phase retrieval for improved three-dimensional velocimetry of dynamic X-ray blood speckle. Appl. Phys. Lett. 93, 153901. 10.1063/1.3001592 (doi:10.1063/1.3001592) [DOI] [Google Scholar]
- 30.Andersen A., Kak A. 1998. Simultaneous algebraic reconstruction technique (SART): a superior implementation of ART. Ultrasonic Imag. 6, 81–94 10.1016/0161-7346(84)90008-7 (doi:10.1016/0161-7346(84)90008-7) [DOI] [PubMed] [Google Scholar]
- 31.Adrian R. J. 1991. Particle-imaging techniques for experimental fluid-mechanics. Ann. Rev. Fluid Mech. 23, 261–304 10.1146/annurev.fl.23.010191.001401 (doi:10.1146/annurev.fl.23.010191.001401) [DOI] [Google Scholar]
- 32.Elsinga G. E., Scarano F., Wieneke B., van Oudheusden B. W. 2006. Tomographic particle image velocimetry. Exp. Fluids 41, 933–947 10.1007/s00348-006-0212-z (doi:10.1007/s00348-006-0212-z) [DOI] [Google Scholar]
- 33.Westerweel J., Dabiri D., Gharib M. 1997. The effect of a discrete window offset on the accuracy of cross-correlation analysis of digital PIV recordings. Exp. Fluids 23, 20–28 10.1007/s003480050082 (doi:10.1007/s003480050082) [DOI] [Google Scholar]
- 34.Westerweel J., Scarano F. 2005. Universal outlier detection for PIV data. Exp. Fluids 39, 1096–1100 10.1007/s00348-005-0016-6 (doi:10.1007/s00348-005-0016-6) [DOI] [Google Scholar]
- 35.Dubsky S., Jamison R. A., Irvine S. C., Siu K. K. W., Hourigan K., Fouras A. 2010. Computed tomographic X-ray velocimetry. Appl. Phys. Lett. 96, 023702. 10.1063/1.3285173 (doi:10.1063/1.3285173) [DOI] [Google Scholar]
- 36.Dubsky S., Jamison R. A., Higgins S. P. A., Siu K. K. W., Hourigan K., Fouras A. 2012. Computed tomographic X-ray velocimetry for simultaneous 3D measurement of velocity and geometry in opaque vessels. Exp. Fluids 52, 543–554 10.1007/s00348-010-1006-x (doi:10.1007/s00348-010-1006-x) [DOI] [Google Scholar]
- 37.Fouras A., Soria J. 1998. Accuracy of out-of-plane vorticity measurements derived from in-plane velocity field data. Exp. Fluids 25, 409–430 10.1007/s003480050248 (doi:10.1007/s003480050248) [DOI] [Google Scholar]
- 38.Aykac D., Hoffman E. A., McLennan G., Reinhardt J. M. 2003. Segmentation and analysis of the human airway tree from three-dimensional X-ray CT images. IEEE Trans. Med. Imag. 22, 940–950 10.1109/TMI.2003.815905 (doi:10.1109/TMI.2003.815905) [DOI] [PubMed] [Google Scholar]
- 39.Pu J., Fuhrman C., Good W. F., Sciurba F. C., Gur D. 2011. A differential geometric approach to automated segmentation of human airway tree. IEEE Trans. Med. Imag. 30, 266–278 10.1109/TMI.2010.2076300 (doi:10.1109/TMI.2010.2076300) [DOI] [PMC free article] [PubMed] [Google Scholar]
- 40.Weibel E. R. 1963. Morphometry of the human lung. Berlin/New York: Springer-Verlag/Academic Press [Google Scholar]
- 41.Horsfield K., Cumming G. 1968. Morphology of the bronchial tree in man. J. Appl. Physiol. 24, 373–383 [DOI] [PubMed] [Google Scholar]
- 42.Kitaoka H., Takaki R., Suki B. 1999. A three-dimensional model of the human airway tree. J. Appl. Physiol. 87, 2207–2217 [DOI] [PubMed] [Google Scholar]
- 43.Brunner J. X., Laubscher T. P., Banner M. J., Iotta G., Braschi A. 1995. Simple method to measure total expiratory time constant based on the passive expiratory flow-volume curve. Crit. Care Med. 23, 1117–1122 10.1097/00003246-199506000-00019 (doi:10.1097/00003246-199506000-00019) [DOI] [PubMed] [Google Scholar]
- 44.Lourens M. S., van den Berg B., Aerts J. G. J., Verbraak A. F. M., Hoogsteden H. C., Bogaard J. M. 2000. Expiratory time constants in mechanically ventilated patients with and without COPD. Intens. Care Med. 26, 1612–1618 10.1007/s001340000632 (doi:10.1007/s001340000632) [DOI] [PubMed] [Google Scholar]
- 45.Weisstein E. W. 2002. CRC Concise encyclopedia of mathematics, 2nd edn London, UK: Chapman & Hall/CRC [Google Scholar]
- 46.Milic-Emili J., Hernderson J. A. M., Dolovich M. B., Trop D., Kaneko K. 1966. Regional distribution of inspired gas in the lung. J. Appl. Physiol. 21, 749–759 [DOI] [PubMed] [Google Scholar]
- 47.Galvin I., Drummond G. B., Nirmalan M. 2007. Distribution of blood flow and ventilation in the lung: gravity is not the only factor. Br. J. Anaesth. 98, 420–428 10.1093/bja/aem036 (doi:10.1093/bja/aem036) [DOI] [PubMed] [Google Scholar]
- 48.Horsfield K. 1990. Diameters, generations, and orders of branches in the bronchial tree. J. Appl. Physiol. 68, 1089–1097 [DOI] [PubMed] [Google Scholar]
- 49.Fouras A., et al. 2011. Altered lung motion is a sensitive indicator of regional lung disease. Ann. Biomed. Eng. 10.1007/s10439-011-0493-0 (doi:10.1007/s10439-011-0493-0) [DOI] [PubMed] [Google Scholar]
- 50.Bayat S., et al. 2009. Methacholine and ovalbumin challenges assessed by forced oscillations and synchrotron lung imaging. Am. J. Resp. Crit. Care Med. 180, 296–303 10.1164/rccm.200808-1211OC (doi:10.1164/rccm.200808-1211OC) [DOI] [PubMed] [Google Scholar]
- 51.Andrade J. S., Alencar A. M., Almeida M. P., Mendes J., Buldyrev S. V., Zapperi S., Stanley H. E., Suki B. 1998. Asymmetric flow in symmetric branched structures. Phys. Rev. Lett. 81, 926–929 10.1103/PhysRevLett.81.926 (doi:10.1103/PhysRevLett.81.926) [DOI] [Google Scholar]
- 52.Mauroy B., Filoche M., Andrade J., Sapoval B. 2003. Interplay between geometry and flow distribution in an airway tree. Phys. Rev. Lett. 90, 148101. 10.1103/PhysRevLett.90.148101 (doi:10.1103/PhysRevLett.90.148101) [DOI] [PubMed] [Google Scholar]
- 53.Noguchi M., Morikawa A., Kawasaki M., Matsuno Y., Yamada T., Hirohashi S., Kondo H., Shimosato Y. 1995. Small adenocarcinoma of the lung: histologic characteristics and prognosis. Cancer 75, 2844–2852 (doi:10.1002/1097-0142(19950615)75:12<2844::AID-CNCR2820751209>3.0.CO;2-#) [DOI] [PubMed] [Google Scholar]
- 54.Kerr K. M. 2009. Pulmonary adenocarcinomas: classification and reporting. Histopathology 54, 12–27 10.1111/j.1365-2559.2008.03176.x (doi:10.1111/j.1365-2559.2008.03176.x) [DOI] [PubMed] [Google Scholar]
- 55.Wu X., Liu H. 2003. Clinical implementation of X-ray phase-contrast imaging: theoretical foundations and design considerations. Med. Phys. 30, 2169–2179 10.1118/1.1593836 (doi:10.1118/1.1593836) [DOI] [PubMed] [Google Scholar]


