

Abstract
A key metric to assess molecular docking remains ligand enrichment against challenging decoys. Whereas the directory of useful decoys (DUD) has been widely used, clear areas for optimization have emerged. Here we describe an improved benchmarking set that includes more diverse targets such as GPCRs and ion channels, totaling 102 proteins with 22886 clustered ligands drawn from ChEMBL, each with 50 property-matched decoys drawn from ZINC. To ensure chemotype diversity, we cluster each target’s ligands by their Bemis–Murcko atomic frameworks. We add net charge to the matched physicochemical properties and include only the most dissimilar decoys, by topology, from the ligands. An online automated tool (http://decoys.docking.org) generates these improved matched decoys for user-supplied ligands. We test this data set by docking all 102 targets, using the results to improve the balance between ligand desolvation and electrostatics in DOCK 3.6. The complete DUD-E benchmarking set is freely available at http://dude.docking.org.
Introduction
While molecular docking screens routinely leverage protein structure to discover new ligands,1−4 quantitative assessment of their performance remains problematic.5 Although prospective assessment of docking performance is irreplaceable,6,7 it is both time-consuming and expensive. Because a general correlation between docking scores and affinities is beyond current methods,8,9 the field relies on ligand enrichment in docking hit lists to evaluate retrospective performance.10−14 “Enrichment” measures how known ligands rank versus a background of decoy molecules and so depends not only on the nature of the ligands but also on the background decoys. Thus to compare docking enrichments, a benchmarking set of ligands and decoys is needed.
The original Directory of Useful Decoys (DUD) was designed to meet this benchmarking need while controlling for decoy bias on enrichment.15,16 Given a random drug-like set of decoys, Verdonk et al. showed that targets which bind high molecular weight ligands naturally get higher enrichments due to correlation between larger molecules and better docking scores.17 In contrast, actual ligand binding affinities correlate with molecular size only for very small molecules.18 Unable to separate the true correlations of simple molecular properties that aid prospective ligand discovery from the artifical correlations that arise from biases, it is informative to ask what value molecular docking adds beyond these properties. To this end, DUD decoys are matched to the physical chemistry of ligands on a target-by-target basis: by the properties of molecular weight, calculated logP, number of rotatable bonds, and hydrogen bond donors and acceptors. To fulfill their role as negative controls, decoys should not actually bind, so DUD used 2-D similarity fingerprints to minimize the topological similarity between decoys and ligands. In short, DUD decoys were chosen to resemble ligands physically and so be challenging for docking but at the same time be topologically dissimilar to minimize the likelihood of actual binding.
Through intense use,19−26 weaknesses in the original DUD set have appeared in both the ligands and decoys. Good and Oprea noted that a handful of chemotypes dominate many ligand sets, allowing high ranks for one scaffold to cause good overall enrichment.27 One way to circumvent this problem is using chemotype retrieval metrics,28 but another is to remove the “analogue bias” from the database by clustering on ligand scaffolds. After clustering the 40 targets, Good’s subset of DUD contains only 13 targets with over 15 ligands, indicating a need for more targets with more ligands. Another important goal is to increase target diversity, for example, by adding membrane domain proteins, none of which are represented in DUD.
As there were weaknesses in the DUD ligands, this was also true of the decoys. Several investigators29−31 observed that despite property matching on logP, net formal charge is still imbalanced in DUD; 42% of all ligands are charged versus only 15% of decoys. Property matching of decoys to ligands could also be tightened by choosing decoys more embedded in ligand property space.32,33 Despite a 2-D chemical dissimilarity filter to prevent decoys from being active, some original DUD decoys still appear to bind, and these false decoys artificially reduce docking enrichment.32 Addressing both false decoys and decoy property embedding, Vogel et al. released DEKOIS for the original 40 DUD targets. Gatica and Cavasotto generated ligand and decoy sets for 147 G protein-coupled receptors (GPCRs) while adding net charge to property matching.34 Very recently, a python GUI application was announced to generate property-matched decoys.35 By ignoring synthetic feasibility, Wallach and Lilien generate virtual decoy sets for the original DUD targets with tighter property-matching.33 Instead of generating computational decoys, the MUV set selects decoys for 17 targets that were negative in public high-throughput screens.36 Instead of generating decoys at all, REPROVIS-DB assembles ligand and database data from earlier successful virtual screens which are deemed reproducible.37
Here we describe a new version of DUD that addresses these liabilities and develops new functionality. By drawing on ChEMBL09,38 each DUD-Enhanced (DUD-E) ligand has a measured affinity supported by a literature reference. Though ligands are now typically clustered by Bemis–Murcko atomic frameworks39 to reduce chemotype bias, there are still on average 224 ligands per target. The target list is expanded from 40 to 102, favoring targets with many ligands and multiple40 structures. The additions include several drug relevant membrane proteins: five GPCRs, two ion channels, and two cytochrome P450s. Meanwhile, false decoys are reduced by more stringent filtering of topological dissimilarity. Where possible, measured experimental decoys are included. Finally, we consider how DUD-E performs as a benchmark versus the original DUD and explore its use as a tool for evaluating and optimizing molecular docking.
Results
The ideal target for a benchmarking set would be well studied, with many measured ligand affinities and multiple, diverse cocrystal ligand structures. To this end, the enhanced DUD database (DUD-E) is largely based on the intersection of ChEMBL,38 for ligand annotations and affinities, and the RCSB PDB,40 for structures. As we sought targets to enlarge the set, the 40 original DUD targets were first priority, 38 of which we included. Platelet-derived growth factor receptor β was dropped, as it was a homology model. Estrogen receptor α (ESR1) is a single target in DUD-E, whereas it was split into agonists and antagonists previously. To enlarge the benchmarking set, we used three main criteria. First, we favored new target classes with pharmacological precedence. Second, we sought targets with many ligands and crystal structures, as they likely reflect a combination of target relevance and ease of study. Third, we preferred targets that could modestly enrich known ligands using fully automated docking, as these may be both easy to prepare and amenable to docking. Conversely, targets with mostly covalent ligands were deprioritized.
DUD-E targets are defined by their UniProt41 gene prefix, with data from each species being combined into a single data set. While ChEMBL annotates ligands to a particular UniProt accession code, the ligand overlap between orthologous targets is surprisingly small. For example, among 1555 unique ligands with affinities below 1 μM for the human dopamine D3 receptor and 744 ligands for the rat orthologue, only 85 ligands are in both sets. These two orthologues share 97% trans-membrane sequence identity (79% overall), so this low overlap suggests to us that ChEMBL ligand annotations are sparse and do not typically reflect species specificity. Therefore, we pooled the data for all species, defining a DUD-E target as a UniProt gene prefix (such as DRD3), and not the full gene_species pair (such as DRD3_HUMAN or P35462).
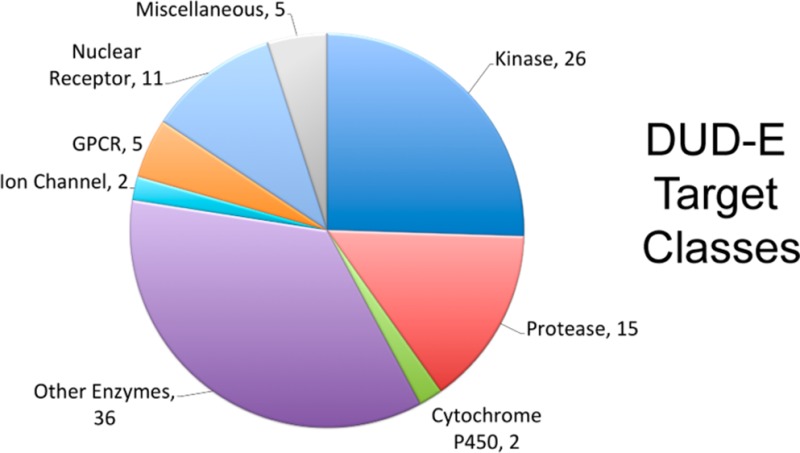
The 102 targets span diverse protein categories, including 26 kinases, 15 proteases, 11 nuclear receptors, five GPCRs, two ion channels, two cytochrome P450s, 36 other enzymes, and five miscellaneous proteins (Figure 1). Altogether 66695 raw ligands, defined as those with annotated affinities better than 1 μM to their target, molecular weights less than 600 and fewer than 20 rotatable bonds were extracted from ChEMBL09 (or the AmpC β-lactamase literature) (Table 1). That is an average of 654 ligands per target with a minimum of 40 and a maximum of 3090. Though negative binding is rarely reported, we also found 9219 experimental decoys (i.e., no measurable affinity up to 30 μM), with a maximum of 1070 for cyclo-oxygenase-1 (PGH1).
Figure 1.

DUD-E target classification. Number of the 102 targets that belong to eight broad protein categories.
Table 1. Characteristics of DUD-E.
| total | ChEMBL | manual | |
|---|---|---|---|
| no. targets | 102 | 101 | 1 |
| total | average | minimum | maximum | |
|---|---|---|---|---|
| no. raw ligands | 66695 | 653.9 | 40 | 3090 |
| no. clustered ligands | 22886 | 224.4 | 40 | 592 |
| no. experimental decoys | 9219 | 90.4 | 1 | 1070 |
| no. clustered ligands unique charge states | 28377 | 278.2 | 46 | 1030 |
| no. computational decoys | 1411214 | 13835 | 2300 | 51500 |
With targets selected, we chose a single X-ray structure to represent each target in docking studies (Table 2, Supporting Information Table S1). To find the structure most amenable to docking, we used an automated docking campaign to screen 3690 PDB structures against their clustered ligands and property-matched decoys (see below). Preference was given to higher resolution, to higher automated enrichment, and to the human orthologue. We avoided mutant structures, unresolved active site loops, extraneous bound peptides, or structures too constrained for many of that target’s ligands. Where we had domain knowledge, the most representative structure was preferred, for example a DFG-in structure for kinases or an antagonist structure for estrogen receptor α (ESR1). For 57 out of 102 targets, a DOCK Blaster42 prepared structure was used for DUD-E, directly from the automated tool chain. Another 45 targets required manual intervention, most due to simple errors in automated preparation (e.g., incomplete metal atom preparation, missing cofactors, or nonstandard amino acids). A select few needed expert intervention to arrive at modest enrichment, such as adding crystallographic waters, changing histidine protonation, flipping ambiguous side-chains such as asparagine, or increasing a local dipole moment on a specific residue (a technique we often use prospectively to improve polar complementarity43,44). In five targets, we incorporated prior docking preparations used for prospective ligand discovery: adenosine A2A receptor (AA2AR),44 β1 adrenergic receptor (ADRB1), AmpC β-lactamase (AMPC), C-X-C chemokine receptor type 4 (CXCR4),3 and dopamine D3 receptor (DRD3).45
Table 2. Overview of Representative Targets.
| target class | gene ID | description | total ligands | clustered ligands | experimental decoys | matched decoys | PDB | LogAUC (%) | ROC EF1 | AUC (%) |
|---|---|---|---|---|---|---|---|---|---|---|
| cytochrome P450 | CP2C9 | cytochrome P450 2C9 | 145 | 120 | 176 | 7450 | 1R9O | 7 | 3 | 60 |
| CP3A4 | cytochrome P450 3A4 | 302 | 170 | 267 | 11800 | 3NXU | 7 | 2 | 63 | |
| GPCR | AA2AR | adenosine A2a receptor | 3057 | 482 | 192 | 31550 | 3EML | 28 | 22 | 83 |
| ADRB1 | β-1 adrenergic receptor | 648 | 247 | 69 | 15850 | 2VT4 | 19 | 11 | 76 | |
| CXCR4 | C-X-C chemokine receptor type 4 | 40 | 40 | 14 | 3406 | 3ODU | 36 | 18 | 90 | |
| ion channel | GRIA2 | glutamate receptor ionotropic AMPA 2 | 476 | 158 | 201 | 11845 | 3KGC | 23 | 23 | 71 |
| GRIK1 | glutamate receptor ionotropic kainate 1 | 136 | 101 | 235 | 6550 | 1VSO | 35 | 27 | 86 | |
| kinase | AKT1 | serine/threonine-protein kinase AKT | 585 | 293 | 53 | 16450 | 3CQW | 27 | 29 | 72 |
| MK10 | c-Jun N-terminal kinase 3 | 199 | 104 | 23 | 6600 | 2ZDT | 24 | 11 | 82 | |
| MK14 | MAP kinase p38 α | 2205 | 578 | 73 | 35850 | 2QD9 | 17 | 10 | 74 | |
| miscellaneous | KIF11 | kinesin-like protein 1 | 272 | 116 | 29 | 6850 | 3CJO | 34 | 35 | 77 |
| XIAP | inhibitor of apoptosis protein 3 | 100 | 100 | 7 | 5150 | 3HL5 | 52 | 55 | 88 | |
| nuclear receptor | ESR1 | estrogen receptor α | 1297 | 383 | 136 | 20685 | 1SJ0 | 18 | 15 | 67 |
| MCR | mineralocorticoid receptor | 201 | 94 | 2 | 5150 | 2AA2 | –4 | 2 | 36 | |
| THB | thyroid hormone receptor β-1 | 246 | 103 | 29 | 7450 | 1Q4X | 36 | 38 | 79 | |
| PPARD | peroxisome proliferator-activated receptor δ | 699 | 240 | 79 | 12250 | 2ZNP | 32 | 20 | 89 | |
| other enzymes | FNTA | protein farnesyltransferase type I α | 1430 | 592 | 132 | 51500 | 3E37 | 16 | 7 | 76 |
| HDAC8 | histone deacetylase 8 | 309 | 170 | 73 | 10450 | 3F07 | 29 | 24 | 80 | |
| HIVINT | HIV type 1 integrase | 167 | 100 | 268 | 6650 | 3NF7 | 8 | 2 | 64 | |
| KITH | thymidine kinase | 57 | 57 | 68 | 2850 | 2B8T | 15 | 0 | 80 | |
| PARP1 | poly (ADP-ribose)polymerase-1 | 1031 | 508 | 12 | 30050 | 3L3M | 25 | 21 | 79 | |
| PUR2 | GAR transformylase | 50 | 50 | 12 | 2700 | 1NJS | 51 | 50 | 92 | |
| protease | DPP4 | dipeptidyl peptidase IV | 1939 | 533 | 167 | 40950 | 2I78 | 41 | 41 | 87 |
| FA10 | coagulation factor X | 3090 | 537 | 176 | 28325 | 3KL6 | 39 | 36 | 87 | |
| LKHA4 | leukotriene A4 hydrolase | 343 | 171 | 21 | 9450 | 3CHP | 18 | 4 | 82 | |
| MMP13 | matrix metallo-proteinase 13 | 1632 | 572 | 26 | 37200 | 830C | 12 | 5 | 71 | |
To increase scaffold diversity and to make smaller, more manageable ligand sets, we clustered the raw ChEMBL ligands by their Bemis–Murcko atomic frameworks.39 These atom-type based frameworks include ring systems of the molecule and connecting linkers, minus any side fragments. For example, the seventh largest Murcko cluster in kinesin-like protein 1 (KIF11) has seven ligands, all close analogues (Figure 2A). If at least 100 frameworks were present, then we included only the highest affinity ligand from each framework. If fewer were available, we raised the number of ligands selected from each framework until we obtained more than 100 molecules, trading diversity for quantity. Returning to kinesin-like protein 1, we extracted only 70 Murcko frameworks (Figure 2B). Out of 276 raw ligands, the five largest Murcko clusters contained 146 ligands (53%). Selecting the two or three highest affinity ligands from each framework results in 98 and 118 ligands, respectively, so we stopped at three ligands per framework. In the process we still managed to remove 158 lower affinity compounds from highly redundant clusters. In a few targets, more than 600 ligands remained even after clustering, so we reduced the affinity threshold below 1 μM in the sequence (300, 100, 30, 10, and 3 nM), until fewer than 600 frameworks were found. For example, in adenosine A2A receptor, there are 3096 raw ligands resulting in 1099 frameworks at 1 μM, but we can reduce the number of frameworks to 483 using a 30 nM affinity threshold (Figure 2C).
Figure 2.

Ligand clustering. (A) The seventh largest Murcko cluster of kinesin-like protein 1 (KIF11), showing both the scaffold (left) and all seven member ligands. (B) Number of ligands in each of the 70 KIF11 Bemis–Murcko atomic frameworks. We removed lower affinity compounds over-represented clusters (above the line), while retaining 100 ligands. (C) Number of adenosine A2A receptor (AA2AR) Murcko clusters is plotted against affinity threshold. Fewer than 600 clusters are present using a 30 nM affinity threshold.
To examine the effect of clustering on docking enrichments, we docked the three targets with the highest and lowest fraction of clustered to raw ligands from those with enough ligands to pick one ligand per Murcko cluster. To measure docking performance we used LogAUC, an aggregate metric that gives early enrichment more weight. As described previously,31 LogAUC is completely analogous to AUC but in the transformed space after you have zoomed in on early enrichment by taking the semilog of the x-axis. In tryptase β1 (TRYB1), the target with the highest clustered fraction, clustering substantially decreases the LogAUC by 6%, whereas in the other five targets clustering increases the LogAUC (Supporting Information Table S2). The mean absolute deviation over the six targets is 3.7% LogAUC, but in all cases the raw and clustered ROC curves have similar shapes (data not shown). Overall, we believe the clustered sets provide a better measure of docking performance with lower docking effort and will be used in the remainder of this work.
A key problem with the original DUD decoys was that they sometimes closely resembled the ligands, occasionally even being confirmed as binders. Enforcing 2-D topological dissimilarity between decoys and ligands should eliminate this problem in principle, but in practice critical ligand binding “warheads” often remain in the decoy set selected from ZINC,46 e.g., amidine groups in factor Xa (FA10). By identifying these warheads in three targets (Figure 3A), we investigated how to eliminate false decoys. In the original DUD, CACTVS fingerprints were used to select decoys with Tanimoto coefficients (Tc) to ligands below 0.9, which is roughly similar to using Daylight fingerprints with Tc below 0.7.15 In recent work,31 we used Daylight fingerprints with a more restrictive Tc < 0.5. Using this filter on the enhanced DUD ligand sets, we still saw 39%, 53%, and 96% of possible warhead bearing molecules passing through in factor Xa (FA10), glycinamide ribonucleotide transformylase (PUR2), and thymidine kinase (KITH), respectively (Figure 3B). Using Daylight with Tc < 0.325, we reduced FA10 warheads below 1% but still saw 14% and 34% in PUR2 and KITH. Clearly different targets and even different ligands require different absolute thresholds. To circumvent this, we removed a percentage of the most similar decoys for each ligand, sorted by maximum Tc to any ligand. This allowed the effective absolute threshold to vary. Removing 50% of the decoys with Daylight was better in KITH, while removing 50% with ECFP4 was better in FA10 and PUR2. The final procedure of using ECFP4 fingerprints and removing 75% of the decoys, resulted in 0.2%, 0%, and 5.8% of warheads remaining, substantially reducing the number of false decoys. Having refined the decoy dissimilarity procedure on three targets where we could define a warhead, we then applied it to all generated decoys. To help ensure that the resulting decoys were, in fact, substantially different, topologically, from the ligands, we compared the two by a metric partially orthogonal to topology, asking how many decoy molecules shared the same scaffold as a ligand. Of the 805136 decoy scaffolds over all of DUD-E, only 692 (0.086%) were found among the 25503 ligand scaffolds, consistent with substantial topological differences among the two sets despite their close physical property matching.
Figure 3.

Decoy generation. (A) Three key “warhead” groups from factor Xa (FA10), glycinamide ribonucleotide transformylase (PUR2), and thymidine kinase (KITH). (B) Fraction of warheads remaining is plotted against the dissimilarity method. The dissimilarity methods consist of a fingerprint (Daylight or ECFP4) and either a hard cutoff or a fraction of the most dissimilar decoys to be retained. (C) Property distributions of estrogen receptor α (ESR1) for both the 383 ligands (blue) and the 20685 property-matched decoys (red).
In addition to reducing false decoys, the DUD-E decoy generation procedure was extensively revised. Each decoy derived from a particular ligand, where decoy property ranges around the ligands properties adjusted to seven possible widths. This adapted to local chemical space around each ligand, allowing more closely matched decoys. Also, net charge was added to the property matching, as it is critical in electrostatics and desolvation. The improved property-matching can be seen in the property histograms for estrogen receptor α (ESR1) (Figure 3C) as well as the averages and standard deviations for all the targets (Supporting Information Table S3). Using ZINC46 for the potential decoy pool made them purchasable, enabling experimental testing for actual binding to the target. As a result of this work, this enhanced decoy procedure has been fully automated and is available online to generate DUD-E style decoys for any user supplied list of input ligands at http://decoys.docking.org.
The original DUD paper15 showed that a property-matched decoy set is more challenging for docking than a random collection of molecules. Therefore, we compared enrichments using property-matched decoys to those using a random drug-like background, which consisted of all ChEMBL12 ligands with affinities better than 10 μM. Switching from a drug-like background to DUD-E property-matched decoys does reduce average enrichment over the 102 targets, from 26.8% to 24.4% LogAUC (Supporting Information Table S4). Yet for three targets, the property-matched sets unexpectedly led to much better enrichment, by more than 15% LogAUC. In both glutamate receptor ionotropic kainate 1 (GRIK1) and purine nucleoside phosphorylase (PNPH), the ligands have low molecular weights (Supporting Information Table S3) and thus scored poorly against the generally larger ChEMBL12 molecules, just as Verdonk17 suggests. In urokinase-type plasminogen activator (UROK), the top of the drug-like docking hit list is dominated by decoys with amidine “warheads”. Because these are likely binders, the increased property-matched enrichment resulted from fewer false decoys in that set. Indeed, the 2.4% LogAUC reduction that occurs upon switching to property-matched decoys arises from these two competing factors: property matching the decoys reduces enrichment, and reduction of false decoys increases enrichment.
Overall, enrichment as measured by average LogAUC is 1.5 fold higher in DUD-E compared to the original DUD. To understand this, we first isolated the change due to the revised decoy generation procedure. Using the original DUD ligands and target preparations, but switching from original decoys to these revised decoys substantially increased the average enrichment over the 37 directly comparable targets from 14.8% to 19.7% LogAUC (Table 3, Supporting Information Table S5). With the new adaptive property-matching procedure incorporating net charge, the revised decoys might have been expected to lower enrichment, but instead we saw an overall increase. Inspecting the docking hit lists, we observed a dramatic decrease in high scoring decoys that resemble ligands to a degree that they might actually bind. Indeed, all three targets with identifiable warheads that we used to tune the dissimilarity procedure showed large increases in enrichment: FA10 increases from 13% to 28% LogAUC, PUR2 from 40% to 62% LogAUC, and KITH from 1% to 32% LogAUC. If we now isolate the switch from original ligands and revised decoys to both DUD-E ligands and decoys, we see a moderate decrease in average enrichment from 19.7% to 16.4% LogAUC. We attribute this decrease to the larger, more diverse clustered ligand lists in DUD-E. Lastly, switching the target preparation, and the choice of the particular PDB structure used to represent a target, substantially increases enrichment from 16.4% to 22.8% LogAUC between DUD and DUD-E (Supporting Information Table S5). The overall effect with SEV ligand desolvation in DOCK 3.6 is to increase average enrichment from 14.8% LogAUC against DUD to 22.8% LogAUC against the DUD-E benchmark.
Table 3. Decomposition of Enrichment Changes between DUD and DUD-E.
| incremental change | all original | new style decoys | switch to new ligands | switch target preparation |
|---|---|---|---|---|
| decoys | DUD | DUD-E | DUD-E | DUD-E |
| ligands | DUD | DUD | DUD-E | DUD-E |
| receptor preparation | DUD | DUD | DUD | DUD-E |
| average LogAUCa | 14.8 | 19.7 | 16.4 | 22.8 |
Over the 37 common targets (target-by-target data in Supporting Information Table S5).
A central motivation for any benchmarking set is to test, at least retrospectively, new methods. We wanted to explore how our recent context-dependent ligand desolvation method31 behaved against the DUD-E benchmark. We therefore used it to re-examine the utility of solvent-excluded volume (SEV) ligand desolvation versus using no desolvation term (None) or using the full transfer free energy from water to hexadecane (Full). In our initial study of these terms on the 40 original DUD targets, SEV improved upon None by just 0.7% average LogAUC. Conversely, over the 102 DUD-E targets, SEV substantially outperformed None by 3.8% LogAUC on average, with average LogAUC values of 20.6, 14.3, and 24.4% for None, Full, and SEV desolvation methods, respectively (Figure 4, Supporting Information Table S4). Despite these average trends, ROC curves on individual targets can vary significantly among the various methods (Figure 5). As in the original desolvation analysis, some targets are more amenable to full desolvation, such as catechol O-methyltransferase (COMT) and purine nucleoside phosphorylase (PNPH), while others are more amenable to no desolvation, such as factor X (FA10) and glycinamide ribonucleotide transformylase (PUR2). Against the DUD-E benchmark, SEV desolvation not only outperforms the other methods, but performs well in both types of targets. This suggests that over a more comprehensive set of targets, and what we argue is a better set of ligands and decoys, the advantage of the more physically correct SEV ligand desolvation treatment becomes more pronounced.
Figure 4.

Retrospective enrichment comparing ligand desolvation and electrostatics methods. Docking results over DUD-E as measured by LogAUC. “None” has no ligand desolvation term, “SEV” uses solvent-excluded volume ligand desolvation, “Thin” employs a thin low-dielectric layer in the electrostatic calculations.
Figure 5.

Representative ROC plots. ROC plots using no desolvation (None), solvent-excluded volume ligand desolvation (SEV), the thin low-dielectric layer (Thin), or a drug-like background that consists of all ChEMBL12 ligands with affinities better than 10 μM (Drug-like). The black dotted line represents the results expected from docking ligands randomly. LogAUC percentages are reported in the legend text.
Electrostatic interaction with the protein is a large term that opposes ligand desolvation, with their relative balance being critical for binding. Because we do not know the binding pose of putative ligands prior to docking, we need to approximate the region of low dielectric the ligand might occupy to precompute electrostatic grids. Previously, we used the negative image of the receptor (computed by SPHGEN) to construct this low dielectric region, but manual tweaking was often required. In the large open binding pocket of CXCR4, we observed that using a thin layer of low-dielectric around just the edge of the protein allowed ligands to interact with it while reducing the bulk dielectric perturbation at the center of its large binding pocket.3 Here we explored using an automated thin dielectric layer strategy across the entire DUD-E set. Visually, these new automated thinner dielectric layers are more physically realistic, even in the rare case when they are effectively thicker than the previous layers (due to a water probe being able to penetrate that layer). With these thin low-dielectric layers (Thin), the average LogAUC over the 102 targets improved from 24.4% to 24.9% (Figure 4, Supporting Information Table S4). Six targets used manually prepared dielectric layers (AA2A2, ADRB1, AMPC, CDK2, CXCR4, and DRD3) and thus do not directly reflect the difference between automated dielectric layers. Excluding those six enlarges the average difference from 0.5% to 1.0% LogAUC. Admittedly, these are moderate differences, but they exemplify how DUD-E may be used to test new docking methods and hint that as we progress docking models, enrichment will improve.
Here we present three representative targets in greater detail to display a magnified view of DUD-E.
Mineralocorticoid Receptor (MCR)
MCR has the lowest enrichment in DUD-E. Across all 11 automatically docked structures, enrichment of DUD-E ligands to its decoys was negligible. Thus we selected the same PDB structure as the original DUD, 2AA2 at 1.95 Å resolution. While enrichment using the new DUD-E sets was worse than random at −4% LogAUC and 36% AUC (Table 2), using the original DUD ligands and decoys gave 45% LogAUC and 76% AUC. Despite poor enrichment in DUD-E, building and docking the crystal ligand from scratch, ignoring crystallographic information, resulted in good pose agreement (Figure 6A). Taken together, we can rationalize the enrichment differences, as 13 of 15 original ligands shared a polycyclic scaffold with the well-docked crystal ligand, while the 94 new ligands had much more scaffold diversity. Thus the reduced enrichment in DUD-E reflects increased chemotype diversity as a result of including more ligands and clustering them by Bemis–Murcko atomic frameworks. Of the four lowest enriching targets in DUD-E, three are nuclear hormone receptors, with glucocorticoid receptor (GCR) and androgen receptor (ANDR) joining MCR. These receptors all have hydrophobic pockets with flexible binding site residues such as methionine and leucine so that a single rigid receptor may be incapable of docking all of their ligands. Thus these targets may be good tests of flexible receptor docking methods.
Figure 6.

Representative docking poses. The crystallographic ligand was rebuilt and docked from scratch. (A–F) The crystal pose (magenta) is compared to the resulting docked pose (green). In (C), more ligand conformations are generated and the redocked pose is also shown (tan). Key hydrogen bonds are shown by black dotted lines, and the partially transparent protein surface is colored by atom type.
Thyroid Hormone Receptor β1 (THB)
THB produced good enrichment when a structure with an open subpocket was selected. Enrichment for the 16 automatically docked structures varies significantly, ranging from 13% (1NQ0) to 37% LogAUC (1Q4X). The lower enriching structures have larger cavities near Arg320 (right side of Figure 6B), opening to solvent in 1NQ0; the higher enriching structures have larger cavities at the other end of the binding site near Met420 (left side), opening to solvent in 1Q4X. We selected the automated preparation of 1Q4X despite its modest 2.80 Å resolution because Thr273 is pushed away by the crystal ligand, making the left subpocket larger. Using SEV desolvation then yields enrichment statistics of 36% LogAUC, 79% AUC, and a receiver operating characteristic curve based enrichment factor at 1% (EF1) of 38 (Table 2). The redocked crystal ligand has excellent pose agreement (Figure 6B).
Serine/Threonine-Protein Kinase AKT (AKT1)
AKT1 is a newly added kinase that demonstrates several considerations during PDB structure selection. Whereas 10 PDB structures were automatically docked, four got worse than random enrichment. All four correspond to structures of the Pleckstrin homology (PH) domain instead of the kinase domain. The structure with the best normal AUC, 3O96, corresponds to an allosteric site at the interface of the PH and kinase domains, not the traditional ATP binding pocket. While the best enriching structure by LogAUC, 3CQW at 2.00 Å, corresponds to the canonical site, its nonstandard phosphothreonine amino acid evades the automated protocol. Preparing that residue manually results in 27% LogAUC, 72% AUC, and 29 EF1 (Table 2). Nevertheless, the redocked ligand (green) fails to generate the crystal ligand pose (magenta) (Figure 6C). The ligand, however, is quite small, with one central rotatable bond, and requires a specific rotation about that bond to fit in the binding site. Lowering the rmsd threshold for ligand conformation generation allows that rotation to be sampled, restoring the correct ligand binding pose (tan) (Figure 6C).
Discussion
Docking continues to be judged by hit rates in prospective studies, and by enrichment in retrospective recall studies, because it cannot now hope to calculate affinities or even monotonic rank order. Like protein structure prediction, docking thus remains an empirical, although we would argue also a pragmatic field. Its reliance on enrichment has driven the development of benchmarking sets, first explored by Rognan11 and Jain,12 recently investigated by Boeckler32 and Cavasotto;34 the most widely used and cited of these remains the Directory of Useful Decoys (DUD).15 Despite its widespread adoption, DUD retains serious liabilities, including a lack of ligand diversity, lack of property-matching to net charge, and a substantial number of false decoys. The enhanced DUD (DUD-E) described here was developed to address these shortcomings and to expand the target list to be more reprentative of pharmacologically relevant space.
Balancing Ligands and Decoys for Enrichment
An important problem with DUD arose from the ligands and decoys originally chosen. The former sometimes over-represented in a few chemotypes, and the latter were sometimes not decoys but actually ligands. Moreover, the mapping of specific ligands to their matched decoys had been lost in the released set. In the 102 ligand and decoy sets that comprise DUD-E, ligand diversity in any given set is substantially increased, reducing the bias that can come from a single chemotype ranking well. With at least 40 ligands for every target and a preference to maximize chemotype diversity, DUD-E allows for more representative tests of docking screens. Correspondingly, property-matching decoys to each ligand individually, while more stringently removing false decoys (i.e., ligands), allows investigators to directly match specific ligands to their decoy molecules and reduces what had been artifactually low enrichment for some targets in DUD. Adding net charge as a property to match between ligands and decoys resolves a discrepancy between them in DUD, where the ligands had tended to be more charged, on average, than the decoys, which had the effect of skewing our evaluation of physical forces like desolvation.
The impact of these changes on docking performance is substantial and clarifying. In isolation from other effects, clustering the ligands for diversity reduces enrichment, as one might expect because high-performing, over-represented sets have been largely removed. Conversely, the new decoys increase enrichment compared to the DUD performance. At first this seemed counterintuitive, because one imagines that a better-balanced, more stringent decoy set will be a greater challenge for a docking program. However, this is more than balanced by the removal of what had been false decoys (ligands), which artifactually reduced enrichment in DUD because, as ligands, they had often ranked well but counted as decoys they diluted the annotated ligands. Finally, the new target preparations, carefully selected from a docking campaign to over 3500 structures, also increased enrichment. Overall, the increased enrichment in DUD-E should provide more sensitivity for benchmarking docking algorithms, giving it greater responsiveness to modifications that reduce enrichment as well as those that increase it.
Online Tools for Automated Generation of Further Ligand and Decoy Sets
DUD-E is built to be a better platform for refinement and extension of ligand and decoy sets. Targets are independent of one another, both in ligands and decoys, allowing target addition, deletion, or replacement. The protocol to generate decoys for DUD-E is made available online to generate decoys for any target given only a list of ligand structures, which enables extension of DUD-E to new targets of interest by individual investigators. The decoy server pulls directly from a purchasable subset of the ZINC database, inheriting its improvements and purchasing updates.46 The final decoy selection from the applicable pool of decoys is random where possible, allowing the generation of multiple decoys sets to test overfitting to the canonical DUD-E decoys. Each decoy belongs to one and only one ligand, so if one wants to filter a ligand, then the corresponding decoys can be easily removed. For example, we provide raw ligand and decoy sets before clustering by Bemis–Murcko atomic frameworks. If a different clustering method was desired, which selected a different subset of the raw ligands, then the corresponding decoys could be retained (furthermore, we provide the python script used to generate clustered subsets from raw sets). We also include extra data that allows some design decisions to be altered, for instance, we include the marginal ligands which are active above our 1 μM cutoff.
Applications to Docking Optimization and Testing
DUD-E should provide a more robust benchmarking set for exploring new docking methods, so we were keen to test it against new methods that we had been investigating. When tested against the older DUD set, we had found that a new solvent-excluded volume (SEV) ligand desolvation method had had a disappointingly small effect on enrichment despite what was clearly a better physical model. However, when measured against the DUD-E benchmark, the differential performance between the old and new method increased substantially in the latter’s favor. Similarly, against the DUD-E benchmark, a more physically realistic dielectric layer, used to calculated the electrostatic interaction term from static Poission–Boltzmann maps, also led to improved enrichments that had been largely masked in the DUD set, owing to the problems described above.
Certain cautions merit airing. Most importantly, DUD-E is a large data set synthesized from several source databases, each of which is continuously evolving and improving. Thus individual errors are expected, though usually traceable to the source database at the time DUD-E was constructed. Although we only show docking results using DOCK 3.6 with solvent-excluded volume ligand desolvation, DUD-E was designed to be a general benchmarking set. Thus some arbitrary choices and simplifying assumptions were made in the effort to provide one canonical data set useful to compare docking algorithms. For instance, we assume a single PDB code can represent the target, but some targets are highly flexible or they contain both orthosteric and allosteric binding pockets. Fundamentally, DUD and DUD-E are designed to measure value-added screening performance of 3-D methods over simple 1-D molecular properties. Decoys that might bind are removed using 2-D ligand similarity, so DUD-E is inappropriate to test 2-D methods. Through its construction, ligands light up against DUD-E decoys using these 2-D similarity methods, which create an artificially favorable enrichment bias for them. A final caution is that to filter more false decoys in DUD-E, we keep only a quarter of the most highly dissimilar decoys. However, while we show that this increased dissimilarity removes false decoys, it could also contribute to artificial increases in docking enrichment.
Notwithstanding these caveats, DUD-E is substantially improved over the original DUD. It is a larger, more diverse data set with better matched decoys that resemble ligands less, correcting many flaws in its predecessor. Although we anticipate that it will be most widely used in the instantiation we describe here, it was developed with the idea that it could be flexibly extended and evolved; the tools to do so are even provided online (http://dude.docking.org). We hope that it and its descendants will provide a useful tool for docking evaluation in the community until such time as a more fundamental measurement of docking performance is possible.
Methods
ChEMBL and RCSB PDB Data Extraction
This enhanced DUD database has been constructed by combining ligand data from ChEMBL38 and structural data from RCSB PDB40 (Supporting Information Figure S1A). Ligands assigned to protein targets (ChEMBL confidence score ≥4) with affinities (IC50, EC50, Ki, Kd, and log variants thereof) of 1 μM or better were extracted from the ChEMBL09 database.38 Similarly, we assigned experimental decoys as molecules with no measurable affinity at 30 μM or higher (greater than relation only). The remaining ligands with affinities above 1 μM, and decoys with no measurable affinity below 30 μM, are included for completeness and dubbed “marginal”. Via ChEMBL, ligands are associated with a particular target sequence by UniProt41 accession code, and then mapped47 from UniProt accession codes to protein data bank (PDB) structures (X-ray only) using http://www.uniprot.org/docs/pdbtosp.txt, obtained on February 23, 2011.
Target Selection Docking
Preliminary docking calculations were performed on each PDB structure that mapped to ChEMBL ligands and contained a single, unambiguous cocrystal ligand as prepared by DOCK Blaster.42 Property-matched computational decoys were generated by the automated decoy generation procedure below, using Daylight fingerprints with a Tanimoto coefficient (Tc) threshold below 0.5. These decoys were docked and compared to their cognate ligands using DOCK 3.6 with solvent-excluded volume (SEV) ligand desolvation.31 Balancing the parallel goals of diversity, drug relevance, many ligands and structures, and at least modest automated docking enrichment, we selected 119 tentative targets for the new DUD. This list was reduced to the final 102 targets by factors such as ligand and PDB duplication between targets (e.g., FNTB duplicates FNTA), low resolution structures (RAF1), sterically constrained binding sites (NR1H2, THA), or over-representation (MK08, MTOR).
Target Preparation
For each target, we assembled all UniProt accession codes (species) with any raw ChEMBL compounds (ligands, decoys, marginal ligands, or marginal decoys). For only those accession codes, structures were extracted using the ChEMBL to PDB mapping, except P07700 was manually added to ADRB1 to include six more rare structures for that GPCR. This procedure neglects those PDB structures that belong to an accession code having no ChEMBL compounds. For example, 1KIM is the PDB structure of thymidine kinase (KITH) in the original DUD. This KITH structure is from herpes virus (UniProt P03176), an accession code with no raw compounds extracted from ChEMBL, and is thus not included in the ChEMBL/PDB intersection used to construct the new DUD. Still, 5025 PDB codes were sent to an updated DOCK Blaster pipeline for automated docking preparation (Supporting Information Figure S1D). In some cases, an unambiguous ligand could not be found to indicate the binding site, but we were able to assign 565 additional ligands by manually inspecting over 1300 structures. Ultimately, 3692 structures completed input grid preparation, and all but two finished docking and enrichment analysis. Clustered ligands sets were docked to property-matched decoys (both described below) using ECFP4 fingerprints and removing the most similar 75% of queried decoys. DOCK 3.6 was run using SEV ligand desolvation (as below). For each target, enrichment, resolution, and organism were collected and sorted by enrichment in pdb_analyze.txt, available online at http://dude.docking.org. Crude notes on the selection process are recorded in pdb_selection.txt, and the picked structure is listed in pdb_blessed.txt. AA2AR and DRD3 docking preparations were provided by Jens Carlson,44,45 CXCR4 partially by Dahlia Weiss,3 ADRB1 by Peter Kolb (personal communication), and AMPC by Sarah Barelier, Oliv Eidam, and Inbar Fish (unpublished results).
Ligand Preparation
To prepare ligand sets for each target, ChEMBL affinities and log variants were first normalized to nM units (Supporting Information Figure S1B). Salts were removed, charges were normalized, and properties were calculated using Molinspiration’s mib package (www.molinspiration.com). Ligands with 600 Da or higher molecular weight or with 20 or more rotatable bonds were removed. Smiles were put in canonical form using OpenEye’s OEChem software.48 Ligand sets from each species were combined, sorted by ascending normalized affinity, and then made unique based on canonical smiles. The same procedure was used to collate the experimental decoys, marginal ligands, and marginal decoys. For AmpC β-lactamase (AMPC), an original DUD target, the ChEMBL09 ligands are covalent in nature. To identify noncovalent ligands, we manually compiled ligands6,43,49,50 with affinities below 5 mM and experimental decoys43,51 from the literature.
Ligand Clustering
To reduce the sometimes large number of ChEMBL ligands down to a manageable size while also increasing scaffold diversity as suggested by Good and Oprea,27 we clustered the ligands by their Bemis–Murcko atomic frameworks,39 as generated by Molinspiration’s mib. If there were 100 or more frameworks, we chose only the highest affinity ligand from each. If there were fewer than 100 Murcko frameworks, we increased the number of highest affinity ligands taken from each until we achieved at least 100 ligands (or until all ligands were included). Conversely, if there were more than 600 Murcko frameworks, then we decreased the ligand affinity threshold in the sequence [1 μM, 300 nM, 100 nM, 30 nM, 10 nM, 3 nM] until fewer than 600 frameworks were present, where we then took the highest affinity ligand from each framework. While clustered ligand sets are the default, the full unclustered ligand sets and corresponding decoys are available. The script (subset_decoys.py) used to select the clustered subset given the ligand ids is provided with the full ligand set to enable other clustering algorithms or filtering methods to be substituted.
Automated Decoy Generation
As in the original DUD, we property-matched decoys to ligands using molecular weight, estimated water–octanol partition coefficient (miLogP), rotatable bonds, hydrogen bond acceptors, and hydrogen bond donors, plus we added net charge. We generated all ligand protonation states in pH range 6–8 using Schrödinger’s Epik with arguments “-ph 7.0 -pht 1.0 -tp 0.20” (Supporting Information Figure S1C). Molecular properties were then computed using Molinspiration’s mib. Over all the protonated forms of a given ligand, we kept only those with a unique set of the six physicochemical properties. For each of these unique property sets, we aimed to generate 50 matched decoys. For example, a single input ligand predicted to have two alternate charges would get 50 decoys property-matched to each charge. To accomplish this, a pool of decoys was selected from ZINC46 using a dynamic protocol that adapted to local chemical space by narrowing or widening windows in seven steps around the six properties. The goal was to return 3000–9000 potential decoys that matched the decoy’s reference protonation state (predicted most prevalent form at pH 7.05). In the final decoy procedure, ECFP4 fingerprints were generated by Scitegic’s Pipeline Pilot for ligands and potential decoys. The decoys were sorted by their maximum Tc to any ligand, and the most dissimilar 25% were retained through this dissimilarity filter. We then remove duplicate decoys from the ligand set by sorting decoys from least to most duplicated and assigned each decoy to the protonated ligand which has the least number of decoys already assigned. This ensures unique decoys were spread across the ligands as evenly as possible. Finally, if available, 50 decoys were picked randomly from this deduplicated list.
Original DUD Comparison
For the original DUD comparison, we downloaded ligands and decoys from dud.docking.org and prepared docking flexibases with our modern ZINC toolchain.46 The original DUD target preparations were copies of the original, modified to perform SEV desolvation calculations as described previously.31 We also generated DUD-E style automated decoys and flexibases for the original DUD ligands. The analysis was performed on the 37 directly comparable targets, excluding the original targets PDGFrb, ERagonist, and ERantagonist.
Docking Calculations
Except as noted, docking calculations were performed with DOCK 3.6 and solvent-excluded volume (SEV) ligand desolvation as described previously.31 Ligand conformations were generated by OpenEye’s Omega.52 For sampling, the minimum number of graph matching nodes was changed to 3, and ligand overlap was changed to 0.1. Ligands were limited to between 5 and 100 heavy atoms. The timeout for an individual ligand hierarchy was 180 s. We performed 200 steps of simplex minimization, with initial translations of 0.2 Å and initial rotations of 5°. The thin dielectric layer Delphi spheres were created by walking out each DMS (http://www.cgl.ucsf.edu/Overview/ftp/dms.zip) surface normal by 1.8 Å and placing a sphere. This thin sphere layer is then used as input to makespheres1.pl in place of the usual SPHGEN spheres. The random background calculations were performed using SEV desolvation by seeding the DUD-E ligands into the entire ChEMBL12_10 subset of ZINC, which includes 273375 ligands with annotated affinities below 10 μM.
Docking Metrics
The area under the curve (AUC) of the receiver operating characteristic (ROC) is one common metric to measure docking performance. However, ROC plots often use a semilog transformation of the x-axis to zoom in on early changes. As described previously,31 LogAUC is completely analogous to AUC in this transformed space, measuring the percentage of the unit area under the curve. Formally, we use the adjusted LogAUC0.001 here, which spans three decades of log space and subtracts the LogAUC of the random curve (14.462%) so that random enrichment is 0%. We typically refer to the adjusted LogAUC0.001 as either adjusted LogAUC or simply LogAUC. The ROC-based enrichment factor at 1% (EF1) is the percent of ligands found when 1% of the decoys have been found and is preferred over traditional enrichment factors.53
Acknowledgments
Supported by NIH grant GM71896 (to J.J.I. and B.K.S.). We thank Andrew Good for discussions that initiated DUD-E. We thank Teague Sterling for website development and Sunil Koovakkat for DOCK bugfixes. We are grateful to the commercial software vendors who support ZINC and the decoy generation toolchain: Molinspiration (Bratislava, Slovakia) for mib, OpenEye Scientific Software (Santa Fe, NM) for OEChem, Omega, and QuacPac, Molecular Networks (Erlangen, Germany) for Corina, Accelrys (San Diego, CA) for Pipeline Pilot, and ChemAxon (Budapest, Hungary) for cxcalc. We thank Oliv Eidam, Matthew Merski, and Nir London for reading this manuscript.
Glossary
Abbreviations Used
- DUD
Directory of Useful Decoys
- DUD-E
Directory of Useful Decoys—Enhanced
- EF1
enrichment factor at 1% of ROC curve
- PH
pleckstrin homology
- ROC
receiver operating characteristic
- SEV
solvent-excluded volume
- Tc
Tanimoto coefficient
Supporting Information Available
Figure showing DUD-E workflows, while tables provide detailed target-by-target data and tab delimited text files provide the raw data. This material is available free of charge via the Internet at http://pubs.acs.org.
The authors declare no competing financial interest.
Funding Statement
National Institutes of Health, United States
Supplementary Material
References
- Kitchen D. B.; Decornez H.; Furr J. R.; Bajorath J. Docking and scoring in virtual screening for drug discovery: methods and applications. Nature Rev. Drug Discovery 2004, 3, 935–949. [DOI] [PubMed] [Google Scholar]
- Kolb P.; Rosenbaum D. M.; Irwin J. J.; Fung J. J.; Kobilka B. K.; Shoichet B. K. Structure-based discovery of beta(2)-adrenergic receptor ligands. Proc. Natl. Acad. Sci. U.S.A. 2009, 106, 6843–6848. [DOI] [PMC free article] [PubMed] [Google Scholar]
- Mysinger M. M.; Weiss D. R.; Ziarek J. J.; Gravel S.; Doak A. K.; Karpiak J.; Heveker N.; Shoichet B. K.; Volkman B. F. Structure-based ligand discovery for the protein–protein interface of chemokine receptor CXCR4. Proc. Natl. Acad. Sci. U.S.A. 2012, 109, 5517–5522. [DOI] [PMC free article] [PubMed] [Google Scholar]
- Gruneberg S.; Stubbs M. T.; Klebe G. Successful virtual screening for novel inhibitors of human carbonic anhydrase: strategy and experimental confirmation. J. Med. Chem. 2002, 45, 3588–3602. [DOI] [PubMed] [Google Scholar]
- Jain A. N.; Nicholls A. Recommendations for evaluation of computational methods. J. Comput.-Aided Mol. Des. 2008, 22, 133–139. [DOI] [PMC free article] [PubMed] [Google Scholar]
- Babaoglu K.; Simeonov A.; Irwin J. J.; Nelson M. E.; Feng B.; Thomas C. J.; Cancian L.; Costi M. P.; Maltby D. A.; Jadhav A.; Inglese J.; Austin C. P.; Shoichet B. K. Comprehensive mechanistic analysis of hits from high-throughput and docking screens against beta-lactamase. J. Med. Chem. 2008, 51, 2502–2511. [DOI] [PMC free article] [PubMed] [Google Scholar]
- Ferreira R. S.; Simeonov A.; Jadhav A.; Eidam O.; Mott B. T.; Keiser M. J.; McKerrow J. H.; Maloney D. J.; Irwin J. J.; Shoichet B. K. Complementarity between a docking and a high-throughput screen in discovering new cruzain inhibitors. J. Med. Chem. 2010, 53, 4891–4905. [DOI] [PMC free article] [PubMed] [Google Scholar]
- Gohlke H.; Klebe G. Approaches to the description and prediction of the binding affinity of small-molecule ligands to macromolecular receptors. Angew. Chem., Int. Ed. Engl. 2002, 41, 2644–2676. [DOI] [PubMed] [Google Scholar]
- Enyedy I. J.; Egan W. J. Can we use docking and scoring for hit-to-lead optimization?. J. Comput.-Aided Mol. Des. 2008, 22, 161–168. [DOI] [PubMed] [Google Scholar]
- Stahl M.; Rarey M. Detailed analysis of scoring functions for virtual screening. J. Med. Chem. 2001, 44, 1035–1042. [DOI] [PubMed] [Google Scholar]
- Bissantz C.; Folkers G.; Rognan D. Protein-based virtual screening of chemical databases. 1. Evaluation of different docking/scoring combinations. J. Med. Chem. 2000, 43, 4759–4767. [DOI] [PubMed] [Google Scholar]
- Pham T. A.; Jain A. N. Parameter estimation for scoring protein–ligand interactions using negative training data. J. Med. Chem. 2006, 49, 5856–5868. [DOI] [PubMed] [Google Scholar]
- Kellenberger E.; Rodrigo J.; Muller P.; Rognan D. Comparative evaluation of eight docking tools for docking and virtual screening accuracy. Proteins 2004, 57, 225–242. [DOI] [PubMed] [Google Scholar]
- Ferrara P.; Gohlke H.; Price D. J.; Klebe G.; Brooks C. L. III. Assessing scoring functions for protein–ligand interactions. J. Med. Chem. 2004, 47, 3032–3047. [DOI] [PubMed] [Google Scholar]
- Huang N.; Shoichet B. K.; Irwin J. J. Benchmarking sets for molecular docking. J. Med. Chem. 2006, 49, 6789–6801. [DOI] [PMC free article] [PubMed] [Google Scholar]
- Christofferson A. J.; Huang N.. How to benchmark methods for structure-based virtual screening of large compound libraries. In Computational Drug Discovery and Design (Methods in Molecular Biology); 2011/12/21 ed.; Baron R., Ed.; Springer Protocols: New York, 2012; Vol. 819, Chapter 13, pp 187–195. [DOI] [PubMed] [Google Scholar]
- Verdonk M. L.; Berdini V.; Hartshorn M. J.; Mooij W. T.; Murray C. W.; Taylor R. D.; Watson P. Virtual screening using protein–ligand docking: avoiding artificial enrichment. J. Chem. Inf. Comput. Sci. 2004, 44, 793–806. [DOI] [PubMed] [Google Scholar]
- Kuntz I. D.; Chen K.; Sharp K. A.; Kollman P. A. The maximal affinity of ligands. Proc. Natl. Acad. Sci. U.S.A. 1999, 96, 9997–10002. [DOI] [PMC free article] [PubMed] [Google Scholar]
- Fan H.; Irwin J. J.; Webb B. M.; Klebe G.; Shoichet B. K.; Sali A. Molecular Docking Screens Using Comparative Models of Proteins. J. Chem. Inf. Model. 2009, 49, 2512–2527. [DOI] [PMC free article] [PubMed] [Google Scholar]
- Repasky M. P.; Murphy R. B.; Banks J. L.; Greenwood J. R.; Tubert-Brohman I.; Bhat S.; Friesner R. A. Docking performance of the glide program as evaluated on the Astex and DUD datasets: a complete set of glide SP results and selected results for a new scoring function integrating WaterMap and glide. J. Comput.-Aided Mol. Des. 2012, 10.1007/s10822-012-9575-9. [DOI] [PubMed] [Google Scholar]
- Brozell S. R.; Mukherjee S.; Balius T. E.; Roe D. R.; Case D. A.; Rizzo R. C. Evaluation of DOCK 6 as a pose generation and database enrichment tool. J. Comput.-Aided Mol. Des. 2012, 10.1007/s10822-012-9565-y. [DOI] [PMC free article] [PubMed] [Google Scholar]
- Neves M. A.; Totrov M.; Abagyan R. Docking and scoring with ICM: the benchmarking results and strategies for improvement. J. Comput.-Aided Mol. Des. 2012, 10.1007/s10822-012-9547-0. [DOI] [PMC free article] [PubMed] [Google Scholar]
- Spitzer R.; Jain A. N. Surflex-Dock: docking benchmarks and real-world application. J. Comput.-Aided Mol. Des. 2012, 10.1007/s10822-011-9533-y. [DOI] [PMC free article] [PubMed] [Google Scholar]
- Schneider N.; Hindle S.; Lange G.; Klein R.; Albrecht J.; Briem H.; Beyer K.; Claussen H.; Gastreich M.; Lemmen C.; Rarey M. Substantial improvements in large-scale redocking and screening using the novel HYDE scoring function. J. Comput.-Aided Mol. Des. 2011, 10.1007/s10822-011-9531-0. [DOI] [PubMed] [Google Scholar]
- Liebeschuetz J. W.; Cole J. C.; Korb O. Pose prediction and virtual screening performance of GOLD scoring functions in a standardized test. J. Comput.-Aided Mol. Des. 2012, 10.1007/s10822-012-9551-4. [DOI] [PubMed] [Google Scholar]
- Novikov F. N.; Stroylov V. S.; Zeifman A. A.; Stroganov O. V.; Kulkov V.; Chilov G. G. Lead Finder docking and virtual screening evaluation with Astex and DUD test sets. J. Comput.-Aided Mol. Des. 2012, 10.1007/s10822-012-9549-y. [DOI] [PubMed] [Google Scholar]
- Good A. C.; Oprea T. I. Optimization of CAMD techniques 3. Virtual screening enrichment studies: a help or hindrance in tool selection?. J. Comput.-Aided Mol. Des. 2008, 22, 169–178. [DOI] [PubMed] [Google Scholar]
- Mackey M. D.; Melville J. L. Better than random? The chemotype enrichment problem. J. Chem. Inf. Model. 2009, 49, 1154–1162. [DOI] [PubMed] [Google Scholar]
- Hawkins P. C.; Warren G. L.; Skillman A. G.; Nicholls A. How to do an evaluation: pitfalls and traps. J. Comput.-Aided Mol. Des. 2008, 22, 179–190. [DOI] [PMC free article] [PubMed] [Google Scholar]
- Irwin J. J. Community benchmarks for virtual screening. J. Comput.-Aided Mol. Des. 2008, 22, 193–199. [DOI] [PubMed] [Google Scholar]
- Mysinger M. M.; Shoichet B. K. Rapid context-dependent ligand desolvation in molecular docking. J. Chem. Inf. Model. 2010, 50, 1561–1573. [DOI] [PubMed] [Google Scholar]
- Vogel S. M.; Bauer M. R.; Boeckler F. M. DEKOIS: demanding evaluation kits for objective in silico screening—a versatile tool for benchmarking docking programs and scoring functions. J. Chem. Inf. Model. 2011, 51, 2650–2665. [DOI] [PubMed] [Google Scholar]
- Wallach I.; Lilien R. Virtual decoy sets for molecular docking benchmarks. J. Chem. Inf. Model. 2011, 51, 196–202. [DOI] [PubMed] [Google Scholar]
- Gatica E. A.; Cavasotto C. N. Ligand and decoy sets for docking to G protein-coupled receptors. J. Chem. Inf. Model. 2012, 52, 1–6. [DOI] [PubMed] [Google Scholar]
- Cereto-Massague A.; Guasch L.; Valls C.; Mulero M.; Pujadas G.; Garcia-Vallve S. DecoyFinder: an easy-to-use python GUI application for building target-specific decoy sets. Bioinformatics 2012, 28, 1661–1662. [DOI] [PubMed] [Google Scholar]
- Rohrer S. G.; Baumann K. Maximum unbiased validation (MUV) data sets for virtual screening based on PubChem bioactivity data. J. Chem. Inf. Model. 2009, 49, 169–184. [DOI] [PubMed] [Google Scholar]
- Ripphausen P.; Wassermann A. M.; Bajorath J. REPROVIS-DB: a benchmark system for ligand-based virtual screening derived from reproducible prospective applications. J. Chem. Inf. Model. 2011, 51, 2467–2473. [DOI] [PubMed] [Google Scholar]
- Gaulton A.; Bellis L. J.; Bento A. P.; Chambers J.; Davies M.; Hersey A.; Light Y.; McGlinchey S.; Michalovich D.; Al-Lazikani B.; Overington J. P. ChEMBL: a large-scale bioactivity database for drug discovery. Nucleic Acids Res. 2012, 40, D1100–1107. [DOI] [PMC free article] [PubMed] [Google Scholar]
- Bemis G. W.; Murcko M. A. The properties of known drugs. 1. Molecular frameworks. J. Med. Chem. 1996, 39, 2887–2893. [DOI] [PubMed] [Google Scholar]
- Berman H. M.; Westbrook J.; Feng Z.; Gilliland G.; Bhat T. N.; Weissig H.; Shindyalov I. N.; Bourne P. E. The Protein Data Bank. Nucleic Acids Res. 2000, 28, 235–242. [DOI] [PMC free article] [PubMed] [Google Scholar]
- Apweiler R.; Bairoch A.; Wu C. H.; Barker W. C.; Boeckmann B.; Ferro S.; Gasteiger E.; Huang H.; Lopez R.; Magrane M.; Martin M. J.; Natale D. A.; O’Donovan C.; Redaschi N.; Yeh L. S. UniProt: The Universal Protein Knowledgebase. Nucleic Acids Res. 2004, 32, D115–D119. [DOI] [PMC free article] [PubMed] [Google Scholar]
- Irwin J. J.; Shoichet B. K.; Mysinger M. M.; Huang N.; Colizzi F.; Wassam P.; Cao Y. Automated docking screens: a feasibility study. J. Med. Chem. 2009, 52, 5712–5720. [DOI] [PMC free article] [PubMed] [Google Scholar]
- Powers R. A.; Morandi F.; Shoichet B. K. Structure-based discovery of a novel, noncovalent inhibitor of AmpC beta-lactamase. Structure 2002, 10, 1013–1023. [DOI] [PubMed] [Google Scholar]
- Carlsson J.; Yoo L.; Gao Z. G.; Irwin J. J.; Shoichet B. K.; Jacobson K. A. Structure-based discovery of A2A adenosine receptor ligands. J. Med. Chem. 2010, 53, 3748–3755. [DOI] [PMC free article] [PubMed] [Google Scholar]
- Carlsson J.; Coleman R. G.; Setola V.; Irwin J. J.; Fan H.; Schlessinger A.; Sali A.; Roth B. L.; Shoichet B. K. Ligand discovery from a dopamine D3 receptor homology model and crystal structure. Natre Chem. Biol. 2011, 7, 769–778. [DOI] [PMC free article] [PubMed] [Google Scholar]
- Irwin J. J.; Shoichet B. K. ZINC—a free database of commercially available compounds for virtual screening. J. Chem. Inf. Model. 2005, 45, 177–182. [DOI] [PMC free article] [PubMed] [Google Scholar]
- Velankar S.; McNeil P.; Mittard-Runte V.; Suarez A.; Barrell D.; Apweiler R.; Henrick K. E-MSD: an integrated data resource for bioinformatics. Nucleic Acids Res. 2005, 33, D262–265. [DOI] [PMC free article] [PubMed] [Google Scholar]
- Hawkins P. C.; Skillman A. G.; Nicholls A. Comparison of shape-matching and docking as virtual screening tools. J. Med. Chem. 2007, 50, 74–82. [DOI] [PubMed] [Google Scholar]
- Teotico D. G.; Babaoglu K.; Rocklin G. J.; Ferreira R. S.; Giannetti A. M.; Shoichet B. K. Docking for fragment inhibitors of AmpC beta-lactamase. Proc. Natl. Acad. Sci. U.S.A. 2009, 106, 7455–7460. [DOI] [PMC free article] [PubMed] [Google Scholar]
- Tondi D.; Morandi F.; Bonnet R.; Costi M. P.; Shoichet B. K. Structure-based optimization of a non-beta-lactam lead results in inhibitors that do not up-regulate beta-lactamase expression in cell culture. J. Am. Chem. Soc. 2005, 127, 4632–4639. [DOI] [PMC free article] [PubMed] [Google Scholar]
- Graves A. P.; Brenk R.; Shoichet B. K. Decoys for docking. J. Med. Chem. 2005, 48, 3714–3728. [DOI] [PMC free article] [PubMed] [Google Scholar]
- Hawkins P. C.; Skillman A. G.; Warren G. L.; Ellingson B. A.; Stahl M. T. Conformer generation with OMEGA: algorithm and validation using high quality structures from the Protein Data Bank and Cambridge Structural Database. J. Chem. Inf. Model. 2010, 50, 572–584. [DOI] [PMC free article] [PubMed] [Google Scholar]
- Jain A. N. Bias, reporting, and sharing: computational evaluations of docking methods. J. Comput.-Aided Mol. Des. 2008, 22, 201–212. [DOI] [PubMed] [Google Scholar]
Associated Data
This section collects any data citations, data availability statements, or supplementary materials included in this article.