Abstract
The role of autophagy in the response of human hepatocytes to oxidative stress remains unknown. Understanding this process may have important implications for the understanding of basic liver epithelial cell biology and the responses of hepatocytes during liver disease. To address this we isolated primary hepatocytes from human liver tissue and exposed them ex vivo to hypoxia and hypoxia-reoxygenation (H-R). We showed that oxidative stress increased hepatocyte autophagy in a reactive oxygen species (ROS) and class III PtdIns3K-dependent manner. Specifically, mitochondrial ROS and NADPH oxidase were found to be key regulators of autophagy. Autophagy involved the upregulation of BECN1, LC3A, Atg7, Atg5 and Atg 12 during hypoxia and H-R. Autophagy was seen to occur within the mitochondria of the hepatocyte and inhibition of autophagy resulted in the lowering a mitochondrial membrane potential and onset of cell death. Autophagic responses were primarily observed in the large peri-venular (PV) hepatocyte subpopulation. Inhibition of autophagy, using 3-methyladenine, increased apoptosis during H-R. Specifically, PV human hepatocytes were more susceptible to apoptosis after inhibition of autophagy. These findings show for the first time that during oxidative stress autophagy serves as a cell survival mechanism for primary human hepatocytes.
Keywords: apoptosis, autophagy, human hepatocytes, hypoxia, necrosis, reactive oxygen species
Introduction
Tissue hypoxia is a feature common to many liver diseases including cirrhosis and cancer. It also occurs as a consequence of hemodynamic shock and liver surgery. At the subcellular level hepatocyte hypoxia causes depletion of glycolytic substrates, loss of adenosine triphosphate and intracellular acidosis. Moreover, following liver surgery/transplantation, the restoration of blood flow, although restoring normal oxygen saturation and acid-base balance paradoxically induces and augments hepatocellular injury.1 The key mediator of these events is accumulation of intracellular reactive oxygen species (ROS).2 Furthermore, ROS can regulate both human hepatocyte apoptosis and necrosis during hypoxia and hypoxia-reoxygenation (H-R).2
While hepatocyte apoptosis and necrosis have been shown to occur during hypoxia, the role of hepatocyte autophagy remains controversial. It is now widely recognized that autophagy is required for protein and organelle turnover and is typically a homeostatic cellular response to starvation. Furthermore, autophagy degrades both long-lived cytoplasmic proteins and surplus or dysfunctional organelles by lysosome-dependent mechanisms.3 Nearly all hepatocyte-derived proteins are long-lived and autophagy is thought to be the primary process for hepatic protein catabolism.4 Recent studies suggest that autophagy is another distinct and separate form of cell death that hepatocytes sustain when exposed to oxidative stress but it has been conclusively shown that cells undergoing autophagy are not committed irreversibly to death.5 The role of autophagy in liver disease has been comprehensively presented in recent reviews.6,7
Autophagy is an active process which involves sequestration of parts of the cytoplasm in double-membrane vesicles which then fuse with lysosomes forming the autophagosome. The cytoplasmic material engulfed is then hydrolysed permitting recycling of amino acids and other macromolecular precursors.
In contrast to classical apoptosis, the cellular machinery that regulates autophagy is known to be lysosomal proteinase-dependent and caspase-independent. In particular the Atg proteins and phosphatidylinositol 3-kinase (PtdIns3K) are crucial for autophagosome assembly. The initial step of autophagosome formation requires class III PtdIns3K and BECN1/Atg6 protein.8 The assembly of the autophagosome can be inhibited pharmacologically by 3-methyladenine (3-MA), a specific class III PtdIns3K inhibitor.9,10 The formation and expansion of the autophagosome requires two protein conjugation systems that involve several of members of the Atg protein superfamily,11 namely the Atg8/LC3-PE and Atg12–Atg5 conjugation systems. These conjugation events are regulated and involve Atg3, Atg4, Atg10.12 In particular Atg8 serves as a substrate for the Atg4 family of cysteine proteases.11 Many Atg proteins can be regulated by ROS.11 Once activated Atg8 is able to associate with autophagosomes and remain there until fusion with lysosomes.3,6
Under starvation, cellular generation of ROS is essential for autophagosome formation and autophagic degradation. Because we have observed that hepatocyte ROS generation is enhanced during hypoxia, we wished in the present study, to define and assess the role of hepatocyte autophagy during hypoxia and H-R. We demonstrate for the first time that autophagy is essential for protection of human hepatocytes against oxidative stress and ROS-mediated cell death.
Results
Intracellular ROS accumulation is associated with increased autophagy within human hepatocytes
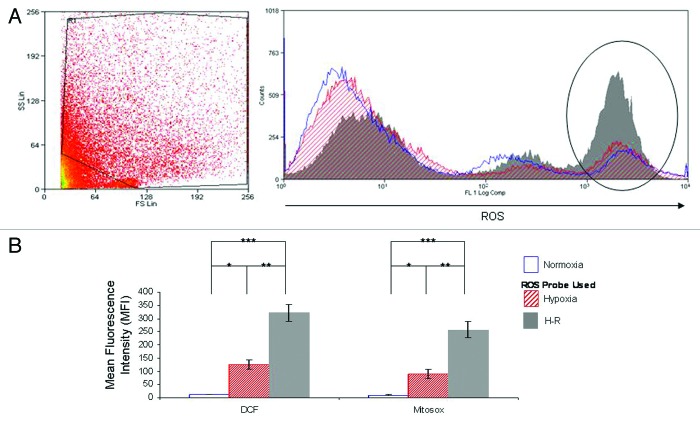
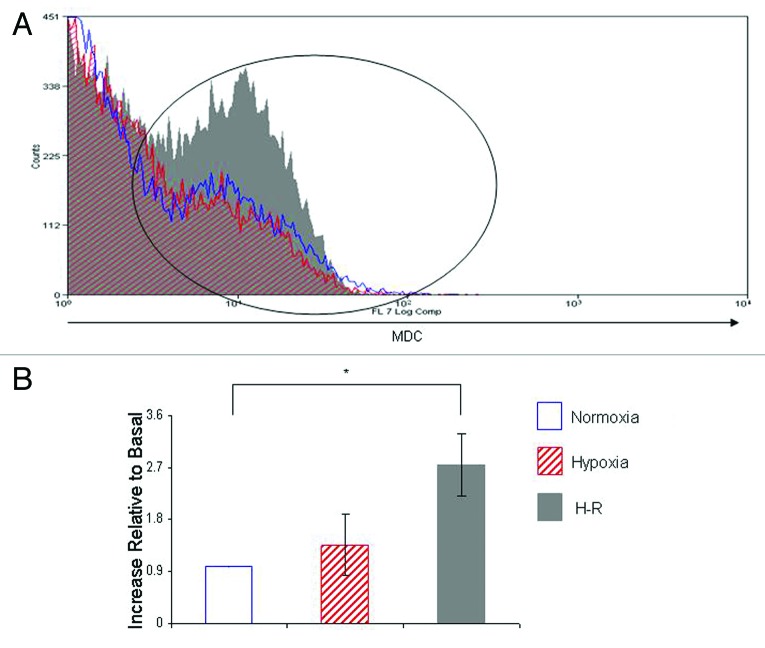
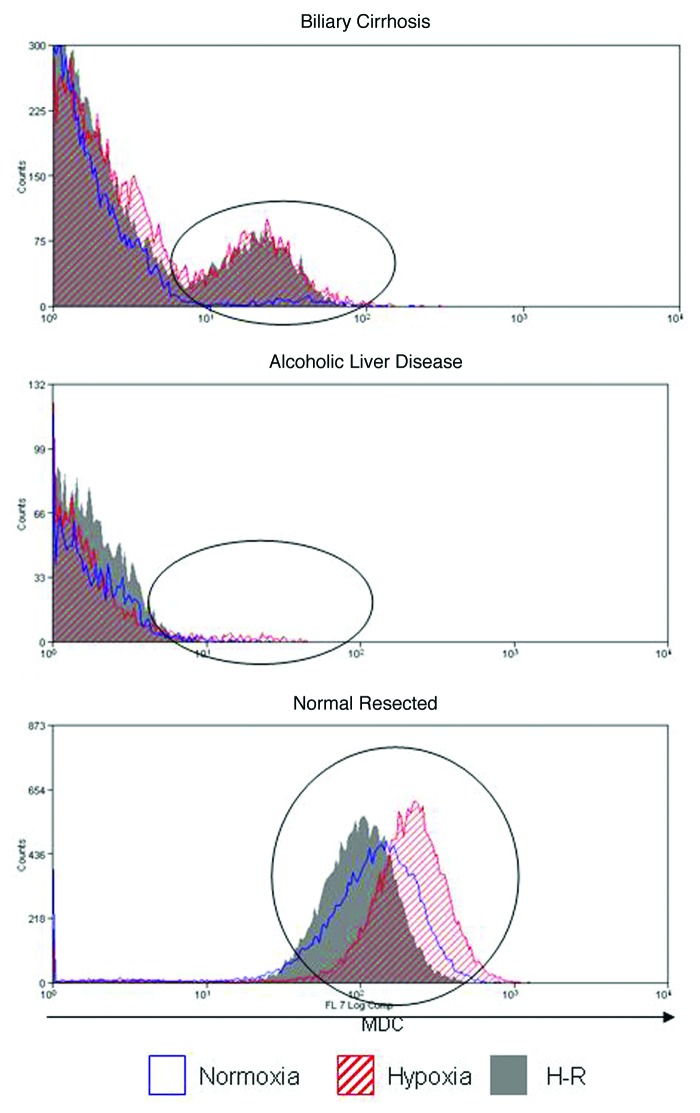
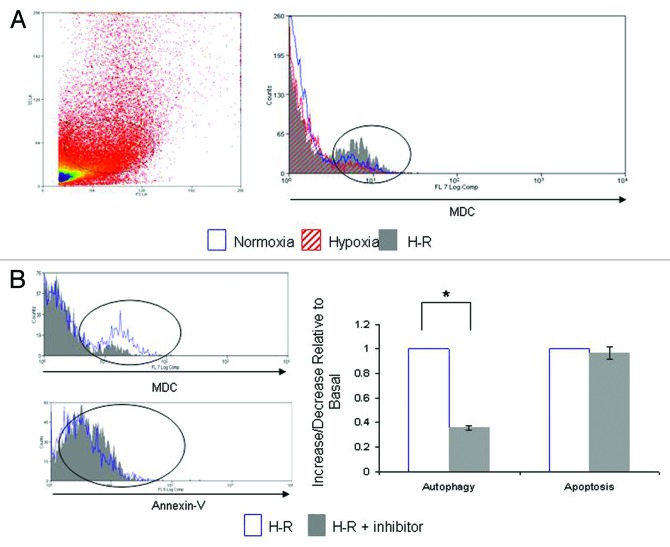
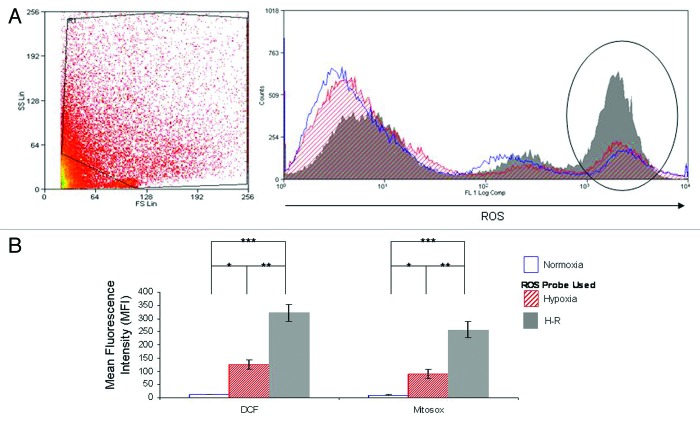
Consistent with our previous studies we show that exposure of human hepatocytes to hypoxia and H-R increased human hepatocyte accumulation of intracellular ROS as detected by DCF (Fig. 1A). These findings were confirmed by the use of the mitochondrial ROS dye Mitosox where we found that hypoxia and H-R also resulted in an increase in mitochondrial ROS production (Fig. 1B). Indeed, mitochondrial ROS production accounts for the vast majority of ROS production in human hepatocytes during hypoxia and H-R. This increase in intracellular ROS accumulation during hypoxia and H-R was also associated with an increase in the number of cells undergoing autophagy as demonstrated by increased staining of human hepatocytes with MDC (Fig. 2). The autophagic response was greater during H-R than hypoxia. Furthermore, human hepatocytes isolated from normal liver tissue and diseased liver tissue show markedly different autophagic responses during hypoxia and H-R (Fig. 3). While human hepatocytes isolated from biliary cirrhosis show a similar autophagic response to those isolated from normal human hepatocytes (Fig. 2) those hepatocytes isolated from alcoholic liver disease (ALD) show very little staining with MDC during hypoxia and H-R indicating the lack of autophagy within these particular hepatocytes. Finally, human hepatocytes from normal resected liver tissue that have been exposed to chemotherapy showed a very different autophagic response to hypoxia and H-R. These hepatocytes had a much higher basal autophagy level that was maintained throughout hypoxia and H-R. For the remainder of the experiments presented in this study we used human hepatocytes isolated from normal benign liver tissue.
Figure 1. Intracellular ROS accumulation in primary human hepatocytes is mitochondrial dependent during hypoxia and H-R. (A) demonstrates representative flow cytometry plots to illustrate the effects of normoxia (blue), hypoxia (hatched red) and H-R (solid gray) upon human hepatocyte ROS production as assessed by DCF staining. A typical FS vs. SS plots of primary human hepatocytes during H-R is shown to the left of the flow cytometric plot. Human hepatocytes are known to vary considerably in size and hence a large gate is required to include all cells in the analysis. Refer to the Methods and Materials section for further details of the gating procedure and protocol. Similar FS vs. SS plots were obtained during normoxia and hypoxia (data not shown). The areas of interest on the flow cytometric plots are marked by vertical ellipses. The area on the left of each ellipse represents cell debris. Cell debris is included within the plot as human hepatocytes vary considerably in size and therefore to include all viable human hepatocytes in the analysis a large gate is required on the flow cytometer, this by necessity includes the cell debris. The representative plot is of normal human hepatocytes that have been isolated from benign liver diseases (n = 7). (B) shows composite bar charts to illustrate the effects of hypoxia and H-R upon ROS production in human hepatocytes isolated from benign liver diseases using DCF and Mitosox. DCF is measure of hydrogen peroxide production in human hepatocytes. Hydrogen peroxide is the main ROS generated within hepatocytes. Mitosox detects ROS generated specifically by the mitochondrion. In these experiments human hepatocytes were isolated from the same liver wedges and then used simultaneously in our in vitro model of hypoxia and H-R to determine DCF and Mitosox staining during normoxia, hypoxia and H-R. Data are expressed as mean fluorescence intensity (MFI) and the values are derived from the gates shown in (A). Human hepatocytes used for these experiments were isolated from benign liver diseases (n = 3–4). (*p < 0.05 relative to normoxia, **p < 0.05 relative to hypoxia, ***p < 0.01 relative to normoxia, Mann-Whitney test).
Figure 2. Intracellular ROS accumulation is associated with increased autophagy during hypoxia and H-R in human hepatocytes. This figure demonstrates a representative flow cytometry plot to illustrate the effect of normoxia (blue), hypoxia (hatched red) and H-R (solid gray) upon autophagy within human hepatocytes isolated from benign liver disease. Again, the areas of interest within the flow cytometry plots are marked by vertical ellipses. The same gate has been applied to primary human hepatocytes for these plots as those shown in Figure 1A. The bar chart shows pooled data of five separate experiments illustrating the effects of hypoxia and H-R upon human hepatocyte autophagy (n = 5). Data are expressed as increase relative to basal, where basal refers to the level of autophagy during normoxia alone. Data are expressed as mean ± SE (*p < 0.05 relative to basal, Mann-Whitney test).
Figure 3. Differential levels of autophagy induction in human hepatocytes isolated from different liver diseases. This figure illustrates the level of autophagy in human hepatocytes isolated from different liver diseases. The FS and SS plots for these hepatocytes are the same as those shown in Figure 1A (n = 3–6).
Mitochondrial and NADPH oxidase mediate autophagy in human hepatocytes during H-R
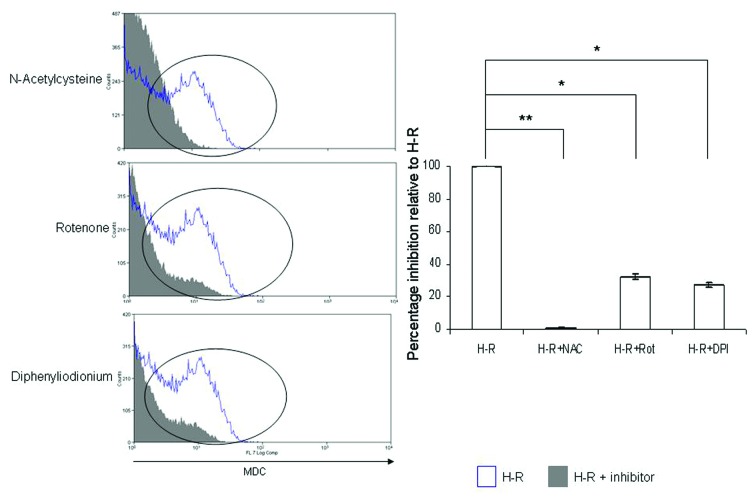
It has been previously shown that ROS are critical regulators of autophagy.11 Accordingly, during H-R, inhibition of ROS production inhibits autophagy in primary human hepatocytes (Fig. 4). Specifically, inhibition of mitochondrial complex I with rotenone and cytoplasmic NADPH oxidase with diphenyliodonium significantly reduced MDC staining of human hepatocytes, as assessed by flow cytometry. Moreover, the general antioxidant N-acetylcysteine, which has the greatest effect upon human hepatocyte ROS production,2 almost completely inhibited autophagy in human hepatocytes. These observations clearly demonstrate the central role of ROS in regulating autophagy in human hepatocytes.
Figure 4. Mitochondrial and NADPH oxidase mediate autophagy in human hepatocytes during H-R. This figure demonstrates representative flow cytometry plots to illustrate the effects of NAC, rotenone and DPI upon human hepatocyte autophagy during H-R. The staining of cells with MDC during H-R is shown in blue and the effects of NAC, rotenone and DPI are shown in solid gray. Similar data were obtained during normoxia and hypoxia (data not shown). Again, the area of interest within the flow cytometry plots is marked by a vertical ellipse. The same gate has been applied to primary human hepatocytes for these plots as those shown in Figure 1A. The bar chart shows pooled data of three separate experiments illustrating the effects of NAC, rotenone, DPI upon human hepatocyte autophagy during H-R. Similar data were obtained during normoxia and hypoxia (data not shown). Data are expressed as percentage inhibition relative to H-R, where the level of autophagy during H-R alone represents 100%. Data are expressed as mean ± SE (*p < 0.05 relative to H-R alone, **p < 0.01 relative to H-R alone, Mann-Whitney test). Human hepatocytes used for these experiments were isolated from benign liver diseases (n = 3–5).
Inhibition of autophagy was associated with a concomitant increase in hepatocyte apoptosis during H-R
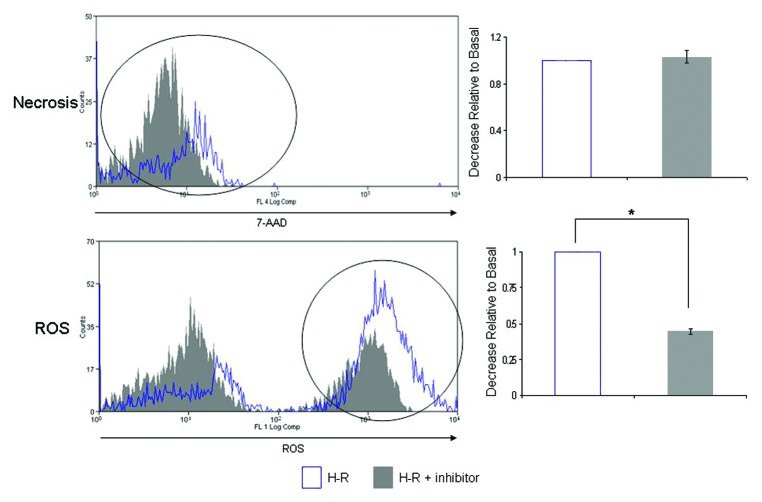
We utilized the specific class III PtdIns3K inhibitor 3-MA to elucidate the role of autophagy in human hepatocytes. 3-MA significantly reduced hepatocyte autophagy during H-R while the number of cells undergoing apoptosis increased (Fig. 5). Similar data was obtained during normoxia and hypoxia (data not shown). No significant change in the number of cells undergoing necrosis was observed during H-R with 3-MA pretreatment (Fig. 6). Similar data was obtained during hypoxia (data not shown). Interestingly inhibition of class III PtdIns3K also decreased ROS accumulation within human hepatocytes during H-R (Fig. 6).
Figure 5. Inhibition of autophagy increases apoptosis in human hepatocytes during H-R. This figure illustrates representative flow cytometry plots to demonstrate the effects of the pre-treatment of primary human hepatocytes with 3-MA and the resultant effects upon apoptosis and autophagy during H-R. The level of apoptosis and autophagy during H-R are shown in blue and the effects of 3-MA pre-treatment are shown in solid gray. The area of interest is marked with a vertical ellipse. The same gate has been applied to primary human hepatocytes for these plots as those shown in Figure 1A. The bar charts to the right of each flow cytometry plot show pooled data from three separate experiments. Data are expressed as increase or decrease relative to basal, where basal refers to the level of ROS production, apoptosis, necrosis or autophagy during H-R. Data are expressed as mean ± SE (*p < 0.05 relative to basal, Mann-Whitney test). Human hepatocytes used for these experiments were isolated from benign liver diseases (n = 3).
Figure 6. Inhibition of autophagy reduces ROS production in human hepatocytes during H-R but does not affect necrosis. This figure illustrates representative flow cytometry plots to demonstrate the effects of the pre-treatment of primary human hepatocytes with 3-MA and the resultant effects upon intracellular ROS production and necrosis during H-R. The level of intracellular ROS production and necrosis during H-R are shown in blue and the effects of 3-MA pre-treatment are shown in solid gray. The area of interest is marked with a vertical ellipse. The same gate has been applied to primary human hepatocytes for these plots as those shown in Figure 1A. The bar charts to the right of each flow cytometry plot show pooled data from three separate experiments. Data are expressed as increase or decrease relative to basal, where basal refers to the level of ROS production, apoptosis, necrosis or autophagy during H-R. Data are expressed as mean ± SE (*p < 0.05 relative to basal, Mann-Whitney test). Human hepatocytes used for these experiments were isolated from benign liver diseases (n = 3).
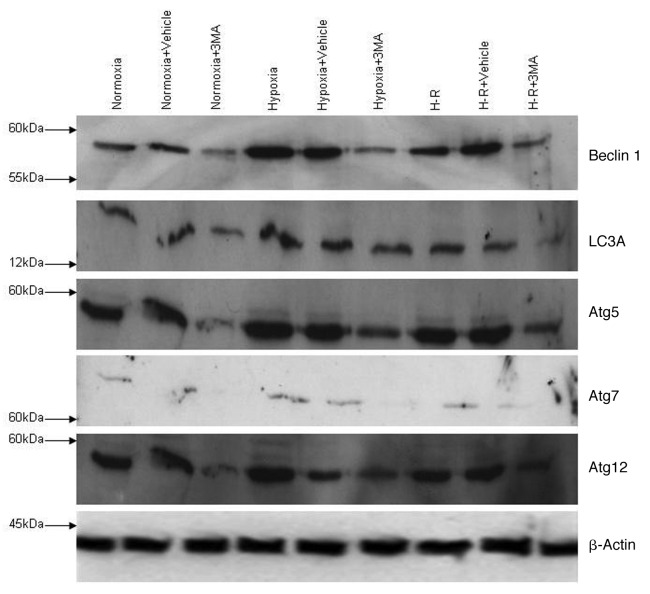
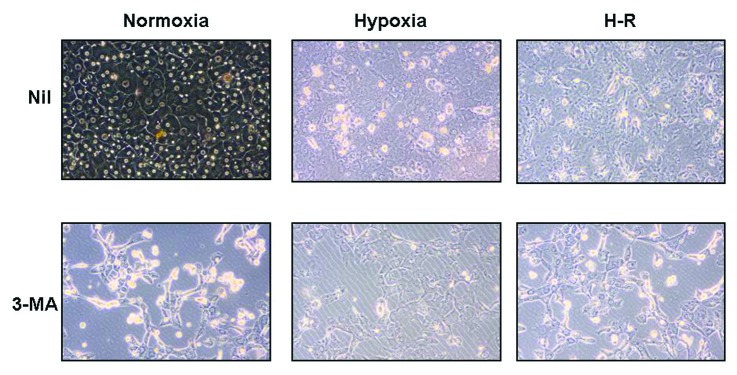
Given that autophagy is regulated by a number of Atg proteins we investigated whether these Atg proteins were modulated by hypoxia and/or H-R. As Figure 7 demonstrates BECN1, an early regulator of autophagy, is induced by hypoxia and H-R. Interestingly, 3-MA reduces BECN1 protein levels during normoxia, hypoxia and H-R. Similarly we found that Atg 5, Atg 7, Atg12 and LC3A were also increased during hypoxia, and H-R and 3-MA pre-treatment of hepatocytes reduced the protein levels of these Atg proteins. Additionally, cells treated with 3-MA during normoxia, hypoxia and H-R showed the characteristic morphological appearance of the cells undergoing apoptosis. Hepatocytes appeared phase bright, small and shrunken (Fig. 8). These observations clearly demonstrate that autophagy promotes survival of human hepatocytes during hypoxia and H-R in vitro.
Figure 7. BECN1, LC3A, Atg 5, Atg 7 and Atg 12 are induced by hypoxia and H-R in human hepatocytes. This figure illustrates the induction of various Atg proteins involved in the regulation of autophagy during hypoxia and H-R. The effects of the PtdIns3K inhibitor 3-MA on Atg protein induction during hypoxia and H-R are also shown. All western blots were performed at least three times and presented blots are representative of all samples (n = 3).
Figure 8. Inhibition of autophagy increases apoptosis in human hepatocytes during H-R. This figure shows representative light microscopy images of primary human hepatocytes during normoxia, hypoxia and H-R in the presence and absence of 3-MA. In normoxia human hepatocytes are typical cuboid morphology with many cells having the characteristic binucleate appearance. During hypoxia and H-R, cells lose this appearance and many cells appear small shrunken in the confluent monolayer of cells, indicative of apoptotic bodies. Following 3-MA pretreatment in either normoxia, hypoxia or H-R many more cells appear phase bright, small and shrunken. In addition there is disruption to the monolayer of hepatocytes. These light microscopy images have been taken after 24 h incubation in hypoxia and H-R with and without the presence of 3-MA. (Magnification x20).
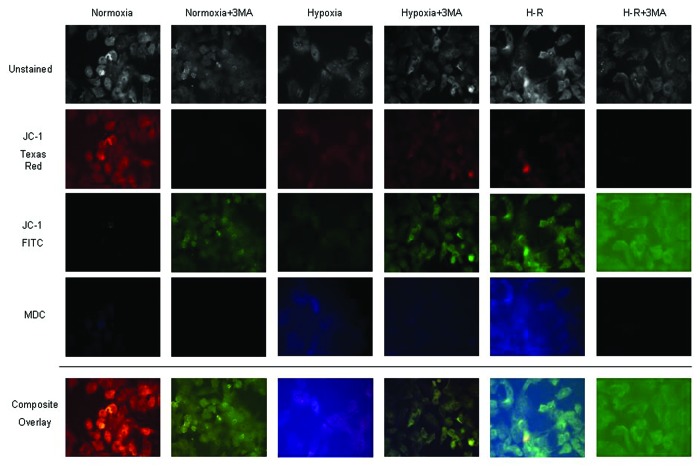
Much recent work has focused upon the role of mitochondrial autophagy or mitophagy during oxidative stress.13-15 Indeed the mitochondrion is an important ROS generator during IRI and is known to regulate human hepatocyte apoptosis and necrosis.2 Accordingly, we used the specific mitochondrial dye JC-1 as a measure of the mitochondrial membrane potential within hepatocytes during hypoxia and H-R. Red fluorescence represents normal mitochondrial membrane potential whereas green fluorescence represents low mitochondrial potential. In addition, human hepatocytes were co-stained with MDC. As Figure 9 shows, during normoxia human hepatocytes have normal mitochondrial membrane potential with no staining for MDC. Interestingly, incubation of cells with 3-MA markedly increased the green fluorescence of human hepatocytes indicating a lowering of mitochondrial potential and is indicative of cell death. Furthermore, hypoxia and H-R lower mitochondrial membrane potential further with a concomitant increase in MDC staining. Moreover, pre-treatment of cells with 3-MA during hypoxia and H-R, while reducing MDC staining markedly lowered mitochondrial membrane potential and increased cell death. Finally, MDC and green JC-1 staining were observed to colocalize in these samples indicating that autophagy was occurring in the mitochondrion.
Figure 9. Autophagy is primarily performed in mitochondrion in human hepatocytes during hypoxia and H-R. This figure demonstrates the effects of hypoxia and H-R upon human hepatocyte mitochondrial membrane potential and MDC staining. Mitochondrial membrane potential was determined using the specific dye JC-1. When mitochondrial membrane potential is normal JC-1 appears red but once membrane potential is lowered or lost the dye become green. MDC staining is detected within the DAPI channel and appears blue. Composite overlay images are shown at the bottom of the figure. Additionally unstained images are provided with stained images to highlight the cellular location of immunofluorescence. In normoxia, as expected there was a normal mitochondrial membrane potential and no autophagy noted. During hypoxia and H-R there was a progressive loss of red JC-1 staining and an increase in green JC-1 staining indicating loss of mitochondrial potential and onset of cell death. In addition there was an increase in MDC staining in human hepatocytes during hypoxia and H-R. Moreover, MDC staining and green JC-1 staining co-localized in human hepatocytes during hypoxia and H-R.
Large peri-venular human hepatocytes preferentially undergo autophagy during H-R
Our group has recently reported that human hepatocytes located within the peri-venular (PV) region of the liver, which tend to be larger in size than their peri-portal (PP) counterparts, are the targets of hypoxic injury.16 Here we demonstrate that large/PV hepatocytes (Fig. 10) increase autophagy significantly more than PP/small human hepatocytes during H-R (Fig. 11). As expected, these increased levels of autophagy are sensitive to 3-MA pre-treatment. However, inhibition of autophagy in large/PV human hepatocyte significantly increased apoptosis during H-R (Fig. 4A).
Figure 10. Autophagic response in large human hepatocytes during hypoxia and H-R. The top panel demonstrates a representative flow cytometry plot to illustrate the levels of MDC staining of PV/large human hepatocytes during normoxia (blue), hypoxia (hatched red) and H-R (solid gray). The plot on the left hand side of the flow cytometric plot represents a typical FS vs. SS plot, similar to that shown in Figure 1A. The FS vs. SS plot is from a H-R sample but similar plots were obtained during normoxia and hypoxia (data not shown). The gating protocol applied to human hepatocytes to analyze PV/large human hepatocytes is shown on the FS vs. SS plot. The area of interest of each flow cytometry plot is marked by a vertical ellipse. The bottom panel illustrates the effects of 3-MA pre-treatment upon PV/large human hepatocyte autophagy and apoptosis during H-R. The effects of H-R alone are shown in blue and the effects of 3-MA pretreatment are shown in solid gray. The bar chart shows composite data from four separate experiments. Data are expressed as mean ± SE (*p < 0.05 relative to basal, Mann-Whitney test).
Figure 11. Autophagic response in small human hepatocytes during hypoxia and H-R. This figure demonstrates a representative flow cytometry plot to illustrate the levels of MDC staining of PP/small human hepatocytes during normoxia (blue), hypoxia (hatched red) and H-R (solid gray). The FS vs. SS plot is from a H-R sample but similar plots were obtained during normoxia and hypoxia (data not shown). The gating protocol applied to human hepatocytes to analyze PP/small human hepatocytes is shown on the FS vs. SS plot. The areas of interest on the flow cytometric plots are marked by vertical ellipses. The bottom panel illustrates the effects of 3-MA pre-treatment upon PP/small human hepatocyte autophagy and apoptosis during H-R. The effects of H-R alone are shown in blue and the effects of 3-MA pretreatment are shown in solid gray. The bar chart shows composite data from four separate experiments. Data are expressed as mean ± SE (*p < 0.05 relative to basal, Mann-Whitney test).
Discussion
While autophagy is an important mechanism by which the cell rids itself of potentially harmful constituents and helps maintain normal cellular functioning and homeostasis, its precise role during liver injury and disease where hepatocytes are involved remains uncertain. A consensus is now emerging that autophagy does not precede cell death but may be a physiologically protective mechanism which favors cell survival.17 The diverse role of autophagy in liver diseases has been recently reviewed.6,18,19 Certainly in liver IRI autophagy mainly has a prosurvival activity allowing the cell to cope with hypoxia. However autophagy is also known to regulate hepatic steatosis and hepatitis virus replication.18 To our knowledge this is the first study to conclusively demonstrate autophagy in isolated primary human cells under conditions of hypoxic stress. This has potential implications for our understanding of the hepatocyte response to liver injury and development of chronic liver disease.
Previous tissue-based studies have shown autophagic hepatocytes within allografts are increased following liver transplantation. However these studies failed to show a causal link between oxidative stress, induction of cell death and autophagy.5 Instead it was suggested that dying hepatocytes also increased autophagy. However whether inhibition of autophagy promoted cell death or survival was not demonstrated. Recent studies have shown that the severity and duration of an ischemic insult determine whether autophagy is induced or not. Indeed these studies have shown that autophagy can delay the decision for a cell to die via apoptosis or necrosis.20 We clearly show, using our novel four-color reporter assay, that hepatocytes subjected to oxidative stress demonstrated features consistent with increased ROS generation, autophagy and apoptosis. However, crucially we show that inhibition of early autophagy with the class PtdIns3K inhibitor, 3-MA, induces increased levels apoptosis during H-R. For our presented study we used 3-MA only and not siRNA knockdown or transfection of human hepatocytes as these are notoriously difficult and inefficient techniques.21-23 Importantly, inhibiting autophagy causes the lowering of mitochondrial membrane potential and leads to cell death. Previous authors have also reported that autophagy is responsible for maintaining mitochondrial potential.19 Importantly, in the present study we have shown that human hepatocytes isolated from normal and diseased liver tissues have different autophagy responses during hypoxia and H-R. Specifically, human hepatocytes isolated from normal resected tissue, where livers would have been treated with chemotherapy, showed MDC staining that was consistent throughout hypoxia and H-R. Coupled with the findings of our previous study2 it can be seen that these hepatocytes are also resistant to cell death during hypoxia and H-R. Indeed, the reduction in cell death maybe in part due to the induction of autophagy. This is consistent with previous work performed in human livers.24 Moreover human hepatocytes isolated from ALD livers showed no autophagy response during hypoxia and H-R possibly reflecting the extent of damage to these livers. Human hepatocytes isolated from biliary cirrhosis and normal benign liver showed similar autophagy responses in an analogous manner to the accumulation of ROS within these cells.2 These observations show that the varying levels of intracellular ROS within human hepatocytes isolated from different liver diseases correlates positively with intracellular MDC staining and hence autophagy. This finding also suggests that autophagy is differential induced in different liver diseases and may have important implications for disease pathogenesis.
During hypoxic stress, autophagy appears to occur within the mitochondrion and our data shows that this process is likely to be mediated by BECN1, LC3A, Atg 5, Atg 7 and Atg 12. Our findings corroborate those in HeLa cells where inhibition of autophagy also led to an increase in apoptosis.25 We illustrate, for the first time, that the induction of autophagy within human hepatocytes during oxidative stress is essential for cell survival. Previous work by Kohli et al. in hepatocytes has shown that ROS production lies upstream of PtdIns3K activation.26 Indeed, inhibition of PtdIns3K with 3-MA did not lead to an increase in BECN1, LC3A, Atg 5, Atg7 and Atg 12 protein levels which were otherwise seen during hypoxia and H-R. Coupled together these findings suggest that ROS activates PtdIns3K which subsequently activates the remaining autophagy machinery (Fig. 12). As stated above in hepatocytes autophagy targets mitochondria for degradation, a process known as mitophagy. The finding that the mitochondrion is the main ROS generator within human hepatocytes would also fit with this observation particularly in light of our previous findings that ROS can regulate autophagy, apoptosis and necrosis. Inhibiting ROS inhibits all three cellular processes, but selective inhibiting autophagy promotes apoptosis.
Figure 12. The proposed regulation of autophagy in human hepatocytes during hypoxia and H-R. Hypoxia and H-R leads to the generation of ROS in human hepatocytes predominantly in a mitochondrial dependent manner. As our previous work has demonstrated this increased ROS during hypoxia and H-R can lead to both apoptosis and necrosis2 (black arrows). However, the increased ROS can also activate autophagy which can be inhibited by the ROS inhibitors NAC, rotenone or DPI leading to reduced levels of apoptosis, necrosis and autophagy. As Kohli et al. have demonstrated in hepatocytes, ROS can activate PI3-K34, the essential first step in the assembly of the autophagosome. Once activated a number of Atg proteins including BECN1, LC3A, Atg5, Atg7 and Atg12 are involved in maturation of the autophagosome. It appears that the autophagy process predominantly removes dysfunctional mitochondria in human hepatocytes during hypoxia and H-R which in turns aids cell survival (green arrows). Inhibiting PtdIns3K with 3-MA ensures that the autophagosome does not develop and that Atg proteins are not induced in human hepatocytes during hypoxia and H-R (red arrows). Consequently, human hepatocytes are not able to carry out autophagy and thus mitochondria lose their membrane potential and are committed to cell death in the form of apoptosis.
Furthermore, we demonstrate that the PV/large human hepatocytes increased levels of autophagy much more than PP/small human hepatocytes in line with their greater susceptibility to hypoxic injury. Moreover, inhibition of autophagy in PV/large human hepatocytes increased apoptosis during H-R, clearly demonstrating the link between autophagy and cell survival.
Central regulators of autophagy are the evolutionarily conserved Atg genes and recent studies have shown that some Atg proteins can be regulated by ROS.11 BECN1, an essential regulator of early autophagy was induced by hypoxia and H-R and efficiently inhibited by 3-MA. Recent reviews have detailed the essential role of BECN1 in IRI27 as well as its central role in mediating autophagy during oxidative stress.28 Moreover, under stress hepatocytes utilize the LC3 protein to induce mitophagy within the dysfunctional mitochondrion.29 This latter observation is probably the role of increased LC3 seen in our in vitro model. In an experimental rat model, short-term anoxia increases the expression of Atg7 in hepatocytes and protects against anoxia-reoxygenation mediated apoptosis and necrosis.1 We also found an induction of Atg 7 during our model of IRI. Furthermore, we found induction of Atg5 and Atg 12. These two Atg proteins are involved in the latter processes of autophagy. Recent studies have shown the integral role Atg 5 in regulating menadione-induced oxidative stress.30 In this study knockdown of Atg 5 in the rat hepatocyte line RALA255-10G sensitized cells to both apoptotic and necrotic cell death. In addition Atg 12, along with other Atg proteins, is required for the protection of anoxic rat hepatocytes from cell death.31
While our study does not conclusively show which signaling pathways are activated by ROS in human hepatocytes to induce autophagy, it does clearly demonstrate that ROS is a key mediator of autophagy during oxidative stress. Furthermore in accordance with our study, previous authors have shown that the general anti-oxidants, catalase and N-acetylcysteine reduce autophagy.11 We now show that mitochondrial and NADPH oxidase derived ROS are critical for the induction of autophagy in human hepatocytes. In addition previous studies have shown that H-R induces increased manganese superoxide dismutase expression in hepatocytes.32 Taken together these studies show that ROS derived from many sources within hepatocytes can regulate autophagy. Moreover this generated ROS has prosurvival effects in activating autophagy but also signals to cell death in the form of apoptosis and necrosis (Fig. 12). The increase in antioxidant defenses within hepatocytes is likely to protect from cell death and the inhibition of autophagy may not be detrimental as autophagy can be regulated by other system besides ROS.33 These observations provide interesting insights to the function of ROS in determining human hepatocyte fate.2 Taken together, these observations clearly point to ROS regulating diverse and different signaling pathways within human hepatocytes during oxidative stress. These pathways appear to regulate both cell death and cell survival. It is likely that either the absolute level of intracellular ROS, the type of ROS sub-species generated or duration of ROS generation may be the critical factors in determining cell fate. The precise mechanistic pathways remain to be elucidated but may ultimately provide insights which inform the development of therapeutic strategies aimed at limiting the cellular damage and loss associated with liver injury. Previous authors have reported that inhibiting autophagy within rat hepatocytes leads to necrosis.34 Moreover, in a model of ischemic preconditioning Esposti et al. reported that autophagy may switch necrosis and/or apoptosis on and off by modulating intracellular signaling.35 We did not find this and it is likely that this represents species-specific effects of autophagy as no previous studies have evaluated autophagy in human hepatocytes. It may also represent a difference between the induction of autophagy in the in vitro and in vivo setting.
Our study demonstrates that ROS production decreased within human hepatocytes after 3-MA pre-treatment during H-R. One would expect that in hepatocytes in which autophagy was inhibited damaged mitochondria would continue to form ROS and induce cell death. However, the particular model utilized in our experiments examines cell death and ROS production at 24 h of hypoxia and/or H-R. The significant levels of apoptosis seen after 3-MA pretreatment during H-R suggests that a significant number of hepatocytes were already dead, hence intracellular ROS had reduced. Importantly, our study showed no significant effect of vehicle controls on human hepatocyte ROS production during H-R.
We provide evidence that within human hepatocytes, autophagy is a cell-survival mechanism during periods of oxidative stress. Moreover, taken together with previous studies, we show that the PV/large human hepatocytes increase autophagy significantly more in H-R relative to PP/small human hepatocytes. This is in accordance with our previous observations that the PV/large peri-venular human hepatocytes are more susceptible to oxidative stress. These observations suggest that the pharmacological activation of P13-K or other autophagy machinery, particularly within PV/large human hepatocytes may prove effective strategies in ameliorating human hepatocyte cell death in chronic liver disease as well as following liver transplantation.
Materials and Methods
Human hepatocyte isolation
Liver tissue was obtained via the Hepatobiliary and Transplant surgery program at the Queen Elizabeth Hospital Birmingham UK, from fully consenting patients undergoing transplantation, hepatic resection for liver metastasis, hepatic resection for benign liver disease or normal donor tissue surplus to surgical requirements. Ethical approval for the study was grant by the Local Research Ethics Committee (LREC) (reference number 06/Q702/61). Human hepatocytes were isolated using the method that we have described previously.36 Normal benign livers were classified as livers where resection was performed for recurrent cholangitis, haemangioma and focal nodular hyperplasia. Biliary cirrhosis livers included livers with both primary biliary cirrhosis and primary sclerosing cholangitis. Normal resected liver tissue was tissue taken from surgical resections performed for metastatic disease. Tissue was taken well away from the tumor site and all such patients had received pre-operative chemotherapy.
Model of hypoxia and H-R
In experiments, human hepatocytes were grown for 2 d at 37°C, 5% CO2 in Williams E media (Sigma-Aldrich, W4125) on rat type 1 collagen-coated plates. Hepatocytes were either maintained in normoxia or placed into hypoxia for 24 h, or placed into hypoxia for 24 h followed by 24 h of reoxygenation. Hypoxia was achieved by placing cells in an airtight incubator (RS Mini Galaxy A incubator, Wolf Laboratories) flushed with 5% CO2 and 95% N2 until oxygen content in the chamber reached 0.1%, as verified by a dissolved oxygen monitor (DOH-247-KIT, Omega Engineering, UK). In preliminary experiments, human hepatocytes were exposed to 5% and 1% oxygen and no increase in ROS accumulation or cell death was noted. Therefore, we used 0.1% oxygen in all subsequent experiments. Additionally, Williams E media was pre-incubated in the hypoxic chamber in a sterile container, which allowed gas equilibration, for 8 h before experiments were performed, resulting in a final oxygen concentration of < 0.1% as measured with the dissolved oxygen meter. Where appropriate, after 24 h of hypoxia media was aspirated and replaced with fresh, warmed, oxygenated medium, and the cells were returned to normoxic conditions. This was defined as the beginning of reoxygenation. In experiments involving ROS inhibitors/antioxidants all reagents were made fresh as stock solutions and added using the correct dilution factor to the relevant experimental wells. Specifically, N-acteylcysteine (Sigma-Aldrich, A9165) was dissolved in molecular grade water (Sigma-Aldrich, W4502) to a concentration of 100 mM, rotenone (Sigma-Aldrich, R8875) was dissolved in chloroform (Sigma-Aldrich, C2432) to a concentration of 1 mM and diphenyliodonium (Sigma-Aldrich, 43088) was dissolved in dimethyl sulfoxide (DMSO) (Sigma-Aldrich, D2650) to give a stock concentration of 1 mM, and these stocks were diluted appropriately to give working concentrations of 20 mM, 2 μM and 10 μM respectively. In experiments using ROS inhibitors/antioxidants, solvent alone controls were used to ensure no vehicle effects. In addition, in experiments using ROS inhibitors/antioxidants agents were added 4 h before the placement of the cells into hypoxia or into reoxygenation.
In experiments involving the use of 3-MA (Merck, Nottingham, 189490), stock solutions were made and added to the correct final dilution factor in the relevant tissue culture wells. 3-MA is a specific class III PtdIns3K inhibitor and specifically inhibits the early phases of autophagy. Specifically, 2 mg 3-MA was dissolved in molecular grade DMSO (Sigma-Aldrich) and were diluted appropriately to give working concentrations of 5 mM. In experiments using 3-MA, solvent alone wells were included as vehicle only controls. Hepatocytes were pre-treated with 3-MA for up to 4 h before placement of the cells into normoxia and hypoxia. For H-R experiments fresh 3-MA was added at the time of placement into reoxygenation.
Determination of human hepatocytes ROS accumulation, apoptosis, necrosis and autophagy
ROS production, apoptosis, necrosis and autophagy were determined by using a four-color reporter assay system. ROS accumulation was determined using the fluorescent probe 2′,7′-dichlorofluorescin-diacetate (Merck, 287810).37 This probe is cell permeable and once inside the cell is cleaved by intracellular esterases to 2′,7′-dichlorofluorescin (DCF) and becomes cell impermeable. DCF is then able to react with intracellular ROS, specifically hydrogen peroxide, to give a fluorescent signal detectable on the FITC channel. The signal is directly proportional to the level of intracellular ROS present.
MitoSox Red is a mitochondrial superoxide indicator dye (Molecular Probes, Invitrogen, M36008) and was used as an alternative means to determine ROS in the mitochondria. Cells were treated as described above in the in vitro model and then loaded with 5 μM MitoSox Red in Hank’s Balanced Salt Solution (HBSS) (Gibco, 14180046) for 30 min at 37°C in the dark. Cells were washed as described below. MitoSox Red fluorescent intensity was determined by fluorescence with excitation at 510 nm and emission at 580 nm.
Apoptosis was determined by labeling cells with Annexin-V (Molecular Probes, Invitrogen, A35122) which detects exposed phosphatidylserine on the cell membrane. 7-Amino-Actinomycin D (7-AAD) (Molecular Probes, Invitrogen, A1310) is a vital dye that binds to DNA, only entering cells once the cell membrane is disrupted and is indicative of cellular necrosis. Autophagy formation was determined by using the fluorescent dye monodansylcadaverine (MDC) (Sigma-Aldrich, 30432). This dye selectively labels autophagic vacuoles38 and has been previously used in hepatoma cell lines39 and primary hepatocytes40 to detect autophagy. Following treatment, cell media was aspirated and replaced with HBSS without calcium and magnesium. DCF (30 μM) and MDC (1 µM) was added and the cells were incubated for 20 min in the dark at 37°C. The cells were then trypsinized and washed extensively in FACs buffer (phosphate-buffered saline pH 7.2 with 10% v/v heat inactivated fetal calf serum (Gibco) Sigma-Aldrich, F6178). Cells were then labeled with Annexin-V (0.25 µg/ml) and 7-AAD (1 µg/ml) for 15 min while on ice and then samples were immediately subjected to flow cytometry. At least 20,000 events were recorded within the gated region of the flow cytometer for each human hepatocyte cell preparation in each experimental condition. Only the cells within the gated region were used to calculate Mean Fluorescence Intensity (MFI).
To ensure consistency of the flow cytometric data, each human hepatocyte preparation was labeled with DCF alone, Annexin-V alone, 7-AAD alone and MDC alone to ensure that cells had become labeled and that the flow cytometry data could be compensated for crossover of fluorophore emission spectra. The same flow cytometry protocol was used for all experiments shown within the study, i.e. voltages for all markers were constant for all human hepatocyte preparation ensuring inter- and intra-experimental consistency. Specifically, for each experiment a cell-only sample was used to ensure that there was no staining of primary human hepatocytes with each specific dye/probe. This sample was also used to ensure that the MFI reading was placed in the first decade for each dye/probe. Also these cells were used to place a flow cytometric gate for subsequent samples. Human hepatocytes vary considerable in size depending upon whether they are derived from the peri-venular region of the liver or peri-portal region of the liver. Therefore forward scatter (FS) and side scatter (SS) as shown in Figure 1A demonstrate a heterogeneous cell population. A gate was therefore placed in FS vs. SS that included all cells. Clearly, the sample includes cell debris that by necessity is included within the large gate applied in the analysis. Also, the gate will include small hepatocytes and hepatocytes that attain lower intensity of staining with probes/dyes and do not respond to hypoxia and H-R in the same way as the highly stained species. Therefore, peaks seen adjacent to the vertical ellipses of interest represent cell debris and hepatocytes that have different responses to hypoxia and H-R.
Western blotting
For western immunoblotting studies, human hepatocytes were lysed at the end of the relevant experimental period using NP-40 lysis buffer (20 mM TRIS-HCl pH 8 (Sigma-Aldrich, T3253), 137 mM NaCl (Sigma-Aldrich, S3014), 10% glycerol (Sigma-Aldrich, G5516), 1% Nonidet P40 (Sigma-Aldrich, 18896), 2 mM EDTA (Sigma-Aldrich, E6758). Protein concentration was determined by Bradford protein assay and 25 μg of protein was resolved on a 10% SDS-PAGE gel and transferred to a nitrocellulose membrane (Hybond; Amersham Biosciences, RPN3032D). The blotted membrane was blocked for 1 h at room temperature in Tris-buffered saline (TBS) pH 7.4/Tween 0.1% (Sigma-Aldrich, P9416) containing 5% (wt/vol) bovine serum albumin (BSA) (Sigma-Aldrich, A9418). All primary antibody incubations were performed at overnight at 4°C in TBS-Tween 0.1% containing 5% BSA (wt/vol). The incubation steps were followed by three washing steps of 5 min with TBS containing 0.1% Tween. All primary antibodies were purchased from New England Biolabs and used at a dilution of 1:1000 as per manufacturer’s instructions. Specific primary antibodies used included: (1) BECN1 (3495), (2) LC3A (4599), (3) Atg5 (8540), (4) Atg12 (4180) and (5) Atg7 (2631).
Binding of specific mAb was detected with a horseradish peroxidase-conjugated anti-rabbit IgG at a dilution of 1:2000 for 1 h (Sigma-Aldrich, A8792) Protein bands were visualized using the enhanced chemiluminescence detection system (Amersham Biosciences, RPN2109) followed by exposure of the membranes to Hyperfilm-ECL (Amersham Biosciences, 28-9068-37). Equality of protein loading on were checked by immunoblotting for β-actin (Sigma-Aldrich, A2228) (dilution 1:20000). All Western immunoblots were performed at least three times from different liver preparations for each liver cell type.
Assessment of mitochondrial membrane potential and labeling of autophagic vacuoles with MDC
To measure the mitochondrial membrane potential (ΔΨm), 5,5′,6,6′-tetrachloro-1,1′,3,3′-tetraethylbenzimidazolylcarbocyanine iodide (JC-1) (Molecular Probes, Invitrogen, M34152), a sensitive fluorescent probe for ΔΨm was used.41 Human hepatocytes were used in in vitro experiments as described above. At the end of the specific experimental procedure, cells were then rinsed with PBS twice and then stained with 5 μM JC-1 and/or 1 µM MDC for 30 min at 37°C. Cells were rinsed with ice-cold PBS twice, resuspended in 1 mL ice-cooled PBS, and immediately analyzed with a fluorescence microscope (Nikon Eclipse TE 300). A 488 nm filter was used for the excitation of JC-1. Emission filters of 535 nm and 595 nm were used to quantify the population of mitochondria with green (JC-1 monomers) and red (JC-1 aggregates) fluorescence, respectively.42
MDC staining was assessed with a filter system (V-2A excitation filter: 380/420 nm, barrier filter: 450 nm).43 Images were captured with a CCD camera and imported into Adobe Photoshop.
Statistical analysis
All data are expressed as mean ± SE. Statistical comparisons between groups were analyzed by Mann-Whitney test. All differences were considered statistically significant at a value of p < 0.05.
Acknowledgments
R.H.B. is in receipt of Wellcome Trust Training Fellowship (DDDP.RCH1X1483). The authors would also like to thank the NIHR and BRU for their continued support of research. The authors are also grateful to the clinical team at the Queen Elizabeth Hospital, Birmingham for the procurement of liver tissue.
Disclosure of Potential Conflicts of Interest
No potential conflicts of interest were disclosed.
Footnotes
Previously published online: www.landesbioscience.com/journals/autophagy/article/19012
References
- 1.Kim JS, He L, Qian T, Lemasters JJ. Role of the mitochondrial permeability transition in apoptotic and necrotic death after ischemia/reperfusion injury to hepatocytes. Curr Mol Med. 2003;3:527–35. doi: 10.2174/1566524033479564. [DOI] [PubMed] [Google Scholar]
- 2.Bhogal RH, Curbishley SM, Weston CJ, Adams DH, Afford SC. Reactive oxygen species mediate human hepatocyte injury during hypoxia/reoxygenation. Liver Transpl. 2010;16:1303–13. doi: 10.1002/lt.22157. [DOI] [PubMed] [Google Scholar]
- 3.Yorimitsu T, Klionsky DJ. Autophagy: molecular machinery for self-eating. Cell Death Differ. 2005;12(Suppl 2):1542–52. doi: 10.1038/sj.cdd.4401765. [DOI] [PMC free article] [PubMed] [Google Scholar]
- 4.Mortimore GE, Pösö AR, Lardeux BR. Mechanism and regulation of protein degradation in liver. Diabetes Metab Rev. 1989;5:49–70. doi: 10.1002/dmr.5610050105. [DOI] [PubMed] [Google Scholar]
- 5.Lu Z, Dono K, Gotoh K, Shibata M, Koike M, Marubashi S, et al. Participation of autophagy in the degeneration process of rat hepatocytes after transplantation following prolonged cold preservation. Arch Histol Cytol. 2005;68:71–80. doi: 10.1679/aohc.68.71. [DOI] [PubMed] [Google Scholar]
- 6.Czaja MJ. Functions of autophagy in hepatic and pancreatic physiology and disease. Gastroenterology. 2011;140:1895–908. doi: 10.1053/j.gastro.2011.04.038. [DOI] [PMC free article] [PubMed] [Google Scholar]
- 7.Rautou PE, Mansouri A, Lebrec D, Durand F, Valla D, Moreau R. Autophagy in liver diseases. J Hepatol. 2010;53:1123–34. doi: 10.1016/j.jhep.2010.07.006. [DOI] [PubMed] [Google Scholar]
- 8.Bursch W, Ellinger A, Kienzl H, Török L, Pandey S, Sikorska M, et al. Active cell death induced by the anti-estrogens tamoxifen and ICI 164 384 in human mammary carcinoma cells (MCF-7) in culture: the role of autophagy. Carcinogenesis. 1996;17:1595–607. doi: 10.1093/carcin/17.8.1595. [DOI] [PubMed] [Google Scholar]
- 9.Ohsumi Y, Mizushima N. Two ubiquitin-like conjugation systems essential for autophagy. Semin Cell Dev Biol. 2004;15:231–6. doi: 10.1016/j.semcdb.2003.12.004. [DOI] [PubMed] [Google Scholar]
- 10.Ichimura Y, Kirisako T, Takao T, Satomi Y, Shimonishi Y, Ishihara N, et al. A ubiquitin-like system mediates protein lipidation. Nature. 2000;408:488–92. doi: 10.1038/35044114. [DOI] [PubMed] [Google Scholar]
- 11.Scherz-Shouval R, Sagiv Y, Shorer H, Elazar Z. The COOH terminus of GATE-16, an intra-Golgi transport modulator, is cleaved by the human cysteine protease HsApg4A. J Biol Chem. 2003;278:14053–8. doi: 10.1074/jbc.M212108200. [DOI] [PubMed] [Google Scholar]
- 12.Kabeya Y, Mizushima N, Yamamoto A, Oshitani-Okamoto S, Ohsumi Y, Yoshimori T. LC3, GABARAP and GATE16 localize to autophagosomal membrane depending on form-II formation. J Cell Sci. 2004;117:2805–12. doi: 10.1242/jcs.01131. [DOI] [PubMed] [Google Scholar]
- 13.Youle RJ, Narendra DP. Mechanisms of mitophagy. Nat Rev Mol Cell Biol. 2011;12:9–14. doi: 10.1038/nrm3028. [DOI] [PMC free article] [PubMed] [Google Scholar]
- 14.Scherz-Shouval R, Elazar Z. Regulation of autophagy by ROS: physiology and pathology. Trends Biochem Sci. 2011;36:30–8. doi: 10.1016/j.tibs.2010.07.007. [DOI] [PubMed] [Google Scholar]
- 15.Mijaljica D, Prescott M, Devenish RJ. Mitophagy and mitoptosis in disease processes. Methods Mol Biol. 2010;648:93–106. doi: 10.1007/978-1-60761-756-3_6. [DOI] [PubMed] [Google Scholar]
- 16.Bhogal RH, Weston CJ, Curbishley SM, Bhatt AN, Adams DH, Afford SC. Variable responses of small and large human hepatocytes to hypoxia and hypoxia/reoxygenation (H-R) FEBS Lett. 2011;585:935–41. doi: 10.1016/j.febslet.2011.02.030. [DOI] [PMC free article] [PubMed] [Google Scholar]
- 17.Levine B, Kroemer G. Autophagy in aging, disease and death: the true identity of a cell death impostor. Cell Death Differ. 2009;16:1–2. doi: 10.1038/cdd.2008.139. [DOI] [PMC free article] [PubMed] [Google Scholar]
- 18.Huett A, Goel G, Xavier RJ. A systems biology viewpoint on autophagy in health and disease. Curr Opin Gastroenterol. 2010;26:302–9. doi: 10.1097/MOG.0b013e32833ae2ed. [DOI] [PubMed] [Google Scholar]
- 19.Yin XM, Ding WX, Gao W. Autophagy in the liver. Hepatology. 2008;47:1773–85. doi: 10.1002/hep.22146. [DOI] [PubMed] [Google Scholar]
- 20.Loos B, Genade S, Ellis B, Lochner A, Engelbrecht AM. At the core of survival: autophagy delays the onset of both apoptotic and necrotic cell death in a model of ischemic cell injury. Exp Cell Res. 2011;317:1437–53. doi: 10.1016/j.yexcr.2011.03.011. [DOI] [PubMed] [Google Scholar]
- 21.Köhrmann M, Haubensak W, Hemraj I, Kaether C, Lessmann VJ, Kiebler MA. Fast, convenient, and effective method to transiently transfect primary hippocampal neurons. J Neurosci Res. 1999;58:831–5. doi: 10.1002/(SICI)1097-4547(19991215)58:6<831::AID-JNR10>3.0.CO;2-M. [DOI] [PubMed] [Google Scholar]
- 22.Gardmo C, Kotokorpi P, Helander H, Mode A. Transfection of adult primary rat hepatocytes in culture. Biochem Pharmacol. 2005;69:1805–13. doi: 10.1016/j.bcp.2005.03.028. [DOI] [PubMed] [Google Scholar]
- 23.Park JS, Surendran S, Kamendulis LM, Morral N. Comparative nucleic acid transfection efficacy in primary hepatocytes for gene silencing and functional studies. BMC Res Notes. 2011;4:8. doi: 10.1186/1756-0500-4-8. [DOI] [PMC free article] [PubMed] [Google Scholar]
- 24.Domart MC, Esposti DD, Sebagh M, Olaya N, Harper F, Pierron G, et al. Concurrent induction of necrosis, apoptosis, and autophagy in ischemic preconditioned human livers formerly treated by chemotherapy. J Hepatol. 2009;51:881–9. doi: 10.1016/j.jhep.2009.06.028. [DOI] [PubMed] [Google Scholar]
- 25.Cui Q, Tashiro S, Onodera S, Ikejima T. Augmentation of oridonin-induced apoptosis observed with reduced autophagy. J Pharmacol Sci. 2006;101:230–9. doi: 10.1254/jphs.FPJ06003X. [DOI] [PubMed] [Google Scholar]
- 26.Kohli R, Pan X, Malladi P, Wainwright MS, Whitington PF. Mitochondrial reactive oxygen species signal hepatocyte steatosis by regulating the phosphatidylinositol 3-kinase cell survival pathway. J Biol Chem. 2007;282:21327–36. doi: 10.1074/jbc.M701759200. [DOI] [PubMed] [Google Scholar]
- 27.Wang JH, Ahn IS, Fischer TD, Byeon JI, Dunn WA, Jr., Behrns KE, et al. Autophagy suppresses age-dependent ischemia and reperfusion injury in livers of mice. Gastroenterology. 2011;141:2188–2199.e6. doi: 10.1053/j.gastro.2011.08.005. [DOI] [PMC free article] [PubMed] [Google Scholar]
- 28.Tanida I. Autophagy basics. Microbiol Immunol. 2011;55:1–11. doi: 10.1111/j.1348-0421.2010.00271.x. [DOI] [PubMed] [Google Scholar]
- 29.Kim I, Lemasters JJ. Mitochondrial degradation by autophagy (mitophagy) in GFP-LC3 transgenic hepatocytes during nutrient deprivation. Am J Physiol Cell Physiol. 2011;300:C308–17. doi: 10.1152/ajpcell.00056.2010. [DOI] [PMC free article] [PubMed] [Google Scholar]
- 30.Wang Y, Singh R, Xiang Y, Czaja MJ. Macroautophagy and chaperone-mediated autophagy are required for hepatocyte resistance to oxidant stress. Hepatology. 2010;52:266–77. doi: 10.1002/hep.23645. [DOI] [PMC free article] [PubMed] [Google Scholar]
- 31.Kim JS, Nitta T, Mohuczy D, O’Malley KA, Moldawer LL, Dunn WA, Jr., et al. Impaired autophagy: A mechanism of mitochondrial dysfunction in anoxic rat hepatocytes. Hepatology. 2008;47:1725–36. doi: 10.1002/hep.22187. [DOI] [PMC free article] [PubMed] [Google Scholar]
- 32.Pardo M, Tirosh O. Protective signalling effect of manganese superoxide dismutase in hypoxia-reoxygenation of hepatocytes. Free Radic Res. 2009;43:1225–39. doi: 10.3109/10715760903271256. [DOI] [PubMed] [Google Scholar]
- 33.Tong J, Yan X, Yu L. The late stage of autophagy: cellular events and molecular regulation. Protein Cell. 2010;1:907–15. doi: 10.1007/s13238-010-0121-z. [DOI] [PMC free article] [PubMed] [Google Scholar]
- 34.Zucchini-Pascal N, de Sousa G, Rahmani R. Lindane and cell death: at the crossroads between apoptosis, necrosis and autophagy. Toxicology. 2009;256:32–41. doi: 10.1016/j.tox.2008.11.004. [DOI] [PubMed] [Google Scholar]
- 35.Esposti DD, Domart MC, Sebagh M, Harper F, Pierron G, Brenner C, et al. Autophagy is induced by ischemic preconditioning in human livers formerly treated by chemotherapy to limit necrosis. Autophagy. 2010;6:172–4. doi: 10.4161/auto.6.1.10699. [DOI] [PubMed] [Google Scholar]
- 36.Bhogal RH, Hodson J, Bartlett DC, Weston CJ, Curbishley SM, Haughton E, et al. Isolation of primary human hepatocytes from normal and diseased liver tissue: a one hundred liver experience. PLoS One. 2011;6:e18222. doi: 10.1371/journal.pone.0018222. [DOI] [PMC free article] [PubMed] [Google Scholar]
- 37.Schroedl C, McClintock DS, Budinger GR, Chandel NS. Hypoxic but not anoxic stabilization of HIF-1alpha requires mitochondrial reactive oxygen species. Am J Physiol Lung Cell Mol Physiol. 2002;283:L922–31. doi: 10.1152/ajplung.00014.2002. [DOI] [PubMed] [Google Scholar]
- 38.Biederbick A, Kern HF, Elsässer HP. Monodansylcadaverine (MDC) is a specific in vivo marker for autophagic vacuoles. Eur J Cell Biol. 1995;66:3–14. [PubMed] [Google Scholar]
- 39.Zhang JQ, Li YM, Liu T, He WT, Chen YT, Chen XH, et al. Antitumor effect of matrine in human hepatoma G2 cells by inducing apoptosis and autophagy. World J Gastroenterol. 2010;16:4281–90. doi: 10.3748/wjg.v16.i34.4281. [DOI] [PMC free article] [PubMed] [Google Scholar]
- 40.Mizushima N. Methods for monitoring autophagy. Int J Biochem Cell Biol. 2004;36:2491–502. doi: 10.1016/j.biocel.2004.02.005. [DOI] [PubMed] [Google Scholar]
- 41.Salvioli S, Ardizzoni A, Franceschi C, Cossarizza A. JC-1, but not DiOC6(3) or rhodamine 123, is a reliable fluorescent probe to assess delta psi changes in intact cells: implications for studies on mitochondrial functionality during apoptosis. FEBS Lett. 1997;411:77–82. doi: 10.1016/S0014-5793(97)00669-8. [DOI] [PubMed] [Google Scholar]
- 42.Gravance CG, Garner DL, Baumber J, Ball BA. Assessment of equine sperm mitochondrial function using JC-1. Theriogenology. 2000;53:1691–703. doi: 10.1016/S0093-691X(00)00308-3. [DOI] [PubMed] [Google Scholar]
- 43.Munafo´ DB, Colombo MI. A novel assay to study autophagy: regulation of autophagosome vacuole size by amino acid deprivation. J Cell Sci. 2001;114:3619–29. doi: 10.1242/jcs.114.20.3619. [DOI] [PubMed] [Google Scholar]


