

Abstract
Autophagy reallocates nutrients and clears normal cells of damaged proteins and organelles. In the context of metastatic disease, invading cancer cells hijack autophagic processes to survive and adapt in the host microenvironment. We sought to understand how autophagy is regulated in the metastatic niche for prostate cancer (PCa) cells where bone marrow stromal cell (BMSC) paracrine signaling induces PCa neuroendocrine differentiation (NED). In PCa, this transdifferentiation of metastatic PCa cells to neuronal-like cells correlates with advanced disease. Because autophagy provides a survival advantage for cancer cells and promotes cell differentiation, we hypothesized that autophagy mediates PCa NED in the bone. Thus, we determined the ability of paracrine factors in conditioned media (CM) from two separate BMSC subtypes, HS5 and HS27a, to induce autophagy in C4-2 and C4-2B bone metastatic PCa cells by characterizing the autophagy marker, LC3. Unlike HS27a CM, HS5 CM induced LC3 accumulation in PCa cells, suggesting autophagy was induced and indicating that HS5 and HS27a secrete a different milieu of paracrine factors that influence PCa autophagy. We identified interleukin-6 (IL-6), a cytokine more highly expressed in HS5 cells than in HS27a cells, as a paracrine factor that regulates PCa autophagy. Pharmacological inhibition of STAT3 activity did not attenuate LC3 accumulation, implying that IL-6 regulates NED and autophagy through different pathways. Finally, chloroquine inhibition of autophagic flux blocked PCa NED; hence autophagic flux maintains NED. Our studies imply that autophagy is cytoprotective for PCa cells in the bone, thus targeting autophagy is a potential therapeutic strategy.
Keywords: autophagy, bone metastatic prostate cancer, interleukin-6, neuroendocrine differentiation, paracrine signaling
Introduction
Paracrine signals provide molecular cues that enable prostate cancer (PCa) cells to colonize and adapt to the initially hostile bone microenvironment, where they ultimately form deadly osteoblastic lesions.1 One possible consequence of bone marrow stromal cell (BMSC) paracrine signaling is the induction of PCa cells to undergo neuroendocrine (NE) transdifferentiation. In a previous study, we found that soluble factors produced by two mixed BMSC cell lines, HS5 and HS27a, induced apoptosis and also promoted NE differentiation (NED) of the surviving population in co-cultured osteoblastic LNCaP and C4-2B PCa cell lines, but not in osteolytic PC3 PCa cells.2 These bone cell lines represent two separate niches of BMSCs, one structural (HS27a) and one supporting hematopoiesis (HS5).3 NE PCa cells have a reduced cell body and display branched and/or extended neuron-like processes in vitro and in vivo and are found focally in primary PCa tumors.4,5 NE PCa cells occur more extensively in metastatic PCa tumors, correlate with hormone refractive, advanced disease, and NE PCa cells may assist disease progression.4,5 For example, NE PCa cells express and secrete neuropeptides that stimulate cell proliferation.6 Furthermore, the NE PCa phenotype is reversible, where NE PCa cells can switch between dormant and proliferative states.7 Thus, NE PCa cells can evade conventional chemotherapy and contribute to tumor latency, yet remain ready to be primed for re-entry into the cell cycle to contribute to tumor growth during recurrence. Thus, identifying and dissecting the BMSC paracrine signaling pathways and the soluble factors that induce PCa NED can reveal new therapeutic means to inhibit NE PCa cell accumulation in PCa tumors.
To better understand the mechanisms that promote and maintain PCa NED in a BMSC-PCa model of bone metastasis, we investigated autophagy, a process that has been implicated in cancer cell adaptation to stressful metastatic environments.8 We hypothesized that autophagy induces and maintains PCa NED when PCa cells receive paracrine signals from BMSCs. Autophagy clears, degrades, and recycles cytoplasmic constituents to replenish cellular components and relieve metabolic stress.9 Normal cells use autophagy to maintain tissue homeostasis. However, autophagic flux also can serve as a cytoprotective response to excess metabolic stress, which cancer cells can use as a survival advantage.10 For example, cancer cells can upregulate autophagy to withstand insults that induce apoptosis in normal cells, such as drug treatments or oxygen and nutrient deprivation.10 Cancer cells capitalize on autophagy as a cell survival mechanism after detachment from the extracellular matrix, which would induce anoikis in normal cells.11 In addition, autophagy can support metastasis, dormancy, cell differentiation and maintenance of differentiated, quiescent, and tumor cells.8,12 Therefore, metastatic PCa cells could rely on autophagy to adapt to and survive in the stressful bone microenvironment.
During autophagy, a double-membrane vesicle—the autophagosome—forms around cytoplasmic contents and can be visualized as discrete puncta in the cytoplasm when appropriately labeled.13 The outer membrane of the autophagosome fuses with the lysosome to form the autolysosome, delivering the inner membrane-bound cargo to the lysosome for degradation and recycling.13 The microtubule-associated protein 1 light chain 3 (LC3) constitutes the autophagosome double membrane.13 To form the autophagosome, LC3 is proteolytically cleaved by the cysteine protease Autophagy 4 (ATG4), exposing a C-terminal glycine and forming LC3-I.14 Through a ubiquitin-like conjugation mechanism, the C-terminal glycine of LC3-I is conjugated to the lipid phosphatidylethanolamine (PE), forming LC3-II.15 LC3-II is incorporated into the outer and inner autophagosome double membrane.14 During autophagosome formation, LC3-II on the outer membrane is proteolytically cleaved from PE by ATG4, replenishing the available cytoplasmic LC3-I.16 Once the autophagosome fuses with the lysosome, the inner membrane LC3-II is degraded in the autolysosome along with the cargo.13
The posttranslational processing of LC3 is used to experimentally characterize autophagy. For example, because of PE hydrophobicity, LC3-II has faster mobility during SDS PAGE and therefore can be distinguished from LC3-I by western blot.17 Upregulation of LC3-I and LC3-II can indicate autophagy induction.17,18 In addition, a turnover of LC3-I to LC3-II suggests that autophagosomes are formed and thus that autophagy is underway.17,18 LC3 fusion proteins, such as GFP-LC3, are used to detect autophagosome formation, observed as punctate structures by fluorescent microscopy.17,18
Because inner membrane LC3-II is degraded in the autolysosome, an increase in LC3-II protein or puncta can indicate the inhibition of autolysosomal function and thus the inhibition of autophagosome turnover, or autophagic flux.17,18 Therefore, autolysosomal function can be tested using a lysosomal inhibitor, such as chloroquine, by which enhanced LC3-II accumulation in the presence of a lysosomal inhibitor indirectly shows that autophagic flux is occurring.17,18
We sought to determine if metastatic PCa cells upregulate autophagy to escape BMSC-induced apoptosis and subsequently undergo NED in the bone. To begin to address our hypothesis, we investigated the ability of soluble factors produced by BMSCs to induce autophagy in PCa cells. Differential gene expression analysis of BMSCs allowed us to focus on the cytokine interleukin-6 (IL-6), a factor known to protect PCa cells from apoptosis and induce PCa NED by signaling the phosphorylation and nuclear translocation of Signal Transducer and Activator of Transcription 3 (STAT3).19,20 We investigated IL-6 as a potential paracrine signal able on its own to induce PCa autophagy and we studied the effect of the abrogation of autophagic flux on PCa NED. In this paper, we use western blot analysis of the LC3 isoform, LC3B, and fluorescent microscopy of GFP-LC3B to assay autophagy and we analyzed cell morphology and process length to characterize NED.
Results
Factors in conditioned media from the HS5 BMSC cell line induce the accumulation of LC3B protein and GFP-LC3B puncta in C4-2 or C4-2B bone metastatic PCa cell lines
To determine the ability of BMSC-produced paracrine factors to induce autophagy in bone metastatic PCa cells, we cultured C4-2 or C4-2B cells in conditioned media from HS5 or HS27a BMSCs. Conditioned media from C4-2 or C4-2B cells served as negative controls for BMSC paracrine signaling. After 1, 2 or 3 days of exposure to conditioned media, protein was isolated from the C4-2 or C4-2B cells and analyzed by western blot and densitometry for total LC3B accumulation normalized to β-actin (LC3B/β-actin). At 2 and 3 days, C4-2 cells grown in HS5 conditioned media accumulated more LC3B than did cells grown in HS27a or control conditioned media (Fig. 1A). For example, at 3 days, the normalized LC3B level for C4-2 cells grown in HS5 conditioned media was more than two-fold higher than the LC3B levels in C4-2 cells grown in HS27a or control conditioned media (Fig. 1A). Likewise, C4-2B cells grown in HS5 conditioned media showed at least a 1.7-fold higher level of LC3B accumulation than cells grown in control or HS27a conditioned media (Fig. 1A). These data indicate that HS5 conditioned media contains specific soluble factor(s) and/or levels of factor(s) not present in PCa or HS27a conditioned media that induce LC3B accumulation.

Figure 1. HS5 BMSC CM induces accumulation of LC3B and GFP-LC3B in C4-2 or C4-2B bone metastatic PCa cells. (A) C4-2 or C4-2B cells were treated with conditioned media (CM) for 1–3 d. Total protein was isolated from cells and analyzed by western blot for LC3B accumulation. β-actin is a loading control. Densitometry was used to measure protein band intensity. Total LC3B (LC3B-I and LC3B-II) accumulation was normalized to β-actin (LC3B/β-actin) and LC3B levels were calculated relative to the PCa CM control. (B and C) C4-2 and C4-2B cells transiently expressing GFP-LC3B or GFP-LC3B (G120A) transgenes were treated with CM for 2 d. (B) Images, C4-2 (left) and C4-2B (right) were imaged using fluorescence microscopy (FITC, 40x magnification, scale bar = 50 μm). (C) Graph, the percentage of cells with GFP-LC3 puncta was calculated for 3–10 microscopy fields, n = 183–820 total cell count. (D) C4-2 or C4-2B cells were treated for 2 d with CM ± 20 μM chloroquine (CQ) and total protein was analyzed by western blot for LC3B accumulation.
To assess the effect of BMSC conditioned media on autophagosome formation, we transiently transfected C4-2 or C4-2B cells with GFP-LC3B and grew the cells in conditioned media for 2 d. We then looked for the formation of GFP-LC3B-containing autophagosomes visualized as distinct puncta. HS5 conditioned media induced GFP-LC3B puncta accumulation in more C4-2 and C4-2B cells than did PCa or HS27a conditioned media (Fig. 1B). We quantified the percentage of cells containing GFP-LC3B puncta. After 2 d of growth in HS5 conditioned media, 29% or 37% of C4-2 or C4-2B cells, respectively, accumulated GFP-LC3B puncta (Fig. 1C). In contrast, fewer than 6% or 5% of C4-2 or C4-2B cells, respectively, accumulated GFP-LC3B puncta when grown in control or HS27a conditioned media (Fig. 1C). As a negative control, C4-2 or C4-2B cells were transfected with the GFP-LC3B (G120A) mutant and grown in HS5 conditioned media; only 3% of the cells accumulated puncta (Fig. 1B and C). These results infer that HS5 conditioned media induced autophagosome formation in a significant proportion of C4-2 and C4-2B cells.
Monodansylcadaverine (MDC) is a fluorescent dye that stains various acidic vesicle organelles (AVOs) and thus can be used to stain late autophagosomes and autolysosomes.18 To determine if the HS5-mediated increase in the percentage of PCa cells accumulating GFP-LC3B puncta correlated with an increase in AVOs, we MDC stained AVOs in C4-2 or C4-2B cells that had been grown in control, HS5, or HS27a conditioned media for 3 d. Both the AVO fluorescence intensity and the subcellular distribution of AVOs throughout the cytoplasm and perinuclear region were comparable in C4-2 and C4-2B cells treated with control or BMSC conditioned media (Fig. S1A). Therefore, HS5 conditioned media does not appear to alter AVO accumulation.
To test if HS5-mediated upregulation of LC3B protein levels and GFP-LC3B puncta is due to autophagy induction or to the inhibition of autolysosomal function, we grew C4-2 or C4-2B cells for 2 d in conditioned media with or without 20 μM chloroquine. Chloroquine inhibits autophagic flux and thus inhibits degradation of LC3B-II.17,18 LC3B-II accumulation was higher when chloroquine was present for both C4-2 and C4-2B cells grown in either control or BMSC conditioned media (Fig. 1D), indicating that autophagic flux is maintained in the cells that are grown in conditioned media. Furthermore, these results suggest that the upregulation of LC3B protein accumulation and GFP-LC3 puncta in C4-2 and C4-2B cells grown in HS5 conditioned media is due to bona fide autophagy induction.
HS5 conditioned media contains higher levels of active interleukin-6 (IL-6) than control or HS27a conditioned media
Having discovered that conditioned media from the HS5 and HS27a BMSC cell lines have differing abilities to regulate autophagy in C4-2 and C4-2B PCa cells, we consulted existing gene array expression data for HS5 and HS27a cell lines. HS5 cells express approximately 167-fold more IL-6 transcript than HS27a cells, with IL-6 being the third most highly differentially expressed gene in HS5 cells when compared with HS27a cells.21 Consistent with those results, we found by western blot that HS5 conditioned media contained comparatively high levels of IL-6 protein (approximately four-fold more IL-6 protein than media supplemented with 50 ng/ml recombinant human IL-6 protein) that was not detectable in the conditioned media from HS27a cells, nor in media from C4-2 or C4-2B cells (Fig. 2A).

Figure 2. HS5 CM activates IL-6 signaling pathway in C4-2 or C4-2B cells. (A) C4-2 and C4-2B cells were treated with PCa or BMSC CM for 1 d. The media was collected and equal volumes of the media were analyzed by western blot for IL-6. Media supplemented with 50 ng/ml IL-6 protein, vehicle control, or media left untreated served as reference controls. Albumin is a loading control. Densitometry was used to measure protein band intensity. IL-6 accumulation was normalized to albumin (IL-6/albumin) and IL-6 levels were calculated relative to 50 ng/ml IL-6 human recombinant protein. (B) C4-2 and C4-2B cells were treated with conditioned media (CM) for 1–3 d. Total protein was isolated from cells and analyzed by western blot for phospho-STAT3 and total STAT3 accumulation. β-actin is a loading control. Phospho-STAT3 was normalized to β-actin (pSTAT3/β-actin) and phospho-STAT3 levels calculated relative to the HS5 CM treatment. (C) C4-2 (top) and C4-2B (bottom) cells were treated with CM for 2 d and immunostained for phospho-STAT3 (Alexa Fluor 488 secondary antibody; 63x magnification, scale bar = 50 μm). (D) C4-2 (top) and C4-2B (bottom) cells were treated with CM for 2 d and brightfield imaged (20x magnification, scale bar = 100 μm). Arrows points to examples of cell process extension/branching. For each treatment, the percentage of cells displaying cell process extension and/or branching was determined for 3–4 microscopy fields, n = 261–665 total cell count, and percentage is denoted on the image.
To determine if IL-6 could be one of the active factors secreted by HS5 cells that upregulates LC3B accumulation, we first determined if HS5 conditioned media could induce paracrine activation of IL-6 signaling in C4-2 and C4-2B cells. We used STAT3 western blot and immunofluorescent staining to evaluate IL-6 activity in C4-2 or C4-2B cells treated with HS5, HS27a, or control conditioned media. STAT3 phosphorylation (Fig. 2B) and nuclear accumulation (Fig. 2C) were higher in C4-2 and C4-2B cells treated with HS5 conditioned than in cells treated with HS27a conditioned media. STAT3 phosphorylation and nuclear accumulation were not detectable in cells treated with control conditioned media (Fig. 2B and C). In addition, 34% or 23% of C4-2 cells and 55% or 52% of C4-2B cells treated with HS5 or HS27a conditioned media, respectively, showed the NED morphology of neuron-like process branching and/or extension (Fig. 2D, arrows). But this NED morphology was detectable in only 2% of C4-2 cells or 19% of C4-2B cells treated with control conditioned media (Fig. 2D, arrows). Taken together, these results indicate that HS5 conditioned media, which contains comparatively high levels of IL-6 protein, and to a lesser extent HS27a conditioned media, can activate canonical IL-6 signaling in C4-2 and C4-2B cells.
Interleukin-6 (IL-6) is sufficient to induce the accumulation of LC3B protein and GFP-LC3 puncta in C4-2 or C4-2B cells
Because HS5 cells secrete active IL-6 protein (Fig. 2) and HS5 conditioned media increases LC3B accumulation in C4-2 and C4-2B cells (Fig. 1), we next determined if IL-6 alone is sufficient to upregulate LC3B levels in C4-2 and C4-2B cells. We treated cells for 2 or 3 days with 50 ng/ml recombinant human IL-6 protein—approximately four-fold less than the level of IL-6 secreted from HS5 cells. The IL-6 treatment was sufficient to induce nuclear accumulation of phosphorylated STAT3 in C4-2 and C4-2B cells (Fig. 3A) and to induce the NED morphology of neurite-like process extension and/or branching in 73% of C4-2 cells and 74% of C4-2B cells (Fig. 3B, arrows). Likewise, 50 ng/ml IL-6 was sufficient to increase LC3B accumulation in the PCa cells as seen by western blot (Fig. 3C). Densitometric analysis of total LC3B normalized to β-actin revealed that 3 d of treatment with IL-6 induced a 7-fold increase over the vehicle control in LC3B in C4-2 cells and 3 d of treatment induced a two-fold increase over the vehicle control in C4-2B cells (Fig. 3C).

Figure 3. IL-6 induces accumulation of LC3B and GFP-LC3 puncta in C4-2 or C4-2B cells. (A) C4-2 (top) and C4-2B (bottom) cells were treated with 50ng/ml IL-6 protein for 2 d and immunostained for phospho-STAT3 (Alexa Fluor 488, 63x magnification, scale bar = 50 μm). (B) C4-2 (top) and C4-2B (bottom) cells were treated with IL-6 protein for 2 d and imaged using brightfield (20x magnification, scale bar = 100 μm). Arrows points to examples of cell process extension/branching. For each treatment, the percentage of cells displaying cell process extension and/or branching was determined for 3 microscopy fields, n = 178–282 total cell count, and percentage is denoted on the image. (C) C4-2 and C4-2B cells were treated with 50 ng/ml IL-6 protein for 2 and 3 d. Total protein was isolated from cells and analyzed by western blot for LC3B, phospho-STAT3, and STAT3 accumulation. β-actin is a loading control. Densitometry was used to measure protein band intensity. Total LC3B and phospho-STAT3 accumulation were normalized to β-actin (LC3B/β-actin, pSTAT3/β-actin). LC3B levels were calculated relative to vehicle control, day 2 and phospho-STAT3 levels were calculated relative to IL-6 treatment, day 3. (D and E) C4-2 and C4-2B cells transiently expressing GFP-LC3B or GFP-LC3B (G120A) transgenes were treated with 50 ng/ml IL-6 protein for 2 and 3 d. (D) Image, C4-2 (top) and C4-2B (bottom) cells were imaged at day 3 using fluorescence microscopy (FITC, 40x magnification, scale bar = 50 μm). (E) Graph, The percentage of cells with GFP-LC3 puncta was calculated for 3–7 microscopy fields and graphed, n = 91–548 total cell count.
C4-2 or C4-2B cells that were transfected with GFP-LC3B and then treated with 50 ng/ml of IL-6 for 2 and 3 days showed a significant increase in GFP-LC3B puncta (Fig. 3D and E). At 2 and 3 days treatment with 50 ng/ml IL-6, 12% and 20% of C4-2 cells accumulated GFP-LC3B puncta, vs. only 1% and 3% of control-treated C4-2 cells (Fig. 3E). In addition, at 2 and 3 days, IL-6 induced GFP-LC3B puncta accumulation in 19% and 41% of C4-2B cells, while puncta accumulated in only 2% and 5% of control-treated cells (Fig. 3E). For the negative control, 2 days treatment with 50 ng/ml IL-6 did not induce puncta accumulation in C4-2 or C4-2B cells expressing the GFP-LC3B (G120A) mutant and less than 2% of cells accumulated puncta at 3 days (Fig. 3E). As observed for C4-2 or C4-2B cells treated with conditioned media, 50 ng/ml IL-6 did not alter AVO accumulation (Fig. S1B). Finally, we found that chloroquine treatment caused a significant increase in LC3B-II levels in the C4-2 or C4-2B cells treated with IL-6 (Fig. 6A and B), suggesting that IL-6 does not attenuate autophagic flux. Taken together, the accumulation of LC3B protein and GFP-LC3B puncta and the maintenance of autophagic flux in the presence of IL-6 provide evidence that IL-6 induces autophagy in the C4-2 and C4-2B cells.

Figure 6. Pharmacological inhibition of autophagy flux blocks IL-6-induced C4-2 and C4-2B NED morphology. (A) Chloroquine (CQ) dose sensitivity was determined using C4-2B cells treated with 50 ng/ml IL-6, or vehicle control, in the presence of 0–40 μM CQ for 3 d. Total protein was isolated and analyzed by western blot and normalized to β-actin loading control. Total LC3B and phospho-STAT3 accumulation were normalized to β-actin (LC3B/β-actin, pSTAT3/β-actin). LC3B or phospho-STAT3 levels were calculated relative to the vehicle control, 0 μM CQ or vehicle control, 10 μM CQ, respectively. (B–D) C4-2 and C4-2B cells were treated with 50 ng/ml IL-6 ± 40 μM CQ for 2 d. (B) Western blot, 3 biological replicates were analyzed by western blot. Total LC3B and phospho-STAT3 were normalized to β-actin and levels calculated relative to the first biological replicate of the 0 μM CQ control. LC3B, p value = 2^-04 (C4-2) or 5^-06 (C4-2B), phospho-STAT3, p value = 0.23 (C4-2) or 0.15 (C4-2B). (C) Image, C4-2 (top) and C4-2B (bottom) cells were imaged in brightfield (20x magnification, scale bar = 100 μm). Arrows point to examples of cell process extension/branching. Arrowheads point to examples of shortened cell processes. (D) Graph, the longest process extension per cell was measured using Image J, n = 116–164 cells measured, p value, 2^-21 (C4-2) or 5^-19 (C4-2B). (E) C4-2 and C4-2B cells treated with 50 ng/ml IL-6 for 1 d, followed by treatment with 40 μM CQ for 2 d. Cells were then fixed and immunostained for total STAT3 (Alexa Fluor 488, 20x magnification, scale bar = 100 μm).
IL-6 is an HS5 BMSC paracrine factor sufficient to mediate HS5-induced LC3B accumulation in C4-2 or C4-2B cells
To determine if the presence of IL-6 was sufficient to mediate HS5-induced LC3B accumulation in PCa cells, we treated C4-2 or C4-2B cells for 3 d with HS5 conditioned media in which IL-6 had been neutralized using an anti-IL-6 antibody. To first test the neutralizing efficacy of the anti-IL-6 antibody, we incubated growth media that contained 50 ng/ml recombinant human IL-6 protein with 0, 20 or 50 μg/ml of anti-IL-6 antibody. C4-2 cells were treated with the neutralized growth media for 3 d and analyzed for phosphorylation of STAT3 and LC3B accumulation by western blot. Either 20 or 50 μg/ml of anti-IL-6 antibody was sufficient to decrease phosphorylation of STAT3 to undetectable levels and reduce total LC3B accumulation by 20% and 40% in C4-2 cells (Fig. 4A), indicating that IL-6 activity was reduced and further demonstrating that IL-6 stimulates LC3B accumulation. HS5 conditioned media contains comparatively more than 50 ng/ml IL-6 protein (Fig. 2A), therefore at least 50 μg/ml of anti-IL-6 antibody was required to reduce phosphorylation of STAT3 at least 20% in C4-2 or C4-2B cells (Fig. 4B). Concomitant with the reduction in STAT3 phosphorylation was a 40% reduction in total LC3B levels in C4-2 or C4-2B cells (Fig. 4B). These results are evidence that IL-6 is a paracrine factor found in HS5 conditioned media sufficient to induce LC3B accumulation in C4-2 and C4-2B cells.
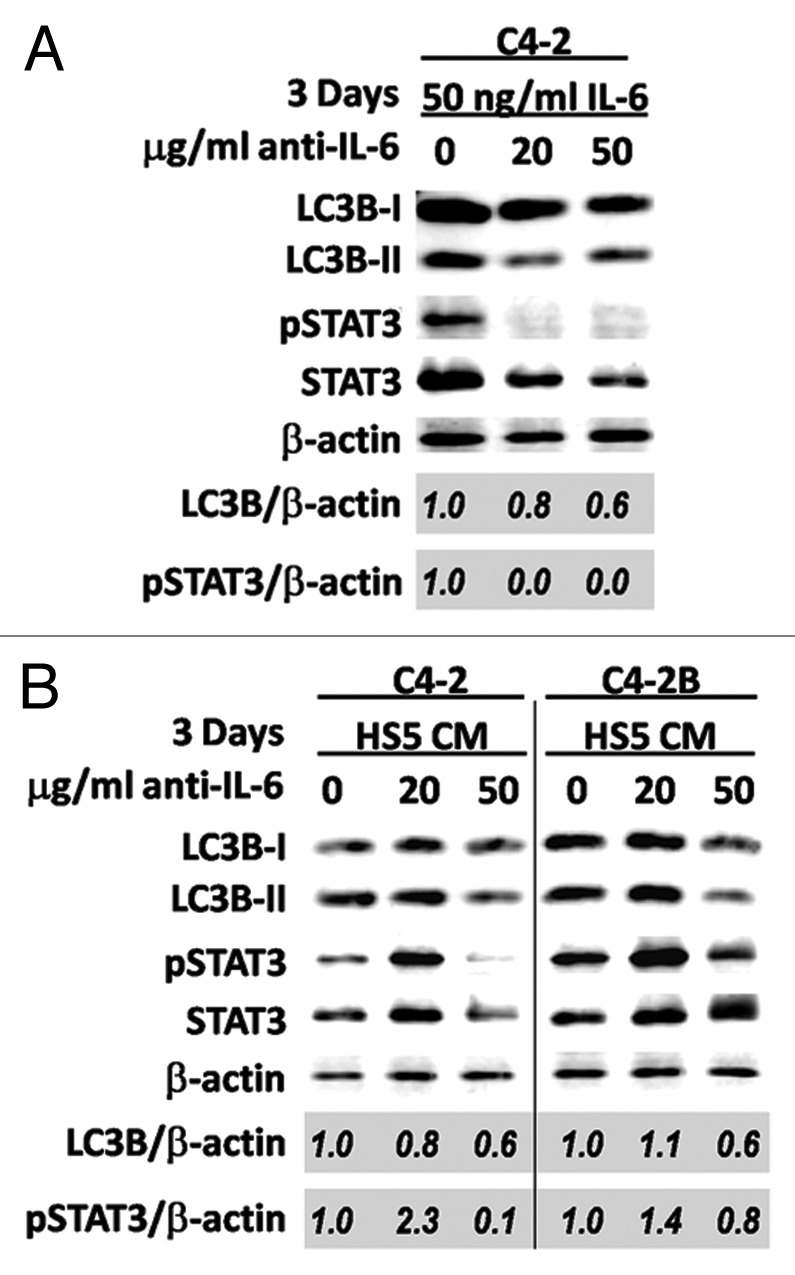
Figure 4. Neutralization of IL-6 in HS5 CM reduces LC3B accumulation in C4-2 or C4-2B cells. C4-2 or C4-2B cells were grown for 3 d in (A) growth media containing 50 ng/ml recombinant human IL-6 protein that had been incubated with 0, 20, or 50 μg/ml of anti-IL6 antibody or (B) HS5 CM that had been incubated with 0, 20, or 50 μg/ml of anti-IL6 antibody. Total protein was isolated from cells and analyzed by western blot for LC3B, phospho-STAT3, and STAT3 accumulation. β-actin is a loading control. Densitometry was used to measure protein band intensity. Total LC3B and phospho-STAT3 accumulation were normalized to β-actin (LC3B/β-actin, pSTAT3/β-actin). LC3B and phospho-STAT3 levels were calculated relative to the 0 μg/ml anti-IL-6 antibody control.
Pharmacological inhibition of STAT3 reduces PCa NED but is not sufficient to reduce LC3B accumulation in C4-2 and C4-2B cells
Cpd188 is a molecule that binds STAT3, inhibiting IL-6-mediated STAT3 phosphorylation and nuclear localization.22 We used Cpd188 to determine if, by blocking STAT3 activity, we could block IL-6 induced NED and LC3B upregulation in the C4-2 and C4-2B cells.
We tested the ability of Cpd188 to block phosphorylation of STAT3 using C4-2B cells treated with 50 ng/ml IL-6 in the presence of increasing Cpd188 concentrations over 3 d. While 10 μM Cpd188 was sufficient to reduce IL-6-induced STAT3 phosphorylation by 50% (Fig. 5A) and reduce NED (data not shown) in the C4-2B cells, 30 μM Cpd188 most effectively abrogated IL-6 signaling, reducing STAT3 phosphorylation by 90% (Fig. 5A) and NED evidenced by process formation (data not shown). The 3-d exposure to 30 μM Cpd188 was cytotoxic (data not shown); however, removal of 30 μM Cpd188 after 1 d of drug exposure led to the recovery of the IL-6 induced NED morphology for C4-2 and C4-2B cells (Fig. 5B, arrows). These data demonstrate that the STAT3 inhibitor, Cpd188, can effectively and reversibly inhibit IL-6-stimulated NED in both C4-2 and C4-2B cells.

Figure 5. Pharmacological STAT3 inhibition does not inhibit IL-6-induced LC3B accumulation in C4-2 or C4-2B cells. (A) C4-2B cells were treated with 50 ng/ml IL-6, or vehicle control, in the presence of 0–30 μM Cpd188 for 3 d. Total protein was isolated and analyzed by western blot and normalized to β-actin loading control. Total LC3B and phospho-STAT3 accumulation were normalized to β-actin (LC3B/β-actin, pSTAT3/β-actin). LC3B and phospho-STAT3 levels were calculated relative to the vehicle control, 0 μM Cpd188. (B) C4-2 (top) and C4-2B (bottom) cells were treated with 50 ng/ml IL-6 for 3 d (first panel) or with 50 ng/ml IL-6 for 1 d, followed by treatment with 30 μM Cpd188 for an additional 2 d (second panel). (Third panel) One day after the IL-6 + 30 μM Cpd188 treatment, the media was removed and replaced with fresh, untreated media. Cells were imaged using brightfield (20× magnification, scale bar = 100 μm). Arrows points to examples of cell process extension/branching. (C and D) C4-2 and C4-2B cells were treated with 50 ng/ml IL-6 ± 30 μM Cpd188 for 1 d. (C) Western blot, three biological replicates were analyzed by western blot. Total LC3B and phospho-STAT3 were normalized to β-actin and levels calculated relative to the first biological replicate of the 0 μM Cpd188 control. LC3B, p value = 0.04 (C4-2) or 0.90 (C4-2B), phospho-STAT3, p value = 0.05 (C4-2) or 0.006 (C4-2B). (D) Image, C4-2 (top) and C4-2B (bottom) cells were imaged using brightfield (20x magnification, scale bar = 100 μm). Arrows point to examples of cell process extension/branching. For each treatment, the percentage of cells displaying cell process extension and/or branching was determined for 3–5 microscopy fields, n = 121–250 total cell count, and percentage is denoted on the image.
Next, we determined if Cpd188 also could inhibit IL-6-induced LC3B accumulation in C4-2 or C4-2B cells. Our Cpd188 dose response study revealed that, with or without the addition of 50 ng/ml IL-6, Cdp188 (10–25 μM) upregulated LC3B accumulation in C4-2B cells (Fig. 5A). However, 30 μM Cpd188 reduced LC3B levels by 50% in the absence of IL-6 and by 25% in the presence of IL-6 (Fig. 5A). Because we had discovered earlier that 3 d of exposure to 30 μM Cpd188 was cytotoxic, we instead treated cells for 1 d with 50 ng/ml IL-6 in the presence of 30 μM Cpd188. Western blot analysis of three biological replicates and correlative microscopy revealed that, while 30 μM Cpd188 was sufficient to reduce STAT3 phosphorylation (Fig. 5C; p value, 0.05 and 0.006) and reduce NED by 15% and 52% (Fig. 5D) in IL-6-treated C4-2 and C4-2B cells, the Cpd188 treatment was not sufficient to reduce total LC3B accumulation (Fig. 5C). For example, the averaged densitometry values of three biological replicates showed that 30 μM Cpd188 induced a 1.5-fold increase in total LC3B in IL-6-treated C4-2 cells and no change in C4-2B cells (Fig. 5C; p value, 0.04 and 0.90). Therefore, we conclude that Cpd188 does not block IL-6 induced LC3B accumulation in C4-2 and C4-2B cells.
Pharmacological abrogation of autophagy inhibits PCa NED
To determine if autophagy functions in PCa NED maintenance, we analyzed the effect of abrogated autophagy on NED PCa cell morphology using chloroquine. We treated C4-2B cells with increasing concentrations of chloroquine with or without 50 ng/ml IL-6 for 3 d. C4-2B cells showed a dose-dependent increase in total LC3B with or without IL-6, along with a reduction in the extent of IL-6-induced STAT3 phosphorylation (Fig. 6A). C4-2B cells were most sensitive to 40 μM chloroquine, so we treated C4-2 or C4-2B cells with 50 ng/ml IL-6 with or without 40 μM chloroquine for 2 d. The average densitometry measurements of three biological replicates revealed that 40 μM chloroquine induced an average 12- or 10-fold increase in total LC3B in C4-2 or C4-2B cells, respectively (Fig. 6B; p value, 2^-04 or 5^-06). But chloroquine did not significantly reduce IL-6-mediated STAT3 phosphorylation in these experiments (Fig. 6B; p value, 0.23 or 0.15). We also found that treatment with 40 μM chloroquine for 2 d reduced the IL-6-induced cell process extension of C4-2 or C4-2B cells by 2.4- or 2.0-fold, respectively (Fig. 6C and D, arrowheads; p value, 2^-21 or 5^-19). Immunofluorescent staining of cells with shortened cell processes revealed that STAT3 was localized to the nucleus (Fig. 6E). Thus, taken together, these data show that while chloroquine blocks IL-6-induced NED PCa, chloroquine does not significantly reduce IL-6-induced STAT3 phosphorylation or abrogate IL-6-induced STAT3 nuclear localization.
Discussion
HS5 and HS27a paracrine signals differentially regulate autophagy in C4-2 and C4-2B bone metastatic PCa cells
HS5 and HS27a are immortalized cell lines derived from normal bone marrow aspirate from the same Caucasian male.3 The HS5 cells are secretory cells that promote hematopoietic stem cell proliferation and HS27a cells provide the cobblestone morphology characteristic of bone marrow stromal cells.3 Thus HS5 and HS27a cells represent diverse stromal cell phenotypes found in the bone microenvironment where metastatic cancer cells would encounter them. In investigating the effect of HS5 and HS27a cells on various PCa cell lines, we previously discovered that culturing cells from the PCa LNCaP progression model,23 with the HS5 and HS27a BMSCs or treating the PCa cells with conditioned media from the BMSC cell lines led to apoptosis in ~10% of the PCa cells and NED in the majority of the surviving PCa cells.2 This effect was specific to conditioned media from BMSCs whereas conditioned media from foreskin fibroblasts, prostate stromal cells, or prostate cancer cells did not elicit this phenotype.2 To extend these earlier findings and seek further molecular explanation for our observations, we explored the effect of BMSCs on autophagy in the C4-2 and C4-2B PCa cell lines. C4-2 and C4-2B PCa cells lines are two androgen-independent metastatic sublines of the LNCaP progression model and represent PCa cell types that would encounter BMSCs in vivo.23 The C4-2B cells, unlike the C4-2 cells, are conditioned to grow in bone.23
Given that autophagy can protect cells from apoptosis24 and mediate cell differentiation,25 we hypothesized that the PCa cells that survive BMSC-induced apoptosis and undergo NED, may do so through upregulation of autophagy. Both the HS5 and HS27a cells secrete factors that induce PCa NED,2 but unexpectedly, we found that the two BMSC cell types differentially regulated autophagy in the C4-2 and C4-2B cells. We discovered that, unlike HS27a cells, HS5 cells secreted types and/or levels of factor(s) that enhanced the accumulation of LC3B and GFP-LC3B puncta in C4-2 and C4-2B cells which we interpreted to be autophagy induction because autophagic flux is maintained. Therefore, in the bone microenvironment, PCa cells could integrate signals from multiple bone cell types that differentially regulate PCa autophagy in a time-dependent and/or synergistic manner to promote a net effect of PCa survival and adaptation.
HS5 cells also secrete, as yet, unidentified factor(s) that induce PCa apoptosis.2 Thus, because upregulation of autophagy can lead to increased cell death,9 it was plausible that HS5 autophagy induction in C4-2 and C4-2B cells contributed to PCa cell death. We found, however, that enhanced LC3B accumulation and GFP-LC3 puncta were maintained over extended periods of time in the surviving PCa cells exposed to HS5 CM and in the PCa cells that subsequently underwent NED. Therefore, we conclude that HS5 cells induce cytoprotective autophagy in PCa cells and that PCa cells take advantage of factors already present in the bone microenvironment to survive and adapt.
While HS5 cells secreted factors that upregulated GFP-LC3B puncta, AVO accumulation did not appear to be altered. Because MDC staining of AVOs is not specific for late autophagosomes or autolysosomes,18 MDC may not be sensitive enough to reveal changes in autophagosome or autolysosome accumulation in our experimental model, especially if there are other types of AVOs present. It also is plausible that while autophagic flux is maintained in PCa cells treated with HS5 conditioned media, the HS5-induced accumulation of LC3B and GFP-LC3 puncta could reflect a partial block in autophagy, in which case MDC staining of AVOs may not increase. More experiments are underway to further elucidate the mechanistic regulation of BMSCs on autophagy signaling cascades and function in PCa cells and to discriminate between canonical and non-canonical pathways that may be involved.
IL-6 is an HS5 BMSC paracrine factor that regulates autophagy in C4-2 and C4-2B bone metastatic PCa cells
IL-6-induced PCa NED is STAT3 dependent19 and both HS5 and HS27a CM induced STAT3 phosphorylation and NED in C4-2 and C4-2B cells. However these effects were more pronounced in PCa cells treated with HS5 CM presumably because HS5 CM contained significantly more IL-6 than HS27a CM. We hypothesized that IL-6 could account for the upregulation of LC3B levels and GFP-LC3B puncta induced by HS5 CM over the PCa control and HS27a CM because IL-6 had been shown to induce autophagy in myeloid monocytes.26 We found that IL-6 alone upregulated LC3B accumulation and GFP-LC3 puncta in C4-2 and C4-2B cells, even at a concentration significantly lower than that secreted by HS5 cells.
In addition to PCa NED, IL-6 also protects PCa cells from apoptosis in a STAT3-dependent manner.20 Upregulation of autophagy could be another mechanism through which IL-6 protects PCa cells from cell death. IL-6 levels are high in the serum of PCa patients with metastatic disease27-29 and IL-6 is produced in the bone microenvironment.30 Therefore, PCa cells could elicit IL-6-mediated autophagy as means to survive metastasis to and colonization of the bone.
Pharmacological inhibition of STAT3 does not block IL-6-mediated autophagy
STAT3 is overexpressed in numerous cancer types, including PCa,31 and genetic or pharmacological inhibition of STAT3 has been shown to reduce PCa tumor growth in vivo.32-34 Therefore, STAT3 inhibitors are being developed and characterized for use as anticancer agents. In 2009, the Tweardy lab reported on their virtual screen of 920,000 compounds in which they discovered three STAT3-specific inhibitors (Cpd3, -30, -188) that block IL-6-mediated phosphorylation of STAT3 and STAT3 nuclear translocation.22 We tested the effect of Cpd188 on IL-6-mediated NED and autophagy in the C4-2 and C4-2B cells. Cpd188 blocked IL-6 induced NED morphology, resulting in the loss of cell process extension and branching. However, Cdp188 did not block IL-6 induced LC3B accumulation. Thus it is possible that IL-6 induces autophagy independent of IL-6-mediated STAT3 activation and that IL-6 regulates NED and autophagy through different signaling pathways.
Chloroquine inhibits IL-6-mediated PCa NED independent of STAT3
Autophagy maintains neuron homeostasis, in part, by clearing protein aggregates and dysfunctional autophagy is associated with neurodegenerative diseases such as Parkinson, Alzheimer, and Huntington.35,36 For example, autophagosomes that do not mature into autolysosomes accumulate in the degenerating neurites of the brains of Alzheimer patients.37 Thus functioning autophagy is important for the maintenance of differentiated neurons35,36 and likewise, our evidence suggests that autophagy is also important for NE PCa homeostasis.
We found that chloroquine, a lysomotropic agent that blocks autolysosomal function,38 reduced cell process length in C4-2 and C4-2B cells that had undergone IL6-induced NED. A study of lysosomal function in axon degeneration showed that chloroquine caused degradation of superior cervical ganglia axons.39 Thus the chloroquine-mediated inhibition of cell process extension that we observed in NE PCa cells may mimic neurodegenerative cellular remodeling and may serve as a strategy to disrupt NE PCa cell function in tumors. Indeed, hydroxychloroquine, a form of chloroquine that contains a side chain hydroxyl group, currently is being tested in clinical trials to block autophagy in metastatic PCa.10 Because chloroquine blocks lysosome function as well, it is possible that chloroquine shortening of NE PCa cell processes is not merely a reflection of autophagy-specific abrogation.
IL-6-induced PCa NED is STAT3 dependent.19 However, chloroquine did not significantly reduce STAT3 phosphorylation. In addition to phosphorylated STAT3, unphosphorylated STAT3 also can translocate to the nucleus and activate transcription.40 Therefore we looked at total STAT3 localization in chloroquine-treated NE PCa cells that had shortened cell processes, and these cells had the same STAT3 subcellular localization as cells that had not been exposed to chloroquine. Therefore, the mechanism of how chloroquine altered IL-6-induced NE PCa morphology remains open to speculation.
Model for BMSC paracrine regulation of autophagy and NED in bone metastatic prostate cancer
We do not contend that IL-6 is the only BMSC paracrine factor that is sufficient to modulate autophagy, but rather that it is a key component of a complex milieu of bioactive factors that function in the metastatic niche. Because C4-2 and C4-2B bone metastatic PCa cells would be in contact with multiple cell types in the bone microenvironment, including those represented by the HS5 and HS27a cell types, we believe that the PCa cells are exposed to multiple paracrine signals that at threshold- and factor-specific combinations would modify PCa cell behavior. In this context, factors that induce cytoprotective autophagy and/or NED may ultimately favor tumor progression.
Based on our previous and current data, we propose a model (Fig. 7) where, upon arrival to the bone microenvironment, metastatic PCa cells encounter BMSC paracrine factors that induce apoptosis in a subpopulation of the PCa cells. The surviving PCa cells exploit paracrine factors present in the bone microenvironment, such as IL-6, to mount a cytoprotective autophagy response and undergo NED. Based on our studies, autophagy and NED would be regulated through separate STAT3-independent and STAT3-dependent pathways, respectively. However, abrogation of autophagy with chloroquine would favor NE PCa degeneration.

Figure 7. Model of BMSC IL-6 paracrine regulation of NED autophagy in bone metastatic PCa cells in the bone microenvironment. Based on our data, we propose a model wherein, upon arrival to the bone, PCa cells encounter, as yet, unidentified BMSC paracrine signal(s) that induce apoptosis in a subpopulation of the PCa cells. The PCa cell population that survives does so by taking advantage of paracrine factors secreted by BMSCs, such as IL-6. The IL-6 paracrine signal induces cytoprotective PCa autophagy and PCa NED through separate pathways. However, if autophagy flux is blocked in PCa cells, the NE PCa cells will mimic neurodegeneration, losing cell process extension.
In summary, we show for the first time that BMSCs regulate autophagy in bone metastatic PCa cells through IL-6 paracrine signaling. In the PCa-BMSC context, induction of PCa autophagy may be cytoprotective and help maintain NE PCa homeostasis. It will be of critical importance to determine the physiological significance of IL-6-regulated PCa autophagy and chloroquine-mediated NE PCa degeneration in vivo. The clinical trials underway should be able to provide invaluable insight into these and other questions.
Materials and Methods
Cell culture
C4-2 and C4-2B prostate cancer cells and HS5 and HS27a bone marrow stromal cells were grown in a 37°C, 5.0% (v/v) CO2 growth chamber. Prostate cancer cells were cultured in T-medium (Gibco/Invitrogen, 02-0056DJ) supplemented with 5% (v/v) fetal bovine serum (FBS) (Atlanta Biologicals, S11150), 0.4 mM L-glutamine (L-glut) (Gibco/Invitrogen, 25030081), and 10 U/ml penicillin G sodium and 10 mg/ml streptomycin sulfate (pen-strep) (Gibco/Invitrogen, 15140122). The bone marrow stromal cells were cultured in low glucose DMEM medium (Gibco/Invitrogen, 11960-044) supplemented with 10% FBS, 0.4 mM L-glut, and pen-strep.
Cell transfection
The GFP-LC3B or GFP-LC3B (G120A) transgenes were transfected into cells using the Premo Autophagy Sensor LC3B-GFP BacMam 2.0 system according to manufacturer’s instructions (Invitrogen, P36235). Cells were left undisturbed for at least 24 h following transfection, before treatments were administered.
Conditioned media treatments
To obtain conditioned media, culture media was removed from cultured cells and replaced with fresh T-medium/5% FBS. After 3 d incubation, the conditioned T-medium was collected and spun at 1400 rpm for 3 min to remove cell debris. The conditioned media was stored at -80°C.
Drugs and cytokines
The following drugs were used: STAT3 Inhibitor IX/Cpd188 (EMD/Calbiochem, 573125) suspended DMSO, chloroquine diphosphate aqueous solution (Invitrogen, P36235), recombinant human interleukin-6 (IL-6) (EMD/Calbiochem, 407652) suspended in 100 mM acetic acid.
Western blot and antibodies
Protein was isolated from cells using NP40 lysis buffer [0.5% NP-40 (Sigma, NP40S), 50 mM Tris (pH 7.5), 150 mM NaCl, 3 mM MgCl2, 1× protease inhibitors (Roche, 0505489001)]. Protein concentration was measured using the Pierce BCA Protein Assay Kit (Thermo Scientific, 23225). For western blot analysis, equal protein concentrations were loaded onto and separated in 17% sodium dodecyl sulfate polyacrylamide gel (40% acrylamide/bis-acrylamide solution; Bio-Rad, 161-0148). Proteins were transferred from the gel to 0.45 μm pore size nitrocellulose membrane (Bio-Rad, 162-0094). The membrane blocked with 3% bovine serum albumin (BSA) (Sigma-Aldrich, A7906) in 1× TBST (20 mM Tris, pH 7.6, 150 mM NaCl, 0.05% Tween-20). Primary and secondary antibodies were diluted in 3% BSA/1X TBST. Protein blot bands were visualized using Pierce ECL Western Blotting Substrate (Thermo Scientific, 32106) imaged using the Fujifilm LAS-4000 imager (Fuji). Densitometry of western blot bands was performed using Image J (http://rsbweb.nih.gov/ij/). Primary antibodies: LC3B (Novus Biologicals; NB600-1384), phospho-STAT3 (Y705) (Cell Signaling Technology, 4113), STAT3 (Cell Signaling Technology; 9139), β-actin (Abcam, ab8226), interleukin-6 (EMD/Calbiochem, 407670). Secondary antibodies: sheep anti-mouse (Jackson ImmunoResearch Laboratories, 515-035-062), goat anti-rabbit (Sigma-Aldrich, A6154).
IL-6 neutralization
Growth media was incubated without (control) or with interleukin-6 antibody (EMD/Calbiochem; 407670) overnight at 4°C with rocking before adding to cells.
Immunostaining
Cells were fixed and permeabilized with 100% methanol at -20°C for 10 min. Cells were blocked with 5% BSA in 1× phosphate buffered saline (PBS) at room temperature for 30 min. Antibodies were diluted in 2.5% BSA/1X PBS. Cells were incubated in primary antibody at room temperature for 1 h, washed with 1× PBS, and then incubated in fluorescently labeled secondary antibody at room temperature in the dark for 1 h.
Fluorescently labeled secondary antibodies
Alexa Fluor 488, goat anti-mouse (Invitrogen, A11001), Alexa Fluor 568, goat anti-rabbit (Invitrogen, A11061).
Monodansylcadaverine (MDC) staining
Live cells in growth media were incubated with 60 μM MDC (Sigma-Aldrich, 30432) at 37°C for 45 min to 1 h when the acidic vesicle organelles became visible by fluorescent microscopy using the DAPI filter.
Microscopy
Images were taken and processed using the Nikon Eclipse TE300 inverted microscope (Nikon) and NIS Elements software (Nikon) (20× and 40× magnification) or using the Zeiss axioscope (Carl Zeiss GmbH) and AxioVision software (Carl Zeiss GmbH) (63× magnification).
Statistics
Statistical significance was determined using Microsoft Excel unpaired Student's t test.
Supplementary Material
Acknowledgments
We would like to thank all of the members of the Farach-Carson and Carson labs for scientific discussion and/or technical support, especially, Drs. Chu Zhang, Lynn Opdenaker, and Daniel Harrington, and Lisa Gurski, Ariel Diaz, and Derek Shenefelt. We would also like to thank the Braam lab, especially Drs. Janet Braam and YuChang Tsai, for training in autophagy and microscopy techniques. Thank you to all of the members of the Prostate Cancer P01 group, especially Drs. Robert Sikes and Fayth Miles for scientific discussion on prostate cancer neuroendocrine differentiation. This work was supported by NIH CA128296 (Delk) and NIH/NCI P01 CA098912 (Farach-Carson). The authors also wish to extend a special thank you to the Simmons Family Foundation for their award that will enable us to further study the role of ATG4 in autophagy.
Glossary
Abbreviations:
- BMSC
bone marrow stromal cell
- CM
conditioned media
- CQ
chloroquine
- IL-6
interleukin-6
- LC3
microtubule-associated protein 1 light chain 3
- NE
neuroendocrine
- NED
neuroendocrine differentiation
- PCa
prostate cancer
- PE
phosphatidylethanolamine
- STAT3
signal transducer and activator of transcription 3
Disclosure of Potential Conflicts of Interest
No potential conflicts of interest were disclosed.
Footnotes
Previously published online: www.landesbioscience.com/journals/autophagy/article/19226
References
- 1.Msaouel P, Pissimissis N, Halapas A, Koutsilieris M. Mechanisms of bone metastasis in prostate cancer: clinical implications. Best Pract Res Clin Endocrinol Metab. 2008;22:341–55. doi: 10.1016/j.beem.2008.01.011. [DOI] [PubMed] [Google Scholar]
- 2.Zhang C, Soori M, Miles FL, Sikes RA, Carson DD, Chung LW, et al. Paracrine factors produced by bone marrow stromal cells induce apoptosis and neuroendocrine differentiation in prostate cancer cells. Prostate. 2011;71:157–67. doi: 10.1002/pros.21231. [DOI] [PMC free article] [PubMed] [Google Scholar]
- 3.Roecklein BA, Torok-Storb B. Functionally distinct human marrow stromal cell lines immortalized by transduction with the human papilloma virus E6/E7 genes. Blood. 1995;85:997–1005. [PubMed] [Google Scholar]
- 4.Sun Y, Niu J, Huang J. Neuroendocrine differentiation in prostate cancer. Am J Transl Res. 2009;1:148–62. [PMC free article] [PubMed] [Google Scholar]
- 5.Marcu M, Radu E, Sajin M. Neuroendocrine transdifferentiation of prostate carcinoma cells and its prognostic significance. Rom J Morphol Embryol. 2010;51:7–12. [PubMed] [Google Scholar]
- 6.Yuan TC, Veeramani S, Lin FF, Kondrikou D, Zelivianski S, Igawa T, et al. Androgen deprivation induces human prostate epithelial neuroendocrine differentiation of androgen-sensitive LNCaP cells. Endocr Relat Cancer. 2006;13:151–67. doi: 10.1677/erc.1.01043. [DOI] [PubMed] [Google Scholar]
- 7.Cox ME, Deeble PD, Lakhani S, Parsons SJ. Acquisition of neuroendocrine characteristics by prostate tumor cells is reversible: implications for prostate cancer progression. Cancer Res. 1999;59:3821–30. [PubMed] [Google Scholar]
- 8.Kenific CM, Thorburn A, Debnath J. Autophagy and metastasis: another double-edged sword. Curr Opin Cell Biol. 2010;22:241–5. doi: 10.1016/j.ceb.2009.10.008. [DOI] [PMC free article] [PubMed] [Google Scholar]
- 9.Mariño G, Lo´pez-Oti´n C. Autophagy: molecular mechanisms, physiological functions and relevance in human pathology. Cell Mol Life Sci. 2004;61:1439–54. doi: 10.1007/s00018-004-4012-4. [DOI] [PMC free article] [PubMed] [Google Scholar]
- 10.White E, DiPaola RS. The double-edged sword of autophagy modulation in cancer. Clin Cancer Res. 2009;15:5308–16. doi: 10.1158/1078-0432.CCR-07-5023. [DOI] [PMC free article] [PubMed] [Google Scholar]
- 11.Lock R, Debnath J. Extracellular matrix regulation of autophagy. Curr Opin Cell Biol. 2008;20:583–8. doi: 10.1016/j.ceb.2008.05.002. [DOI] [PMC free article] [PubMed] [Google Scholar]
- 12.Lee JA. Autophagy in neurodegeneration: two sides of the same coin. BMB Rep. 2009;42:324–30. doi: 10.5483/BMBRep.2009.42.6.324. [DOI] [PubMed] [Google Scholar]
- 13.He C, Klionsky DJ. Regulation mechanisms and signaling pathways of autophagy. Annu Rev Genet. 2009;43:67–93. doi: 10.1146/annurev-genet-102808-114910. [DOI] [PMC free article] [PubMed] [Google Scholar]
- 14.Kabeya Y, Mizushima N, Yamamoto A, Oshitani-Okamoto S, Ohsumi Y, Yoshimori T. LC3, GABARAP and GATE16 localize to autophagosomal membrane depending on form-II formation. J Cell Sci. 2004;117:2805–12. doi: 10.1242/jcs.01131. [DOI] [PubMed] [Google Scholar]
- 15.Ichimura Y, Kirisako T, Takao T, Satomi Y, Shimonishi Y, Ishihara N, et al. A ubiquitin-like system mediates protein lipidation. Nature. 2000;408:488–92. doi: 10.1038/35044114. [DOI] [PubMed] [Google Scholar]
- 16.Tanida I, Sou YS, Ezaki J, Minematsu-Ikeguchi N, Ueno T, Kominami E. HsAtg4B/HsApg4B/autophagin-1 cleaves the carboxyl termini of three human Atg8 homologues and delipidates microtubule-associated protein light chain 3- and GABAA receptor-associated protein-phospholipid conjugates. J Biol Chem. 2004;279:36268–76. doi: 10.1074/jbc.M401461200. [DOI] [PubMed] [Google Scholar]
- 17.Mizushima N, Yoshimori T. How to interpret LC3 immunoblotting. Autophagy. 2007;3:542–5. doi: 10.4161/auto.4600. [DOI] [PubMed] [Google Scholar]
- 18.Klionsky DJ, Abeliovich H, Agostinis P, Agrawal DK, Aliev G, Askew DS, et al. Guidelines for the use and interpretation of assays for monitoring autophagy in higher eukaryotes. Autophagy. 2008;4:151–75. doi: 10.4161/auto.5338. [DOI] [PMC free article] [PubMed] [Google Scholar]
- 19.Spiotto MT, Chung TD. STAT3 mediates IL-6-induced neuroendocrine differentiation in prostate cancer cells. Prostate. 2000;42:186–95. doi: 10.1002/(SICI)1097-0045(20000215)42:3<186::AID-PROS4>3.0.CO;2-E. [DOI] [PubMed] [Google Scholar]
- 20.Lee SO, Lou W, Johnson CS, Trump DL, Gao AC. Interleukin-6 protects LNCaP cells from apoptosis induced by androgen deprivation through the Stat3 pathway. Prostate. 2004;60:178–86. doi: 10.1002/pros.20045. [DOI] [PubMed] [Google Scholar]
- 21.Graf L, Iwata M, Torok-Storb B. Gene expression profiling of the functionally distinct human bone marrow stromal cell lines HS-5 and HS-27a. Blood. 2002;100:1509–11. doi: 10.1182/blood-2002-03-0844. [DOI] [PubMed] [Google Scholar]
- 22.Xu X, Kasembeli MM, Jiang X, Tweardy BJ, Tweardy DJ. Chemical probes that competitively and selectively inhibit Stat3 activation. PLoS One. 2009;4:e4783. doi: 10.1371/journal.pone.0004783. [DOI] [PMC free article] [PubMed] [Google Scholar]
- 23.Thalmann GN, Anezinis PE, Chang SM, Zhau HE, Kim EE, Hopwood VL, et al. Androgen-independent cancer progression and bone metastasis in the LNCaP model of human prostate cancer. Cancer Res. 1994;54:2577–81. [PubMed] [Google Scholar]
- 24.Levine B. Cell biology: autophagy and cancer. Nature. 2007;446:745–7. doi: 10.1038/446745a. [DOI] [PubMed] [Google Scholar]
- 25.Mizushima N, Levine B. Autophagy in mammalian development and differentiation. Nat Cell Biol. 2010;12:823–30. doi: 10.1038/ncb0910-823. [DOI] [PMC free article] [PubMed] [Google Scholar]
- 26.Roca H, Varsos ZS, Sud S, Craig MJ, Ying C, Pienta KJ. CCL2 and interleukin-6 promote survival of human CD11b+ peripheral blood mononuclear cells and induce M2-type macrophage polarization. J Biol Chem. 2009;284:34342–54. doi: 10.1074/jbc.M109.042671. [DOI] [PMC free article] [PubMed] [Google Scholar]
- 27.Adler HL, McCurdy MA, Kattan MW, Timme TL, Scardino PT, Thompson TC. Elevated levels of circulating interleukin-6 and transforming growth factor-beta1 in patients with metastatic prostatic carcinoma. J Urol. 1999;161:182–7. doi: 10.1016/S0022-5347(01)62092-5. [DOI] [PubMed] [Google Scholar]
- 28.Drachenberg DE, Elgamal AA, Rowbotham R, Peterson M, Murphy GP. Circulating levels of interleukin-6 in patients with hormone refractory prostate cancer. Prostate. 1999;41:127–33. doi: 10.1002/(SICI)1097-0045(19991001)41:2<127::AID-PROS7>3.0.CO;2-H. [DOI] [PubMed] [Google Scholar]
- 29.Shariat SF, Andrews B, Kattan MW, Kim J, Wheeler TM, Slawin KM. Plasma levels of interleukin-6 and its soluble receptor are associated with prostate cancer progression and metastasis. Urology. 2001;58:1008–15. doi: 10.1016/S0090-4295(01)01405-4. [DOI] [PubMed] [Google Scholar]
- 30.de Vernejoul MC, Cohen-Solal M, Orcel P. Bone cytokines. Curr Opin Rheumatol. 1993;5:332–8. doi: 10.1097/00002281-199305030-00012. [DOI] [PubMed] [Google Scholar]
- 31.Buettner R, Mora LB, Jove R. Activated STAT signaling in human tumors provides novel molecular targets for therapeutic intervention. Clin Cancer Res. 2002;8:945–54. [PubMed] [Google Scholar]
- 32.Weerasinghe P, Li Y, Guan Y, Zhang R, Tweardy DJ, Jing N. T40214/PEI complex: a potent therapeutics for prostate cancer that targets STAT3 signaling. Prostate. 2008;68:1430–42. doi: 10.1002/pros.20807. [DOI] [PMC free article] [PubMed] [Google Scholar]
- 33.Ni Z, Lou W, Leman ES, Gao AC. Inhibition of constitutively activated Stat3 signaling pathway suppresses growth of prostate cancer cells. Cancer Res. 2000;60:1225–8. [PubMed] [Google Scholar]
- 34.Gao L, Zhang L, Hu J, Li F, Shao Y, Zhao D, et al. Down-regulation of signal transducer and activator of transcription 3 expression using vector-based small interfering RNAs suppresses growth of human prostate tumor in vivo. Clin Cancer Res. 2005;11:6333–41. doi: 10.1158/1078-0432.CCR-05-0148. [DOI] [PubMed] [Google Scholar]
- 35.Wong E, Cuervo AM. Autophagy gone awry in neurodegenerative diseases. Nat Neurosci. 2010;13:805–11. doi: 10.1038/nn.2575. [DOI] [PMC free article] [PubMed] [Google Scholar]
- 36.Martinez-Vicente M, Cuervo AM. Autophagy and neurodegeneration: when the cleaning crew goes on strike. Lancet Neurol. 2007;6:352–61. doi: 10.1016/S1474-4422(07)70076-5. [DOI] [PubMed] [Google Scholar]
- 37.Yu WH, Cuervo AM, Kumar A, Peterhoff CM, Schmidt SD, Lee JH, et al. Macroautophagy--a novel Beta-amyloid peptide-generating pathway activated in Alzheimer’s disease. J Cell Biol. 2005;171:87–98. doi: 10.1083/jcb.200505082. [DOI] [PMC free article] [PubMed] [Google Scholar]
- 38.Mizushima N, Yoshimori T, Levine B. Methods in mammalian autophagy research. Cell. 2010;140:313–26. doi: 10.1016/j.cell.2010.01.028. [DOI] [PMC free article] [PubMed] [Google Scholar]
- 39.Zheng J, Yan T, Feng Y, Zhai Q. Involvement of lysosomes in the early stages of axon degeneration. Neurochem Int. 2010;56:516–21. doi: 10.1016/j.neuint.2009.12.012. [DOI] [PubMed] [Google Scholar]
- 40.Yang J, Liao X, Agarwal MK, Barnes L, Auron PE, Stark GR. Unphosphorylated STAT3 accumulates in response to IL-6 and activates transcription by binding to NFkappaB. Genes Dev. 2007;21:1396–408. doi: 10.1101/gad.1553707. [DOI] [PMC free article] [PubMed] [Google Scholar]
Associated Data
This section collects any data citations, data availability statements, or supplementary materials included in this article.