Abstract
More than 30 neurodegenerative diseases including Alzheimer disease (AD), frontotemporal lobe dementia (FTD), and some forms of Parkinson disease (PD) are characterized by the accumulation of an aggregated form of the microtubule-binding protein tau in neurites and as intracellular lesions called neurofibrillary tangles. Diseases with abnormal tau as part of the pathology are collectively known as the tauopathies. Methylthioninium chloride, also known as methylene blue (MB), has been shown to reduce tau levels in vitro and in vivo and several different mechanisms of action have been proposed. Herein we demonstrate that autophagy is a novel mechanism by which MB can reduce tau levels. Incubation with nanomolar concentrations of MB was sufficient to significantly reduce levels of tau both in organotypic brain slice cultures from a mouse model of FTD, and in cell models. Concomitantly, MB treatment altered the levels of LC3-II, cathepsin D, BECN1, and p62 suggesting that it was a potent inducer of autophagy. Further analysis of the signaling pathways induced by MB suggested a mode of action similar to rapamycin. Results were recapitulated in a transgenic mouse model of tauopathy administered MB orally at three different doses for two weeks. These data support the use of this drug as a therapeutic agent in neurodegenerative diseases.
Keywords: autophagy, methylene blue, phosphorylation, tau, tissue culture, transgenic mouse
Introduction
The microtubule-binding protein tau is associated with pathology development and cellular dysfunction in more than 30 neurodegenerative diseases. Mutations in the tau gene in both coding and noncoding regions are a primary cause of frontotemporal dementia (FTD). However, for most of the other tauopathies, including most cases of sporadic AD, the contribution of tau to pathogenesis is less clear as it may be part of a mixed etiology or secondary to the central disease mechanism. There is some debate as to the form of tau that is linked to neurotoxicity, with hyperphosphorylated soluble tau, tau oligomers and tau aggregates all having been implicated at some level.1-8 In addition, it is unknown whether neurotoxicity is primarily due to loss of tau’s normal function in stabilizing microtubules in the axon, due to loss of function in signaling pathways, or as a gain of dysfunction due to accumulation of a toxic form of misfolded, abnormally phosphorylated tau that is prone to aggregation and accumulation in the somatodendritic compartment. Although the exact form of tau associated with neurotoxicity is unknown, it would seem that attenuation of events that lead to the accumulation of abnormal tau may be of therapeutic benefit. Transgenic mouse lines overexpressing mutant or wild-type human tau have been developed which replicate most of the features of human tauopathies in that they accumulate somatodendritic, hyperphosphorylated tau, often in the form of mature neurofibrillary tangles. Some of the models undergo neurodegeneration and become cognitively impaired thus providing useful model systems for testing potential therapeutics.9
Several approaches have been proposed to reduce the levels of abnormal proteins, including modulation of protein degradation. Multiple protein degradation pathways exist including ubiquitin-proteasome mediated clearance that acts on smaller, misfolded proteins, and autophagy (macroautophagy, microautophagy, and chaperone-mediated autophagy) for the clearance of larger, misfolded or aggregated proteins, and dysfunctional organelles. Controlled autophagy plays a crucial role in cell survival and in regulating multiple cell functions. Loss of control has been implicated in pathogenesis or progression of neurodegenerative diseases due to failed clearance of disease-associated protein. For example, polyglutamine-repeat containing proteins found in Huntington disease and spinocerabellar ataxia are cleared by macroautophagy10-12 and stimulation of autophagy in cellular and animal models of these diseases results in a reduction of both the levels of pathogenic proteins and their associated toxicity. Similarly, overexpression of the autophagy regulator BECN1 in mice expressing α-synuclein reduced the concentration of synuclein aggregates and resulted in increased levels of synaptic proteins.13 Tau has been shown to be cleared both by macroautophagy and chaperone-mediated autophagy,14 and lysosomal vesicles containing tau have been observed in both AD and normal individuals15 suggesting that autophagy represents a clearance mechanism for the tau protein in both the normal brain, and in the disease condition.16 These data indicate that autophagy modulation has the potential to alter disease progression for a variety of neurodegenerative diseases, therefore identifying drugs that act via autophagy may have therapeutic value.
Methylene blue belongs to the phenothiazine class of drugs and it has been used clinically for a wide range of treatments mainly based on its antisepsis properties. In 1996, MB was identified as an inhibitor of tau aggregation in vitro17,18 and in a subsequent study, it was shown to reduce the levels of a 12 kD fragment of tau that is thought to represent the core of paired helical filaments in neurofibrillary tangles in a mouse model overexpressing this fragment.19 MB has also been shown to reduce Aβ oligomer levels20 and reduce amyloid deposits in a transgenic mouse model with plaques and tangles.21 MB was recently tested in a Phase II clinical trial for AD under the trade name Rember.22,23
The mechanism by which MB acts on tau in vitro and in vivo is not clear, and it may depend on the active concentration. In vitro, incubation with micromolar concentrations of MB reduces aggregated tau directly by preventing tau-tau binding.17,18 Recent studies demonstrated that MB at high doses modulates proteasomal degradation via effects on Hsp70 activity which was shown to correlate with reduced tau levels in cells and transgenic animals.24,25 Wang et al.26 observed changes in LC3-II levels in MB treated cells. Another group found effects of MB on Aβ but they did not observe any changes in tau or evidence of macroautophagy induction.21 In these experiments, two different dosing methods were utilized, with MB either dissolved in water,21 or added as a powder to chow.22 At very low concentrations (70 μg/kg), MB is a potent antioxidant that impacts mitochondrial function.27-29 However, changes in mitochondrial activity have not been observed in other studies.21 We demonstrate here that MB is capable of inducing autophagy in primary neurons, organotypic slice cultures and transgenic animals over a wide range of doses via effects on the mTOR signaling pathway, and this represents a novel mechanism by which MB modulates the levels of tau.
Results
Methylene blue treatment modulates tau forms in ex vivo slice cultures
Organotypic slice cultures from postnatal day 10 tau transgenic mice (n = 6 per group) were treated with 0.02 μM MB or DMSO vehicle (0.008% DMSO) for 5 d. Following treatment, slices were collected and processed. Total and aggregated tau fractions were isolated and assessed by immunoblotting with an antibody recognizing all human tau (CP27) (Fig. 1A). In treated slices, total tau levels remained unchanged (98.83 ± 1.58% control). However, incubation with nanomolar concentrations of MB led to a significant decrease in the level of sarkosyl insoluble (aggregated) tau (87.2 ± 0.94% control values). To assay whether MB is capable of clearing phosphorylated tau, the total protein fraction was assessed by immunoblotting with antibodies recognizing tau phosphorylated at epitopes ser199, ser262 ser422 and ser396/404 (PHF-1 antibody) (Fig. 1A). These epitopes were chosen due to their association with tau polymerization and disease. With 0.02 μM MB treatment, a significant reduction (p < 0.05 for all) in tau ser199 (85.6 ± 1.7% control), ser262 (83.58 ± 3.4%) ser422 (76.9 ± 4.14%) and ser396/404 (79.1 ± 1.2%) (all normalized to total tau) was observed (Fig. 1B).
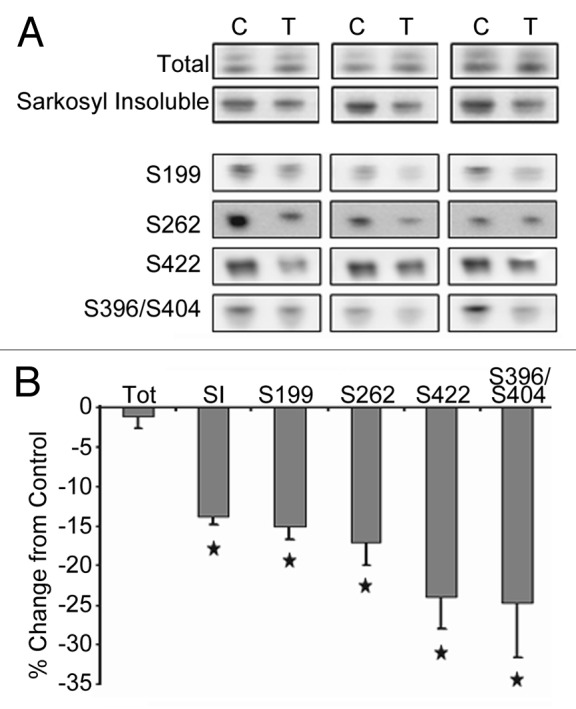
Figure 1. MB treatment reduces tau forms in organotypic slice cultures. Slice cultures from JNPL3 mice (n = 6 mice per condition, three mice shown) were treated with either DMSO vehicle (C, control) or 0.02 μM MB (T, treated). (A) shows the results of immunoblotting with an antibody recognizing human tau (CP27) on the total and sarkosyl insoluble, aggregated tau fractions. The total protein fraction was also assayed for levels of tau phosphorylated at epitopes ser199, ser262, ser422, and ser396/404. Images were quantified and the chemiluminescence signal from MB treated hemibrain slices was expressed as percentage of signal from control treated hemibrain from the same animal (signal ± SE) (B). Total tau levels were unchanged with MB treatment. MB significantly reduced (p < 0.05) the level of sarkosyl insoluble, aggregated tau. Significant reduction was seen in tau hyperphosphorylated at ser199, ser262, ser422 and ser396/404 (phospho-tau epitope normalized to total tau). *p < 0.05.
Methylene blue modulates autophagy in ex vivo slice cultures
In order to assess the effect of MB on autophagy induction, slice cultures were incubated with 0.02 μM MB or vehicle for 5 d as before. Immunoblots for several markers of autophagy including p62 and cathepsin (cat) D (indicators of turnover), BECN1 and LC3-II (indicators of induction) were assessed (Fig. 2A). p62 is involved in the targeting of ubiquitinated protein to the autophagic vacuoles. Once there, it is degraded and thus stimulation of autophagy will result in a decrease of p62 levels.30,31 Cathepsin D (catD) is one of the major lysosomal proteases responsible for protein degradation. BECN1, also referred to as Atg6, is one component of a large molecular complex required for the initiation of autophagic vesicle formation.32 LC3-I is cleaved by Atg4 and conjugated to phosphatidylethanolamine to form LC3-II,33 resulting in the translocation of LC3-II to the autophagosome membrane. AVs are unique and can be distinguished from other intracellular compartments by the presence of LC3-II. With induction of autophagy or reduction of flux (turnover of AVs through fusion to lysosomes), this marker would be expected to increase. At low doses, treatment with MB led to a significant decrease in p62 levels to 79 ± 1.5% of control (Fig. 2B). CatD signal was increased relative to control slices (122 ± 5.8%) as were BECN1 and LC3-II (131.9 ± 10%, 139.41 ± 10.9% of control respectively). These data indicate that at nanomolar concentrations, MB is capable of inducing autophagy in organotypic brain slices.
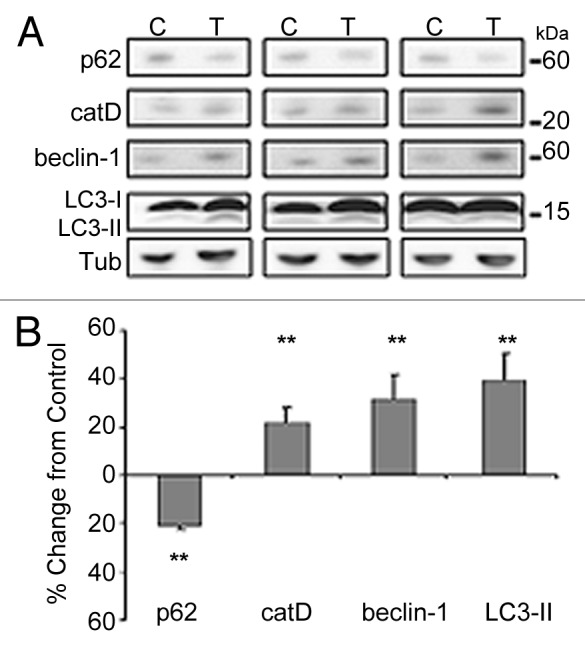
Figure 2. MB treatment modulates autophagy markers in organotypic slice cultures. Samples utilized in Figure 1 were assayed for levels of autophagy markers. (A) shows the results of immunoblotting with antibodies against p62, cathepsin D (catD), BECN1 and LC3. Tubulin (tub) is shown as loading control. (B) shows the results quantified. 0.02 μM MB produced a significant decrease in p62 levels and an increase in catD, BECN1 and LC3-II signal relative to control treated slices **p < 0.01.
Incubation with MB promotes LC3 positive vacuole formation in primary neurons
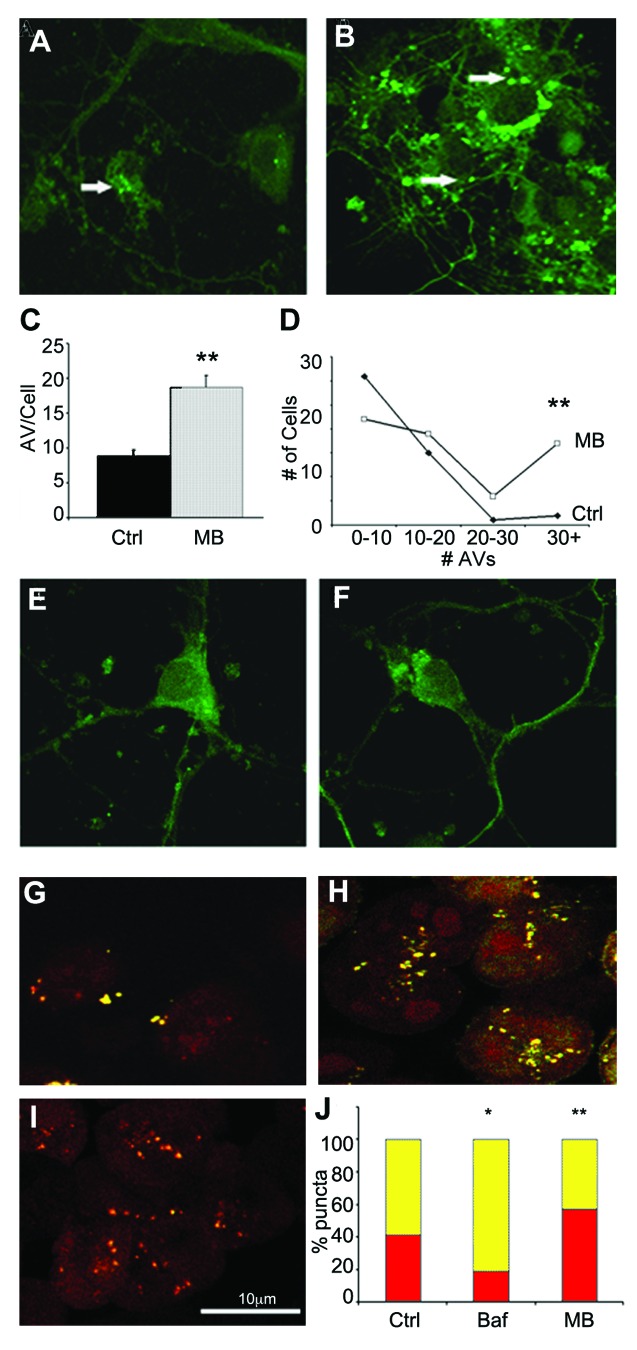
To confirm the effects of MB on autophagic induction, primary neurons cultured from transgenic mice expressing a green fluorescent protein GFP-LC3 fusion protein were incubated for 6 h with either DMSO vehicle (Fig. 3A) or 0.02 μM MB (Fig. 3B) and the number of GFP positive puncta per cell was determined for each condition (n = at least 50 cells per group). The average number of puncta in control cells was calculated as 8.9 ± 0.9, whereas treatment with MB for 6 h resulted in a significant (p < 0.01) increase in the average number of puncta (18.7 ± 1.7) (Fig. 3C) as well as a greater number of AVs per cell (Fig. 3D). These data provide further evidence that MB impacts autophagy. However, both excessive autophagy induction and the blockage of flux (AV turnover) can result in increased numbers of LC3 positive puncta. Both of these can be damaging to cells and it is important to determine whether the effects of MB treatment are reversible. If the vesicle numbers remain heightened after MB has been washed out of the culture, this would indicate impaired flux rather than induction. To test this, cells were incubated with 0.02 μM MB for 6 h. After treatment, the media was replaced and cells were left for an additional 4 h in MB free media. Coverslips were then fixed and counterstained as described. Puncta were counted but no significant difference was found between the two groups (average number of puncta 13.75 ± 0.44 for control and 13.25 ± 0.45 for treated cells) (Fig. 3E and F). This indicates that the stimulation of autophagosome formation produced by MB treatment is reversible and does not result from the buildup of AVs.
Figure 3. MB promotes AV formation and maturation. Primary neuronal cultures from GFP-LC3 mice were exposed to DMSO vehicle (A) or 0.02 μM MB (B) for 6 h. (C) shows quantification of the results. MB treated cells (gray bar) had significantly more puncta compared with vehicle-treated cells (black bar). In addition, the number of puncta per cell was greater following MB treatment (D). An additional group of primary neurons were incubated with 0.02 μM MB or DMSO control for 6 h. Following treatment, media was exchanged and cells were maintained in culture for a further 4 h to allow the MB to wash out. No significant difference was observed in the number of puncta in vehicle treated (E) vs. MB treated (F) cells. CHO cells transfected with a GFP-RFP-LC3 construct were treated with vehicle (G), 1 μM bafilomycin (H) or 0.01 μM MB (I). GFP and RFP images were collected and the percentage of GFP+/RFP+ positive AVs (yellow bars) and RFP+/GFP- positive autophagolysosomes (red bars) per cell were determined (J). MB treated cells had a significantly higher percentage of RFP+/GFP- puncta relative to control. Bafilomycin A1 treated cells in contrast had a significantly lower percentage of RFP only puncta *p < 0.05, **p < 0.01.
To further demonstrate that the increase in GFP positive puncta is not the result of reduced turnover of AVs, a second cell culture system was utilized. Tau-expressing CHO cells were transfected with an RFP-GFP-LC3 construct in which the GFP tag, but not the RFP tag is pH sensitive allowing for discrimination of autophagosomes (AVs) from autolysosomes. In nascent AVs expressing the LC3 construct, merging of the GFP and RFP fluorescence signals generates a yellow signal. As the AV fuses with the lysosome and becomes acidified, the GFP signal is quenched resulting in the autolysosomes fluorescing red only. Thus, when autophagic flux is blocked, there is a relative increase in the number of puncta fluorescing red alone, compared with yellow. RFP-GFP-LC3 transfected cells were treated with DMSO vehicle, 1 μM bafilomycin A1 (as a control, to decrease autophagic flux) or 0.01 μM MB (Figs. 3G–I). The total number of puncta per cell was counted in vehicle treated (Fig. 3G), bafilomycin A1 (Fig. 3H), or MB treated cells (Fig. 3I) and the percent of total that were yellow (RFP+/GFP+) vs. red (RFP+/GFP-) was determined (Fig. 3J). As expected, bafilomycin A1 treated cells had significantly increased numbers of AVs, but the number of yellow puncta relative to red (45.4 ± 3.31 vehicle, 18.8 ± 3.65, p < 0.001) was significantly increased demonstrating impaired flux. Incubation with MB significantly increased the number of AVs relative to control, and increased the percentage of puncta that were red (45.4 ± 3.31 vehicle, 58.7 ± 5.55 MB, p < 0.05). These data demonstrate that MB induces the formation of AVs, and that the AVs undergo flux. To demonstrate that abnormal tau is present in AVs, primary neuronal cultures from GFP-LC3 mice were incubated for 18 h with aggregated, sarkosyl-insoluble tau derived from brain extract from a tau transgenic mouse line (Fig. 4). Cells were then fixed and stained with a fluorescently tagged antibody against total human tau (CP27) (red, Fig. 4B). While much of the tau remains bound on the outside of the cell, some is internalized (data not shown). Confocal microscopy demonstrated that a proportion of GFP-tagged AVs (green, Fig. 4A) colocalized with tau aggregates (Fig. 4C and D) supporting the idea that abnormal tau can be cleared via macroautophagy.
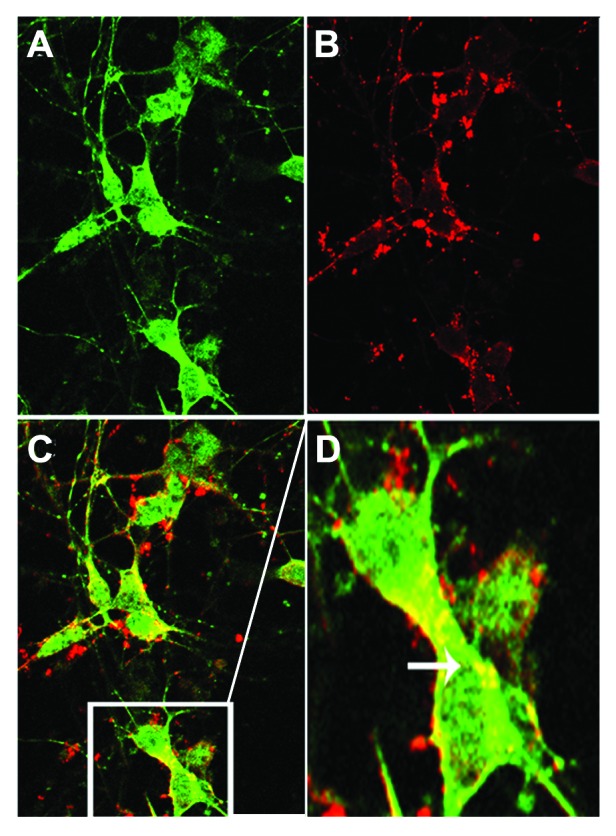
Figure 4. Tau colocalizes with AVs. Primary neuronal cultures from GFP-LC3 mice were incubated with aggregated human tau for 18 h prior to fixation and labeling with fluorescently tagged antibody CP27 (human tau). (A) shows a confocal slice at 0.3 μm planar resolution indicating the green immunofluorescence signal from GFP-LC3; (B) indicates the red immunofluorescence signal from human tau aggregates. (C) shows the merged images (yellow) indicating that tau can colocalize with autophagic vacuoles, illustrated in the enlarged inset shown in (D). Human tau in AVs is indicated by the arrow.
Blocking autophagy abrogates the effect of MB on tau
Methylene blue has been shown to affect several different targets within the cell including mitochondria, the proteasome and tau filaments. Therefore, it is possible that MB’s effect on autophagy and tau levels was unrelated. To test this, autophagy induction in CHO cells expressing human tau was attenuated through genetic knockdown of BECN1. Cells (n = 6 wells per group) were incubated for 2 d with BECN1 shRNA expressing lentivirus, or control virus. Cells were then treated with vehicle or 0.01 μM MB for 6 h, collected and processed as described. Immunoblotting for BECN1 confirmed that in shRNA expressing cells, the protein had been significantly attenuated and LC3-II levels were significantly decreased indicating that autophagy induction was attenuated compared with control virus cells (Fig. 5A). GAPDH levels were also decreased in cells with attenuated BECN1 suggesting a slight toxicity associated with attenuation of this protein. All results were therefore normalized to GAPDH levels. GAPDH levels were partially restored with MB treatment indicating an overall protective effect of the compound. In the control virus group, MB treatment led to a significant decrease in total tau levels (Fig. 5B). In contrast, MB did not reduce tau levels in cells with attenuated BECN1 and led to a slight increase relative to cells treated with control virus which may also reflect the protective effects of MB on cells (Fig. 5C). Overall, these data indicate that autophagy induced by MB plays a significant role in controlling tau levels.
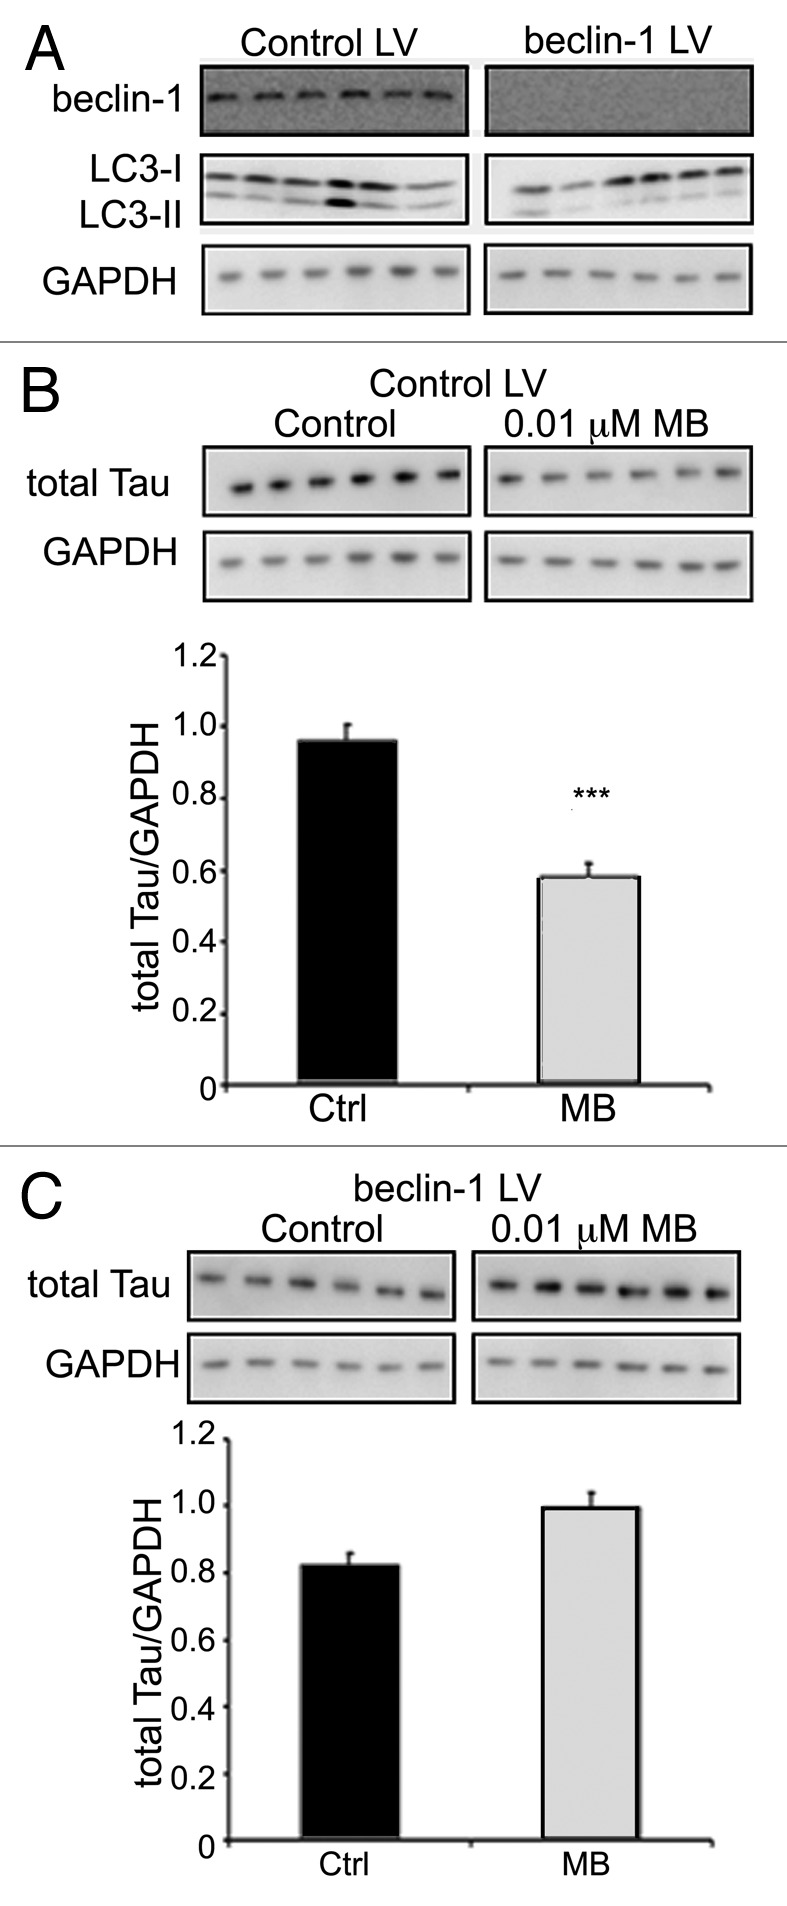
Figure 5. BECN1 knockdown eliminates the effects of MB on tau. CHO cells expressing the BECN1 shRNA lentivirus (BECN1 LV), or control lentivirus (control LV) were treated with either vehicle (control) or MB for 6 h. BECN1 shRNA-expressing cells showed a significant decrease in BECN1 levels, and LC3-II (A) compared with cells expressing the control lentivirus. In cells expressing control virus, MB treatment resulted in a significant reduction in the level of tau (p < 0.001) (B). In contrast, cells in which BECN1 had been attenuated did not show reduced tau with MB treatment (C).
Methylene blue induces autophagic signaling in tau expressing cells
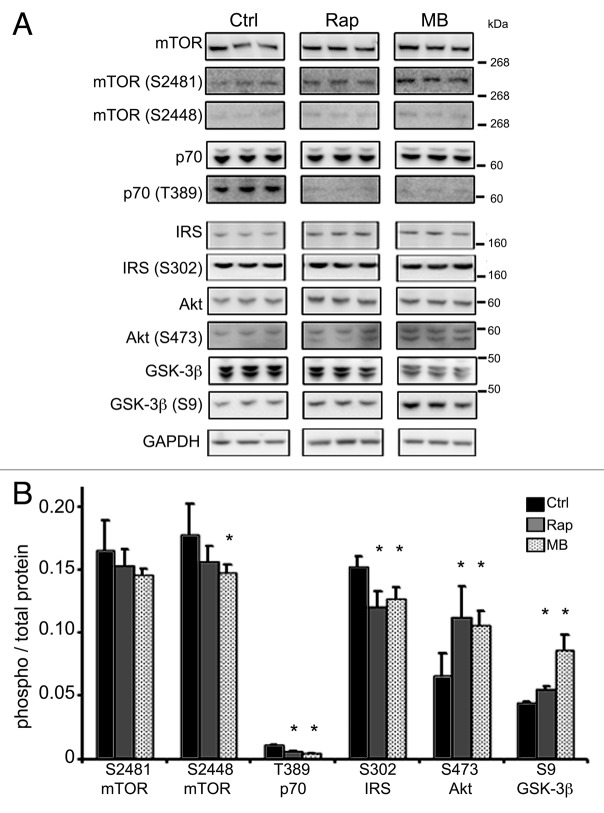
The tau-expressing CHO cells were used to further explore autophagic signaling events induced by MB. MB (0.01 μM) or vehicle was added to the cells for 6 h (Fig. 6) or 18 h (data not shown). At 6 h, the total level of p62 was unchanged, but it was reduced at 18 h (data not shown). As with the slices, at both timepoints, MB exposure led to a significant increase in the level of BECN1 (2.23 ± 0.07 control and 2.97 ± 0.16 treated) and LC3-II (0.934 ± 0.09 control, 1.33 ± 0.04 treated) and a significant decrease in the level of total tau (3.36 ± 0.11 control, 2.81 ± 0.11 treated). Key kinases involved in autophagy induction were then examined in the cell system, and rapamycin was used as a comparator to test whether MB induces autophagy in a similar way (Fig. 7A). Incubation with MB led to a significant reduction in phosphorylation (relative to total kinase level) for mTOR ser2448 (0.177 ± 0.02 control vs. 0.147 ± 0.006 treated) which is an indirect target for Akt via its effects on PRAS40.34 Rapamycin produced a trend toward reduced mTOR ser2448 (0.156 ± 0.01). Both compounds significantly reduced phosphorylation at p70S6 kinase (p70) thr389 (0.011 ± 0.0004 control vs. 0.006 ± 0.0004 rapamycin or 0.004 ± 0.0004 MB treated) and IRS ser302 (0.152 ± 0.007 control vs. 0.12 ± 0.01 rapamycin and 0.127 ± 0.008 MB treated) which is consistent with autophagy induction. Surprisingly, given the decrease in phospho-mTOR, a significant increase was seen for Akt ser473 (0.065 ± 0.01 control vs. 0.11 ± 0.02 rapamycin and 0.105 ± 0.01 MB treated). Because GSK-3β is a target for Akt, we assayed for levels of total GSK-3β and GSK-3β phosphorylated at the activation site, ser9. Both drugs led to a significant increase in GSK-3β ser9 (0.04 ± 0.001 control, 0.05 ± 0.002 rapamycin, 0.08 ± 0.004 MB) (Fig. 7B). These data provide further support for MB acting as an inducer of autophagy and suggest the mechanism is similar to rapamycin. There were however some differences between rapamycin and MB as the timecourse for reduction of tau levels was 6 h for MB, whereas for rapamycin it was 18 h (data not shown).
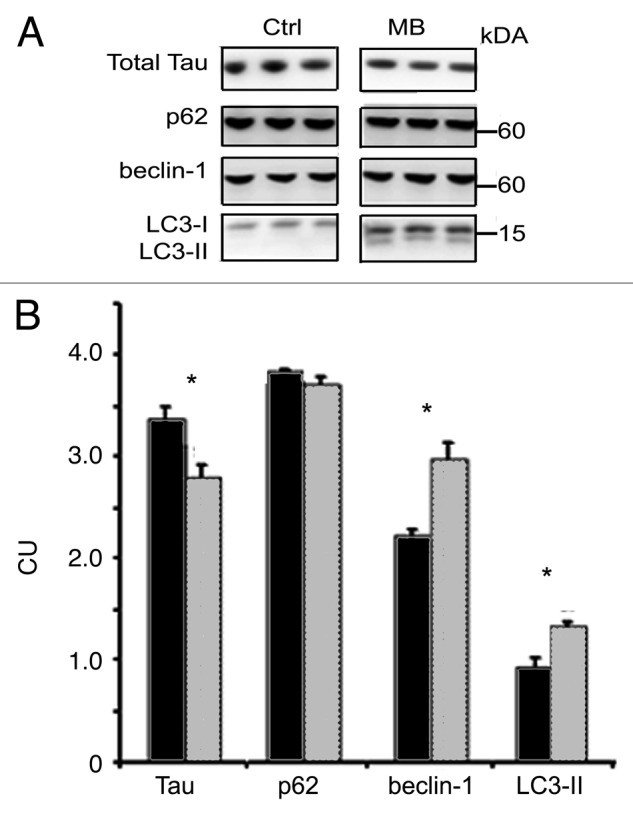
Figure 6. MB induces autophagy in CHO cells. Tau-transfected CHO cells were incubated for 6 h with vehicle or 0.01 μM MB (n = 6 per treatment). (A) shows immunoblots probed with antibodies against total tau, p62, BECN1 and LC3. (B) shows quantification of the immunoblots. Cells treated with MB (gray bars) had significantly reduced tau levels compared with vehicle-treated (black bars) cells, while the levels of BECN1 and LC3-II were increased. No effect on p62 levels was seen at this time point. All bars represent average ± SE, *p < 0.05.
Figure 7.
Kinase phosphorylation is altered with MB treatment. CHO cells treated with MB or rapamycin, a known autophagy inducer, were immunoblotted for kinase phosphorylation to assess activation status. To test whether MB acted in a similar way to rapamycin, cells were incubated with vehicle, rapamycin or MB for 6 h. (A) shows immunoblots for antibodies listed. (B) shows the quantification. The ratio between phosphorylated kinase at a relevant epitope and total kinase was determined in control (black bars), rapamycin (gray bars) and MB (hashed bars). MB significantly reduced levels of phospho-mTOR ser2448. Rapamycin also reduced levels of phospho-mTOR ser2448. Both rapamycin and MB reduced levels of phospho-p70 thr389 and phospho-IRS ser302. Rapamycin and MB also produced a significant increase in phospho-Akt ser473 and phospho-GSK-3β ser9. All bars represent average values and error bars SEM, *p < 0.05.
Treatment with MB alters tau levels in transgenic mice
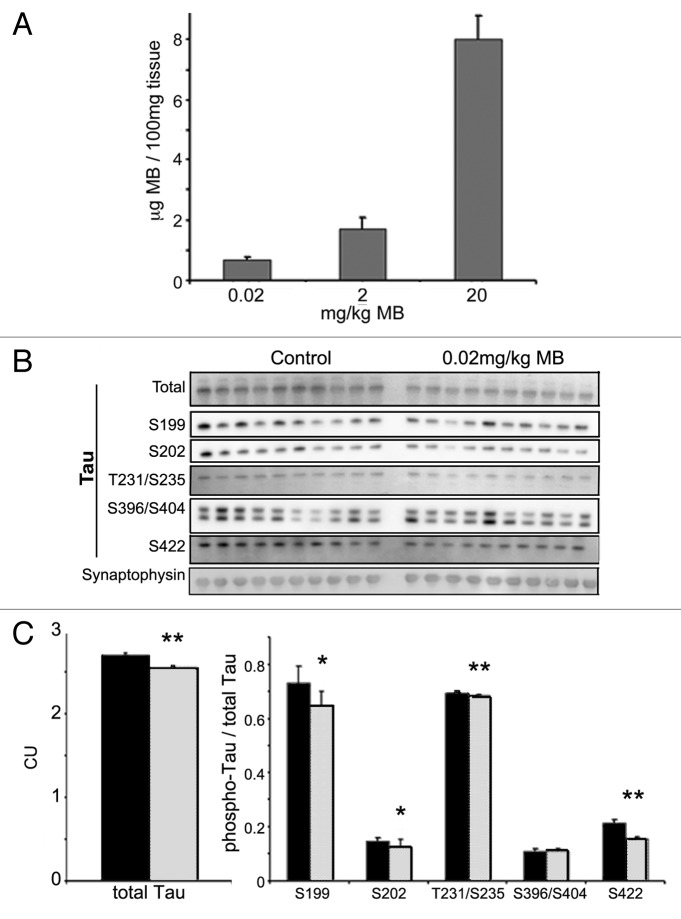
In order to determine whether the results obtained in ex vivo brain slices were recapitulated in live animals, male JNPL3 mice (n = 10 per group, homozygous, Swiss Webster strain) were treated by daily oral gavage with 0.02 mg/kg MB or water vehicle for two weeks. To determine whether this protocol resulted in significant accumulation of MB in the brain, we homogenized brain tissue samples from these animals and quantified the drug levels by liquid chromatography mass spectrometry (LC–MS/MS) (Fig. 8A), as previously described in reference 25. These studies showed that the average concentration of MB in the 0.02 mg/kg treated group was 0.7 μg/100 mg of tissue. Animals administered 2 and 20 mg/kg had average brain concentrations of 1.7 ± 0.37 and 7.9 ± 0.79 respectively, confirming that MB had entered the brain. Next, we performed immunoblotting for total human tau using the total and sarkosyl insoluble (aggregated) tau fractions. Signal was quantified and the average per group was determined (Fig. 8B). There was a significant reduction in the levels of total tau in MB treated animals (2.7 ± 0.002 for control animals, 2.5 ± 0.001 for treated) (p < 0.01). However, the levels of sarkosyl insoluble tau were unchanged (data not shown). Additional groups of mice were treated with either 2 or 20 mg/kg MB (data not shown). Treatment with 2 mg/kg MB resulted in a significant decrease in the levels of total tau, but none of the doses used resulted in significant changes in sarkosyl insoluble tau levels. Thus effects on tau were consistent between the ex vivo cultures and live animals but the effects on insoluble tau aggregates were not recapitulated, possibly due to differences in bioavailability, and/or variability between mice in the in vivo study.
Figure 8. MB concentrates in the brain and reduces tau levels in treated mice. Cerebella were collected from MB and vehicle-treated animals and were subjected to LC–MS analysis (A). Animals given 0.02 mg/kg MB per day had an average 0.7 ± 0.1 μg MB per 100 mg of tissue. Mice in the 2 and 20 mg/kg per day groups had an average brain concentration of 1.73 ± 0.3 and 7.99 ± 0.78, respectively. All bars represent average values and error bars SEM. Male JNPL3 mice (n = 10 per group) were given 0.02mg/kg/day MB or water vehicle by daily oral gavage for two weeks. Brains were collected and fractionated to produce total, and sarkosyl insoluble (aggregated) tau. (B) shows immunoblots from these fractions probed for total tau and the following phosphorylated tau epitopes—ser199, ser202, thr231/ser235, ser396/404 and ser422. (C) shows the chemiluminescence signal (CU) quantified and expressed as the average per group ± SE. MB (gray bar) treatment resulted in lower total tau compare with control (black bar) (**p < 0.01). No significant change was observed in the levels of sarkosyl insoluble tau (data not shown). MB treatment led to a significant decrease in the levels of tau phosphorylated at ser199, ser202, thr231/ser235, and ser422 (*p < 0.05, **p < 0.01). Levels were normalized to total tau and expressed as an average ± SE.
MB treatment reduces phospho-tau levels
Similar to results obtained in slices, treatment with MB led to a significant decrease in the level of tau phosphorylated at disease relevant epitopes (Fig. 8C). To control for changes in tau levels, the ratio between phospho-tau and total tau was determined for each sample. A significant reduction in tau phospho-ser199 (0.73 ± 0.18 control, 0.64 ± 0.05 treated), ser202 (CP13) (0.14 ± 0.03 control, 0.12 ± 0.006 treated), thr231/ser235 (AT180) (0.69 ± 0.03 control, 0.68 ± 0.003 treated) and ser422 (0.21 ± 0.01, 0.15 ± 0.006) was observed (p < 0.05 for all epitopes). No significant change in ser396/404 (PHF-1) was detected. Synaptophysin was utilized as a loading control but the levels were not significantly different between samples so results were not normalized to the loading control. Treatment with 2 mg/kg MB also resulted in a significant decrease in each of the phospho-epitopes examined (data not shown). Similar results were obtained with 20 mg/kg MB treatment with the exception of ser199 which was not changed in the highest dose group (data not shown). Interestingly, MB produced very dramatic dose dependent changes in the level of tau phosphorylated at the CP13 (ser202) epitope. Treatment with 0.02 and 2 mg/kg doses led to a significant reduction in the CP13 epitope, and 20 mg/kg resulted in an almost complete loss of signal (data not shown). The reason for the differential effect on certain tau phospho-epitopes, and the impact of dose is currently unknown.
Autophagy markers are altered with MB treatment
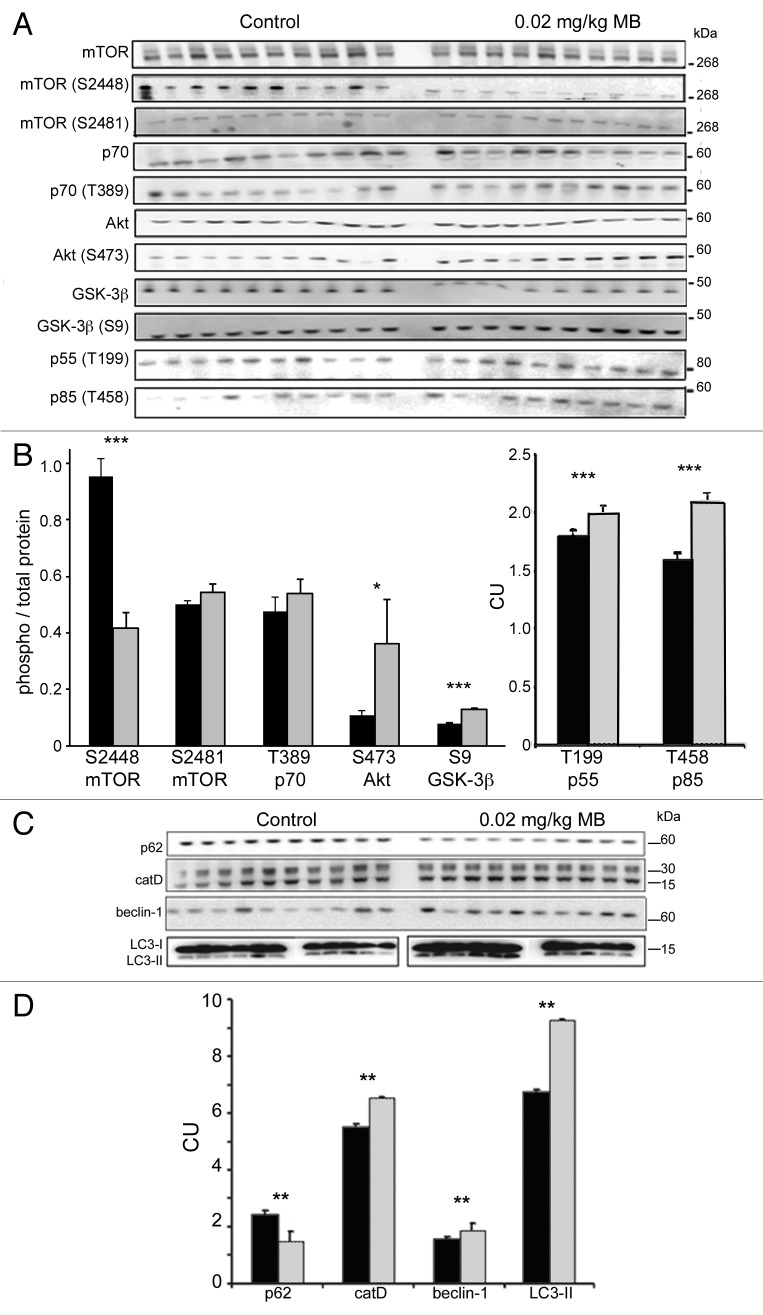
The levels of kinases in the mTOR dependent autophagy pathway were analyzed (Fig. 9A and B). As with the cells, dissociation between Akt activation status and mTOR activation status was observed. In MB treated animals, the phosphorylation status of a target on mTOR (mTOR ser2448/ total mTOR) linked to Akt activity was significantly reduced (0.41 ± 0.05 control, 0.95 ± 0.06 treated). The ratio of phospho-mTOR ser2481 and phospho-p70 thr389 (to total protein) was also determined but no significant change was observed (0.50 ± 0.01 control, 0.54 ± 0.03 treated; and 0.47 ± 0.05 control, 0.53 ± 0.05 treated, respectively). As seen in the cells, Akt was significantly hyperphosphorylated at ser473 site ( 0.11 ± 0.01 control, 0.36 ± 0.16 treated) suggesting increased activity which was supported by increased phosphorylation at thr199 (1.82 ± 0.07 control, 2.02 ± 0.07 treated) and thr458 (1.69 ± 0.05 control, 2.1 ± 0.05 treated) of the p55 and p85 regulatory subunits of PI3 kinase CI respectively, a kinase that phosphorylates (and activates) Akt. In the mice, the phosphorylation status of the mTOR substrate p70 thr389 was unchanged—this was different from the cells which showed a significant decrease at this epitope within 6 h (Fig. 7B). However, in the cells, we observed that the effect of MB on p70 phosphorylation at thr389 was time dependent and relatively acute (data not shown), and it is likely that the chronic exposure in the brain of the animals resulted in an attenuated change at this epitope, so monitoring mTOR activity via phosphorylation status of this substrate was not reliable.
Figure 9.
MB alters kinase activity and biomarkers of autophagy and lysosomes. Similar to the cell study shown in Figure 7, levels of total and phosphorylated epitopes of mTOR, p70S6K, Akt and GSK-3β were determined by immunoblotting (A). The ratio between the corresponding phosphorylated epitope and total kinase was determined, for vehicle (black bars) and MB treated (gray bars) animals (B). MB treatment results in a significant reduction of the phospho-mTOR ser2448 to mTOR ratio. The ratio of phospho-mTOR ser2481 and phospho-p70 thr389 (to total protein) unchanged. The ratio of phospho-Akt ser473 and phospho-GSK-3β ser9 (to total protein) was significantly increased with MB treatment. Levels of p55 thr199 and p85 thr458, regulatory subunits of PI3 kinase C1 were also significantly increased relative to control levels. (C) shows immunoblots prepared from JNPL3 mice probed for autophagy markers p62, cathepsin D, BECN1 and LC3. (D) shows quantification of the immunoblots. Treatment with 0.02 mg/kg MB (gray bars) led to a significant change in several markers of autophagy relative to vehicle-treated animals (black bars) including p62, BECN1 and cathepsin D. LC3-II levels were significantly increased in MB treated animals relative to vehicle. For all, control and MB treated samples were run on the same blot. LC3-II samples were run on smaller gels but loading order is the same. Significance levels indicated by *p < 0.05, **p < 0.01, ***p < 0.001.
Total GSK-3 levels were significantly decreased (3.36 ± 0.07 control, 2.75 ± 0.01 treated) following MB treatment. However, the level of GSK-3β ser9 was significantly increased relative to control animals (2.91 ± 0.05 control, 3.62 ± 0.12 treated; p < 0.01). The ratio of GSK phosphorylated at ser9 (to total protein) was 0.08 ± 0.001 control, 0.13 ± 0.003 treated. As GSK-3 is phosphorylated at the ser9 epitope by Akt, the increase in signal was not unexpected.
Mice treated with 0.02 mg/kg MB showed significant (p < 0.01) changes in several autophagy markers including p62 (2.47 ± 0.09 vs. 1.51 ± 0.36), catD (5.51 ± 0.12 control, 6.52 ± 0.05 treated), BECN1 (1.59 ± 0.09 control, 1.88 ± 0.24 treated), and LC3-II (6.78 ± 0.05 control, 9.25 ± 0.07 treated) (Fig. 9C and D). Higher doses of MB produced similar results with both 2 and 20 mg/kg treated animals showing significant increases in BECN 1, LC3-II and catD levels and in a limited study, alteration in the level of some of the phospho-epitopes of Akt and mTOR (data not shown).
Discussion
Early reports of MB’s impact on tau suggest that the compound is capable of directly inhibiting the growth of tau polymers.17,18 Recent data show that MB is capable of modulating tau levels through additional mechanisms such as inhibition of Hsp70 ATPase activity24 and our findings suggest that another mechanism by which MB reduces tau levels is through the induction of autophagy as we have observed altered markers of autophagic clearance in cells, primary neurons, organotypic slice cultures and mice treated with nanomolar levels of MB.
Our studies have shown that chronic organotypic slice cultures prepared from tau transgenic mice, incubated with nanomolar concentrations of MB have decreased levels of hyperphosphorylated soluble tau and insoluble, aggregated tau. Concurrently, decreased levels of p62 and increased levels of catD, BECN1 and LC3-II were seen relative to vehicle-treated hemi-brains from the same mice. Similar results were seen in vivo as oral treatment of tau transgenic mice with MB at multiple doses over the course of two weeks led to a significant reduction in hyperphosphorylated soluble tau levels, and significantly reduced levels of p62, with increased levels of catD, BECN1 and LC3-II. The results in vivo did not fully replicate the organotypic slice data as insoluble tau levels were not significantly changed in the live mice for reasons possibly related to insufficient brain concentrations of MB, or inter-mouse variability. In addition, there was a difference in the effect on total tau levels (unchanged in slices, decreased in vivo) and some of the phospho-tau epitopes (such as PHF-1) that could reflect the model systems or exposure to drug. However, the induction of autophagy was consistent in all systems tested, including CHO cells and primary neurons.
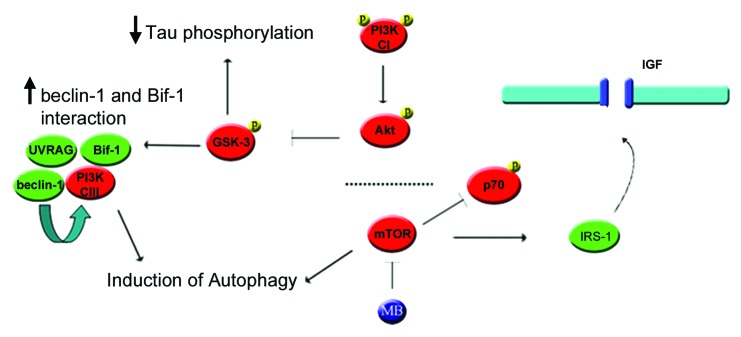
One of the key features of autophagy is the formation of double-membrane bound vesicles, called autophagosomes or autophagic vesicles (AVs) that fuse with lysosomes during flux leading to degradation of the contents. Induction of AV formation and flux is a complex series of events that can be triggered either through suppression of mTOR activity, or independent of mTOR. mTOR activation (autophagy suppression) can occur via IGF signaling in a pathway that includes Akt and PI3 kinase CI. Typically, increased phosphorylation and hence activity of Akt in turn leads to increased phosphorylation and activity of mTOR, which in turn suppresses autophagy. However, transgenic animals treated with MB showed a marked increase in phosphorylated Akt but a decrease in one of the phosphorylation sites of mTOR (ser2448) that is an (indirect) Akt target.34 Although the events occurring between Akt and mTOR are not clear, similar results have been shown with rapamycin. Rapamycin treatment increases PI3 kinase C1 activity which increases Akt activity (with some groups reporting increased phosphorylation at ser308, others at both ser308 and ser47335), which inhibits GSK-3 activity though phosphorylation of the inhibitory site at ser9,36 but increased Akt activity following rapamycin exposure suppresses the activity of mTOR and thus induces autophagy. It was found that this effect was mediated through the insulin receptor substrate (IRS).36 IRS is a target of mTOR and thus reduction of mTOR activity prevents IRS degradation. Preventing IRS degradation results in increased IGF receptor signaling and thus greater phosphorylation of Akt and GSK-3β ser9. A mechanism similar to rapamycin by which MB could stimulate autophagy is presented in Figure 10. In cells, both rapamycin and MB reduced mTOR phosphorylated at ser2448 and reduced phosphorylation of the mTOR target p70 at thr389 indicating reduced activity of the kinase. Further downstream effects on IRS and Akt phosphorylation, and conversion of LC3 were also observed with both drugs. However, it appears that the two drugs have a somewhat different timecourse with regards to effects on tau, with rapamycin requiring longer incubation for significant tau clearance (data not shown). In addition to mTOR mediated effects on autophagy, effects mediated by GSK-3 may also have played a role as inhibition of GSK-3 activity due to increased activity of Akt has been shown to stimulate AV nucleation by promoting interaction between Bax-inducing factor 1 (SH3GLB1/Bif-1) and BECN1 Atg637,38 in a large protein complex.32,38 Furthermore, because GSK-3 is one of the major kinases involved in tau phosphorylation, decreased GSK-3 activity may have led directly to lower levels of phospho-tau.
Figure 10. Proposed mechanism by which MB could stimulate autophagy through mTOR and Akt. (1) Inhibition of mTOR induces autophagy directly but also reduces phosphorylation of IRS1. (2) Dephosphorylation of IRS-1 results in decreased degradation and increased binding to the IGF receptor, increasing the receptor’s basal activity level. (3) Higher basal IGF receptor activity leads to increased phosphorylation of the PIK3R3/p55 and PIK3R1/p85 regulatory subunits of PtdIns 3-kinase (CI), thus increasing its activity. (4) PI3 kinase (CI) phosphorylates Akt. This in turn phosphorylates GSK-3 at the inhibitory site, lowering its activity. (5) In addition, reduced GSK-3 activity can lead to increased Bif-1 interaction with BECN1. (6) The SH3GLB1-BECN1 complex activates PtdIns 3-kinase (CIII) through UVRAG, stimulating autophagy.
Two other studies have examined the effect of small molecules based on the phenothiazine scaffold, similar to MB, on autophagy induction.39,40 These studies also demonstrated autophagy induction, however, they found no change in the phosphorylation status of either mTOR or p70, suggesting an mTOR-independent mechanism. Our data show that detecting changes in phosphorylation of target proteins such as p70 is highly time dependent. For example, in CHO cells, reduction in pp70 was seen at 6 h, but not at three or 18 h (data not shown). Detection can also be affected by model system used. In transgenic animals, MB produced a significant reduction in mTOR phosphorylated at ser2448, but changes in pp70 status were not detected. In addition to differences in the experimental design, the small molecules utilized in these studies contain large meso substituents not present in MB that may affect their function.
An additional mechanism by which MB could potentially affect autophagy is through interaction with heat shock proteins. Jinwal et al. (2009)24 and Wang et al. (2010)21 demonstrated that MB is an inhibitor of Hsp70 ATPase activity. Reduction in Hsp70 activity resulted in a decrease in the levels of total and phosphorylated tau. The authors hypothesized that Hsp70 plays a protective role, preventing the degradation of the tau protein. Interfering with the tau-Hsp70 interaction could therefore allow tau to be cleared. Further, Hsp70 binding proteins have been shown to alter LC3-II levels in cells, indicating that modulation of Hsp activity has an effect on protein degradation systems. In addition, Hsp and Hsc70 are involved in chaperone-mediated autophagy (CMA), an alternative protein degradation pathway, and inhibition of CMA can increase autophagy.41 Jinwal et al. (2009)24 reported that MB inhibits Hsp70 activity with an EC50 of ~80 μM but the lowest dose used in this study was 5–10 fold below the lowest dose used in Wang et al. (2010).21 Even given the accumulation of MB in brain tissue, it is unlikely that the lowest doses of MB used in our study were sufficient to alter the ATPase activity of Hsp70. However, in the transgenic animals given the highest dose (20 mg/kg) it is possible that several mechanisms were altered.
In contrast to our results, one study demonstrated that MB administered to mice over a similar dose range had no effect on tau levels or autophagy induction markers such as LC3-II.21 In this case, the route of administration differed from ours—MB was added to food powder rather than by oral gavage which may have had a significant effect on bioavailability and levels in the brain which could account for the difference in outcomes. In general, these contradictory findings highlight the importance of dosing and methodology when evaluating drug efficacy.
As the tau protein is abnormal in several major neurodegenerative diseases, it represents an attractive target for disease-modifying therapy. Methylene blue has been shown to reduce tau, improve cognition and attenuate neurodegeneration in a tau transgenic line25 suggesting that in addition to its effects on the levels of disease-associated proteins, it can impact important functional outcomes. We have also observed an improvement in cognitive performance after administration of MB, in the same tau transgenic mouse line published25 (see Supplementary Data). MB has also been shown to be neuroprotective in other animal models of degeneration. Amounts as low as 70 μg/kg have been shown to reduce lesion size and neurotoxicity in a rat model of stroke28,42 and neuroprotective effects were also seen in an animal encephalopathy model.43 Our data provide further in vivo support for the use of MB to protect against disease, and suggest that autophagy modulation is a valid avenue for drug development for tauopathies.
Materials and Methods
Animals
Mice from the JNPL344 line express the longest human tau isoform containing the P301L mutation under the control of the mouse prion promoter. The line used differs from the original line in that it is homozygous and on a Swiss Webster background. The line shows less variability than other JNPL3 lines available, and a faster timecourse for pathology development, with males developing mature tangles primarily in the hindbrain and spinal cord by 12 mo of age and females developing pathology by 4–6 mo of age. Pathology correlates with progressive motor impairments and death, as published. Low levels of insoluble, hyperphosphorylated tau are found in the cortex and hippocampus from a young age in both males and females. Animals of both genders were utilized at postnatal day 10 for the generation of organotypic slices. For primary culture experiments of autophagy induction in mice expressing GFP-conjugated LC3,45 pups of either sex were utilized at postnatal day 1. All animals were given free access to food and water.
Antibodies
Monoclonal antibodies against total human tau (CP27), tau phospho-ser396/404 (PHF-1) or phospho-ser202 (CP13) were gifts from Dr. Peter Davies. Antibodies against tau phospho-ser262, phospho-ser199 and phospho-ser422 were purchased from Life Technologies (44750G, 44734G and 44764G, respectively). Antibodies against p70, phospho-p70 thr389, Akt, phospho-Akt ser473, mTOR and phospho-mTOR ser2448 or ser2481, GSK-3β and phospho-GSK-3β ser9 were purchased from Cell Signaling Technology (9202, 9234, 9272, 9271, 2972, 2971, 2974, 9315, 9336, respectively). Monoclonal anti-α-tubulin (T6074) or β-actin (A2228) antibodies used as loading controls were purchased from Sigma. Anti-BECN1 antibody was obtained from BD Transduction (612113). LC3 antibody was purchased from Novus Biologicals (NB600-1384), cathepsin D from Scripps (C2414), and p62 antibody from Abnova (H0000878-001). Secondaries were from Jackson Immunoresearch (anti-mouse, 115-035-003). Superblock/TBS diluent was from Fisher (PI37535).
Organotypic slice cultures
Slice cultures were prepared using methods modified from Duff et al.46 Brains from homozygous JNPL3 pups were harvested at postnatal day 10. Cerebellum and brainstem were removed and hemispheres (cortex/hippocampus) were sectioned into 400 μm thick slices which were then separated in ice cold buffer. Slices were transferred to six well plates containing 0.4 μm pore membrane inserts. Sections from each hemibrain are plated in the same row, thus providing two complete hemispheres and allowing each mouse to serve as its own control. Slices were maintained in culture for 14 d in media containing 25% serum with media exchanged every 2 d. After the incubation period, each hemibrain was treated for 5 d with either 0.02 μM MB (Sigma, 9140) or DMSO (Sigma, D2650) vehicle (final concentration of DMSO in media 0.008%) n = six mice per group. Following treatment, slices from each hemibrain were pooled together for analysis.
Primary neuronal cultures
Briefly, flamed 18 mm coverslips were incubated with poly-l-lysine for 12 h in 12 well culture plates. GFP-LC3 mice45 were killed on postnatal day 1 via decapitation and the brains were removed. Cortex and hippocampus were retained and the meninges were removed. Brains were washed five times in modified Hank’s balanced salt solution (HBSS) containing 1M HEPES and penicillin/streptomycin, (Life Technologies, 14025-134 and 15140122). Following the wash, brains were incubated with trypsin for 30 min at 37°C. Trypsin was neutralized with an equivalent volume of MEM (Life Technologies, 0820234DJ) and 2.5 mg/ml DNase was added. Brains were incubated with DNase (Life Technologies, 18047019) for one minute followed by an additional five washes with HBSS. Neurons were dissociated with a half bore Pasteur pipette and centrifuged at 800 rpm. Cells were resuspended in plating media (MEM containing 20% glucose, 10% bovine growth serum, 1% Glutamax (Life Technologies, 35050061), MEM (Life Technologies, 11120-052) and penicillin/streptomycin). Cells were incubated with plating media for 24 h. After 24 h neuronal primary culture media (Neurobasal A Life Technologies, 12349015) containing 2% B27 (Life Technologies, 17504044) and 0.25% Glutamax) was added with half of the media exchanged every 2 d. Cells were allowed to differentiate for two weeks prior to treatment. Cells were then incubated with DMSO (0.008% DMSO in final volume), 0.02 μM MB for 6 h. An additional set of coverslips was allowed a 4 h washout following treatment. A study using the neuronal marker NeuN (Life Technologies, 187373) indicated that > 95% of cells in the cultures were neurons (data not shown).
Preparation and treatment of tau expressing CHO cells
Stable, tau expressing CHO cells (human wildtype, 4R0N) were incubated with vehicle, rapamycin (1 μM) or 0.01 μM methylene blue (Sigma, R0395 and 9140, respectively; n = 6 wells per group) for 3, 6 or 18 h (some timepoints not shown) in media containing fetal bovine serum. Tau-expressing CHO cells expressing an RFP-GFP-LC3 construct (gift from the Yoshimori lab)47 were treated with vehicle, 0.01 μM MB, or 1 μM bafilomycin A1 (Sigma, B1793) for 6 h. Following treatment, cells were collected and homogenized in RIPA buffer. Samples were then centrifuged for 20 min at 20,000 × g at 4°C.
BECN1 knock down in CHO cells
200000 cells per well were combined either with lentivirus expressing 0.1 µL BECN1 shRNA and a GFP tag (Open Biosystems, VGM5520-101257705), or the lentivirus expressing GFP only (control lentivirus, VGH5526-98858382). Cells were plated and checked for viral integration indicated by GFP expression after 3 d. For these experiments, over 90–95% of the cells were fluorescent. shRNA and control lentivirus expressing cells were treated with either 0.01 μM methylene blue or vehicle for 6 h, then harvested for biochemistry as described for CHO cells. n = 6 wells per group.
LC3 positive vesicle quantification
Coverslips from control and treated primary neuronal cultures from GFP-LC3 mice were fixed for 30 min with 4% paraformaldehyde (EM Services, 15714-S) and counterstained and mounted with Vecta-Shield containing DAPI (Vector Labs, H-1200). Images were collected at 40× magnification using a Zeiss LSM 510 NLO multiphoton confocal microscope (n = at least 50 neurons per group) and imported into Image J. Images were randomized and GFP-LC3 positive vesicle counting was done blinded as to the experimental conditions. The average number and distribution of puncta was determined for each condition.
For CHO cells transfected with the RFP-GFP-LC3 construct, the number of total puncta and the number of RFP only puncta were counted for each cell and the percentage of RFP only determined. For colocalization studies shown in Figures 3 and 4, cells were imaged using 0.3 μm stacks to provide more accurate planar resolution of colocalization.
In vivo methylene blue treatment
Male, homozygous JNPL3 mice aged ~3 mo (n = 10 per group) were used to determine the efficacy of MB as an inducer of autophagy in vivo. Animals were given 0.02 mg/kg MB or water control by oral gavage 5 d a week for 2 weeks. Additional animals were treated with 2.0 or 20 mg/kg MB (n = 10 per group, data not shown).
Tissue fractionation
Tissue from both organotypic slices and animals were processed using methods adapted from Greenberg and Davies.48 Briefly, samples were homogenized in RIPA buffer [50 mM TRIS-HCl (Sigma, T3253), pH 7.4, 150 mM NaCl (Fisher, S271-10), 1 mM EDTA (Fisher, BP0120), 50 mM sodium fluoride (Sigma, S7920), 1 mM Na3VO (Sigma, 72060), 1 μg/ml protease inhibitors (Sigma, P8340), 1 mM phenylmethylsulfonyl fluoride (Sigma, P7626)] and centrifuged at 20,000 × g for 20 min at 4°C to remove debris. The supernatants, which contain the total tau fraction, were retained and assayed for total protein concentration. Samples were diluted using RIPA buffer as necessary to attain equal total protein concentrations. The supernatant was retained and diluted in O+ buffer (62.5 mM TRIS-HCl, pH 6.8, 5% glycerol, 2-mercaptothanol, 2.3% SDS (Fisher, BP166-500), 1 mM EDTA, 1 mM phenylmethylsulfonyl fluoride, 50 mM sodium fluoride, 1 mM NaVO4, 1 μg/ml protease inhibitors). In order to separate out insoluble tau aggregates, an additional aliquot of the total sample was incubated on a rotator in 1% sarkosyl for 30 min. Samples were then centrifuged at 100,000 × g for 1 h at 20°C. Pellets enriched in sarkosyl insoluble, aggregated tau were retained and resuspended in O+ buffer containing 1M DTT (Sigma, D0632).
Quantitative immunoblot analysis
Membranes were blocked in 5% milk in phosphate buffered saline for 30 min. Following blocking, blots were washed and incubated with appropriate dilutions of primary and secondary antibodies. Membranes were developed with enhanced chemiluminescent reagent (Immobilon Western HRP substrate luminol reagent WBKLS0500, Millipore) using a Fujifilm LAS3000 imaging system. Multigauge version 3.0 was utilized to quantify the signal. All vehicle and MB treated samples were run on the same gel. Samples for most of the immunoblots were run on 4–12% Bis-Tris (All Life Technologies; WG1403BOX10) gels with MOPs buffer (NP0001) with antioxidant (NP0005). TRIS-acetate gels (3–8%; WG1603BOX; buffer LA0041) and 16% Tris-glycine gels (EC64985BOX) were used for mTOR and LC3-II respectively. α-tubulin or actin was used as a loading control. No significant difference in amount of protein loaded was seen between samples (data not shown).
Analytical methods
Signal from immunoblots was determined as described above. For organotypic slices, chemiluminescence signal from the vehicle and MB treated samples was determined and the percent change calculated. Average and standard error were determined for each group and significance was assessed utilizing Student’s t-test. Samples from vehicle and MB treated mice were also quantified using Multigauge v 3.0 as described above. Average signal and standard error were calculated and significance was determined using Student’s t-test; the Mann-Whitney U-test was also used.
Supplementary Material
Acknowledgments
This work was funded by grants from the Alzheimer Drug Discovery Foundation (ADDF), the American Health Assistance Foundation (AHAF) and NIH (NS074593).
Glossary
Abbreviations:
- AD
Alzheimer disease
- AV
autophagic vacuole
- BECN1
Beclin-1
- Bif
Bax-inducing factor
- catD
cathepsin D
- CMA
chaperone-mediated autophagy
- CHO
Chinese hamster ovary
- CU
chemiluminescence units
- DMSO
dimethyl sulfoxide
- FTD
fronto-temporal dementia
- GAPDH
glycerol aldehyde phosphatase dehydrogenase
- GSK-3
glycogen synthase kinase 3
- GFP
green fluorescent protein
- Hsc
heat shock cognate
- Hsp
heat shock protein
- IGF
insulin-like growth factor
- IRS
insulin receptor substrate
- MB
methylene blue
- LC
liquid chromatography
- MS
mass spectroscopy
- mTOR
mammalian target of rapamycin
- PI3
phosphoinositide 3-kinase
- PBS
phosphate buffered saline
- p70
p70S6 kinase
- pp70
phosphorylated p70S6 kinase
- RFP
red fluorescent protein
- shRNA
short hairpin RNA
Disclosure of Potential Conflicts of Interest
No potential conflicts of interest were disclosed.
Footnotes
Previously published online: www.landesbioscience.com/journals/autophagy/article/19048
References
- 1.Alonso Adel C, Li B, Grundke-Iqbal I, Iqbal K. Polymerization of hyperphosphorylated tau into filaments eliminates its inhibitory activity. Proc Natl Acad Sci USA. 2006;103:8864–9. doi: 10.1073/pnas.0603214103. [DOI] [PMC free article] [PubMed] [Google Scholar]
- 2.Barghorn S, Zheng-Fischhofer Q, Ackmann M, Biernat J, von Bergen M, Mandelkow EM, et al. Structure, microtubule interactions, and paired helical filament aggregation by tau mutants of frontotemporal dementias. Biochemistry. 2000;39:11714–21. doi: 10.1021/bi000850r. [DOI] [PubMed] [Google Scholar]
- 3.Berger Z, Roder H, Hanna A, Carlson A, Rangachari V, Yue M, et al. Accumulation of pathological tau species and memory loss in a conditional model of tauopathy. J Neurosci. 2007;27:3650–62. doi: 10.1523/JNEUROSCI.0587-07.2007. [DOI] [PMC free article] [PubMed] [Google Scholar]
- 4.Chalmers KA, Love S. Neurofibrillary tangles may interfere with Smad 2/3 signaling in neurons. J Neuropathol Exp Neurol. 2007;66:158–67. doi: 10.1097/nen.0b013e3180303b93. [DOI] [PubMed] [Google Scholar]
- 5.Iliev AI, Ganesan S, Bunt G, Wouters FS. Removal of pattern-breaking sequences in microtubule binding repeats produces instantaneous tau aggregation and toxicity. J Biol Chem. 2006;281:37195–204. doi: 10.1074/jbc.M604863200. [DOI] [PubMed] [Google Scholar]
- 6.Khlistunova I, Biernat J, Wang Y, Pickhardt M, von Bergen M, Gazova Z, et al. Inducible expression of Tau repeat domain in cell models of tauopathy: aggregation is toxic to cells but can be reversed by inhibitor drugs. J Biol Chem. 2006;281:1205–14. doi: 10.1074/jbc.M507753200. [DOI] [PubMed] [Google Scholar]
- 7.Le Corre S, Klafki HW, Plesnila N, Hubinger G, Obermeier A, Sahagun H, et al. An inhibitor of tau hyperphosphorylation prevents severe motor impairments in tau transgenic mice. Proc Natl Acad Sci USA. 2006;103:9673–8. doi: 10.1073/pnas.0602913103. [DOI] [PMC free article] [PubMed] [Google Scholar]
- 8.von Bergen M, Barghorn S, Li L, Marx A, Biernat J, Mandelkow EM, et al. Mutations of tau protein in frontotemporal dementia promote aggregation of paired helical filaments by enhancing local beta-structure. J Biol Chem. 2001;276:48165–74. doi: 10.1074/jbc.M105196200. [DOI] [PubMed] [Google Scholar]
- 9.Götz J, Ittner LM. Animal models of Alzheimer's disease and frontotemporal dementia. Nat Rev Neurosci. 2008;9:532–44. doi: 10.1038/nrn2420. [DOI] [PubMed] [Google Scholar]
- 10.Cuervo AM, Stefanis L, Fredenburg R, Lansbury PT, Sulzer D. Impaired degradation of mutant alpha-synuclein by chaperone-mediated autophagy. Science. 2004;305:1292–5. doi: 10.1126/science.1101738. [DOI] [PubMed] [Google Scholar]
- 11.Martinez-Vicente M, Cuervo AM. Autophagy and neurodegeneration: when the cleaning crew goes on strike. Lancet Neurol. 2007;6:352–61. doi: 10.1016/S1474-4422(07)70076-5. [DOI] [PubMed] [Google Scholar]
- 12.Menzies FM, Huebener J, Renna M, Bonin M, Riess O, Rubinsztein DC. Autophagy induction reduces mutant ataxin-3 levels and toxicity in a mouse model of spinocerebellar ataxia type 3. Brain. 2009;133:93–104. doi: 10.1093/brain/awp292. [DOI] [PMC free article] [PubMed] [Google Scholar]
- 13.Spencer B, Potkar R, Trejo M, Rockenstein E, Patrick C, Gindi R, et al. Beclin 1 gene transfer activates autophagy and ameliorates the neurodegenerative pathology in alpha-synuclein models of Parkinson's and Lewy body diseases. J Neurosci. 2009;29:13578–88. doi: 10.1523/JNEUROSCI.4390-09.2009. [DOI] [PMC free article] [PubMed] [Google Scholar]
- 14.Wang Y, Kruger U, Mandelkow E, Mandelkow EM. Generation of tau aggregates and clearance by autophagy in an inducible cell model of tauopathy. Neurodegener Dis. 2010;7:103–7. doi: 10.1159/000285516. [DOI] [PubMed] [Google Scholar]
- 15.Ikeda K, Akiyama H, Arai T, Kondo H, Haga C, Iritani S, et al. Alz-50/Gallyas-positive lysosome-like intraneuronal granules in Alzheimer's disease and control brains. Neurosci Lett. 1998;258:113–6. doi: 10.1016/S0304-3940(98)00867-2. [DOI] [PubMed] [Google Scholar]
- 16.Hamano T, Gendron TF, Causevic E, Yen SH, Lin WL, Isidoro C, et al. Autophagic-lysosomal perturbation enhances tau aggregation in transfectants with induced wild-type tau expression. Eur J Neurosci. 2008;27:1119–30. doi: 10.1111/j.1460-9568.2008.06084.x. [DOI] [PubMed] [Google Scholar]
- 17.Taniguchi S, Suzuki N, Masuda M, Hisanaga S, Iwatsubo T, Goedert M, et al. Inhibition of heparin-induced tau filament formation by phenothiazines, polyphenols, and porphyrins. J Biol Chem. 2005;280:7614–23. doi: 10.1074/jbc.M408714200. [DOI] [PubMed] [Google Scholar]
- 18.Wischik CM, Edwards PC, Lai RY, Roth M, Harrington CR. Selective inhibition of Alzheimer disease-like tau aggregation by phenothiazines. Proc Natl Acad Sci USA. 1996;93:11213–8. doi: 10.1073/pnas.93.20.11213. [DOI] [PMC free article] [PubMed] [Google Scholar]
- 19.Harrington C, Rickard JE, Horsley D, Harrington KA, Hindley KP, Riedel G, et al. O1-06-04: Methylthioninium chloride (MTC) acts as a Tau aggregation inhibitor (TAI) in a cellular model and reverses Tau pathology in transgenic mouse models of Alzheimer's disease. Alzheimers Dement. 2008;4:T120–1. doi: 10.1016/j.jalz.2008.05.259. [DOI] [Google Scholar]
- 20.Necula M, Breydo L, Milton S, Kayed R, van der Veer WE, Tone P, et al. Methylene blue inhibits amyloid Abeta oligomerization by promoting fibrillization. Biochemistry. 2007;46:8850–60. doi: 10.1021/bi700411k. [DOI] [PubMed] [Google Scholar]
- 21.Medina DX, Caccamo A, Oddo S. Methylene Blue Reduces Abeta Levels and Rescues Early Cognitive Deficit by Increasing Proteasome Activity. Brain Pathol. [DOI] [PMC free article] [PubMed]
- 22.Wischik C, Staff R. Challenges in the conduct of disease-modifying trials in AD: practical experience from a phase 2 trial of Tau-aggregation inhibitor therapy. J Nutr Health Aging. 2009;13:367–9. doi: 10.1007/s12603-009-0046-5. [DOI] [PubMed] [Google Scholar]
- 23.Wischik CM, Bentham P, Wischik DJ, Seng KM. O3-04-07: Tau aggregation inhibitor (TAI) therapy with remberTM arrests disease progression in mild and moderate Alzheimer's disease over 50 weeks. Alzheimers Dement. 2008;4:T167. doi: 10.1016/j.jalz.2008.05.438. [DOI] [Google Scholar]
- 24.Jinwal UK, Miyata Y, Koren J, III, Jones JR, Trotter JH, Chang L, et al. Chemical manipulation of hsp70 ATPase activity regulates tau stability. J Neurosci. 2009;29:12079–88. doi: 10.1523/JNEUROSCI.3345-09.2009. [DOI] [PMC free article] [PubMed] [Google Scholar]
- 25.O'Leary JC, III, Li Q, Marinec P, Blair LJ, Congdon EE, Johnson AG, et al. Phenothiazine-mediated rescue of cognition in tau transgenic mice requires neuroprotection and reduced soluble tau burden. Mol Neurodegener. 2010;5:45. doi: 10.1186/1750-1326-5-45. [DOI] [PMC free article] [PubMed] [Google Scholar]
- 26.Wang AM, Morishima Y, Clapp KM, Peng HM, Pratt WB, Gestwicki JE, et al. Inhibition of hsp70 by methylene blue affects signaling protein function and ubiquitination and modulates polyglutamine protein degradation. J Biol Chem. 2010;285:15714–23. doi: 10.1074/jbc.M109.098806. [DOI] [PMC free article] [PubMed] [Google Scholar]
- 27.Atamna H, Nguyen A, Schultz C, Boyle K, Newberry J, Kato H, et al. Methylene blue delays cellular senescence and enhances key mitochondrial biochemical pathways. FASEB J. 2008;22:703–12. doi: 10.1096/fj.07-9610com. [DOI] [PubMed] [Google Scholar]
- 28.Rojas JC, John JM, Lee J, Gonzalez-Lima F. Methylene blue provides behavioral and metabolic neuroprotection against optic neuropathy. Neurotox Res. 2009;15:260–73. doi: 10.1007/s12640-009-9027-z. [DOI] [PubMed] [Google Scholar]
- 29.Wen Y, Li W, Poteet EC, Xie L, Tan C, Yan LJ, et al. Alternative mitochondrial electron transfer as a novel strategy for neuroprotection. J Biol Chem. 2011;286:16504–15. doi: 10.1074/jbc.M110.208447. [DOI] [PMC free article] [PubMed] [Google Scholar]
- 30.Bjørkøy G, Lamark T, Brech A, Outzen H, Perander M, Overvatn A, et al. p62/SQSTM1 forms protein aggregates degraded by autophagy and has a protective effect on huntingtin-induced cell death. J Cell Biol. 2005;171:603–14. doi: 10.1083/jcb.200507002. [DOI] [PMC free article] [PubMed] [Google Scholar]
- 31.Komatsu M, Waguri S, Koike M, Sou YS, Ueno T, Hara T, et al. Homeostatic levels of p62 control cytoplasmic inclusion body formation in autophagy-deficient mice. Cell. 2007;131:1149–63. doi: 10.1016/j.cell.2007.10.035. [DOI] [PubMed] [Google Scholar]
- 32.Itakura E, Kishi C, Inoue K, Mizushima N. Beclin 1 forms two distinct phosphatidylinositol 3-kinase complexes with mammalian Atg14 and UVRAG. Mol Biol Cell. 2008;19:5360–72. doi: 10.1091/mbc.E08-01-0080. [DOI] [PMC free article] [PubMed] [Google Scholar]
- 33.Ohsumi Y, Mizushima N. Two ubiquitin-like conjugation systems essential for autophagy. Semin Cell Dev Biol. 2004;15:231–6. doi: 10.1016/j.semcdb.2003.12.004. [DOI] [PubMed] [Google Scholar]
- 34.Vander Haar E, Lee SI, Bandhakavi S, Griffin TJ, Kim DH. Insulin signalling to mTOR mediated by the Akt/PKB substrate PRAS40. Nat Cell Biol. 2007;9:316–23. doi: 10.1038/ncb1547. [DOI] [PubMed] [Google Scholar]
- 35.Sun SY, Rosenberg LM, Wang X, Zhou Z, Yue P, Fu H, et al. Activation of Akt and eIF4E survival pathways by rapamycin-mediated mammalian target of rapamycin inhibition. Cancer Res. 2005;65:7052–8. doi: 10.1158/0008-5472.CAN-05-0917. [DOI] [PubMed] [Google Scholar]
- 36.Shi Y, Yan H, Frost P, Gera J, Lichtenstein A. Mammalian target of rapamycin inhibitors activate the AKT kinase in multiple myeloma cells by up-regulating the insulin-like growth factor receptor/insulin receptor substrate-1/phosphatidylinositol 3-kinase cascade. Mol Cancer Ther. 2005;4:1533–40. doi: 10.1158/1535-7163.MCT-05-0068. [DOI] [PubMed] [Google Scholar]
- 37.Takahashi Y, Coppola D, Matsushita N, Cualing HD, Sun M, Sato Y, et al. Bif-1 interacts with Beclin 1 through UVRAG and regulates autophagy and tumorigenesis. Nat Cell Biol. 2007;9:1142–51. doi: 10.1038/ncb1634. [DOI] [PMC free article] [PubMed] [Google Scholar]
- 38.Yang J, Takahashi Y, Cheng E, Liu J, Terranova PF, Zhao B, et al. GSK-3beta promotes cell survival by modulating Bif-1-dependent autophagy and cell death. J Cell Sci. 2010;123:861–70. doi: 10.1242/jcs.060475. [DOI] [PMC free article] [PubMed] [Google Scholar]
- 39.Tsvetkov AS, Miller J, Arrasate M, Wong JS, Pleiss MA, Finkbeiner S. A small-molecule scaffold induces autophagy in primary neurons and protects against toxicity in a Huntington disease model. Proc Natl Acad Sci USA. 2010;107:16982–7. doi: 10.1073/pnas.1004498107. [DOI] [PMC free article] [PubMed] [Google Scholar]
- 40.Zhang L, Yu J, Pan H, Hu P, Hao Y, Cai W, et al. Small molecule regulators of autophagy identified by an image-based high-throughput screen. Proc Natl Acad Sci USA. 2007;104:19023–8. doi: 10.1073/pnas.0709695104. [DOI] [PMC free article] [PubMed] [Google Scholar]
- 41.Massey AC, Kaushik S, Sovak G, Kiffin R, Cuervo AM. Consequences of the selective blockage of chaperone-mediated autophagy. Proc Natl Acad Sci USA. 2006;103:5805–10. doi: 10.1073/pnas.0507436103. [DOI] [PMC free article] [PubMed] [Google Scholar]
- 42.Rojas JC, Simola N, Kermath BA, Kane JR, Schallert T, Gonzalez-Lima F. Striatal neuroprotection with methylene blue. Neuroscience. 2009;163:877–89. doi: 10.1016/j.neuroscience.2009.07.012. [DOI] [PMC free article] [PubMed] [Google Scholar]
- 43.Furian AF, Fighera MR, Oliveira MS, Ferreira AP, Fiorenza NG, de Carvalho Myskiw J, et al. Methylene blue prevents methylmalonate-induced seizures and oxidative damage in rat striatum. Neurochem Int. 2007;50:164–71. doi: 10.1016/j.neuint.2006.07.012. [DOI] [PubMed] [Google Scholar]
- 44.Lewis J, McGowan E, Rockwood J, Melrose H, Nacharaju P, Van Slegtenhorst M, et al. Neurofibrillary tangles, amyotrophy and progressive motor disturbance in mice expressing mutant (P301L) tau protein. Nat Genet. 2000;25:402–5. doi: 10.1038/78078. [DOI] [PubMed] [Google Scholar]
- 45.Mizushima N, Yamamoto A, Matsui M, Yoshimori T, Ohsumi Y. In vivo analysis of autophagy in response to nutrient starvation using transgenic mice expressing a fluorescent autophagosome marker. Mol Biol Cell. 2004;15:1101–11. doi: 10.1091/mbc.E03-09-0704. [DOI] [PMC free article] [PubMed] [Google Scholar]
- 46.Duff K, Noble W, Gaynor K, Matsuoka Y. Organotypic slice cultures from transgenic mice as disease model systems. J Mol Neurosci. 2002;19:317–20. doi: 10.1385/JMN:19:3:317. [DOI] [PubMed] [Google Scholar]
- 47.Kimura S, Noda T, Yoshimori T. Dissection of the autophagosome maturation process by a novel reporter protein, tandem fluorescent-tagged LC3. Autophagy. 2007;3:452–60. doi: 10.4161/auto.4451. [DOI] [PubMed] [Google Scholar]
- 48.Greenberg SG, Davies P. A preparation of Alzheimer paired helical filaments that displays distinct tau proteins by polyacrylamide gel electrophoresis. Proc Natl Acad Sci USA. 1990;87:5827–31. doi: 10.1073/pnas.87.15.5827. [DOI] [PMC free article] [PubMed] [Google Scholar]
Associated Data
This section collects any data citations, data availability statements, or supplementary materials included in this article.


