Abstract
Despite their immense potential in biomedicine, carbon nanomaterials suffer from inefficient dispersion and biological activity in vivo. Here we utilize a single, yet multifunctional, hyaluronic acid-based biosurfactant to simultaneously disperse nanocarbons and target single-walled carbon nanotubes (SWCNTs) to CD44 receptor positive tumor cells with prompt uptake. Cellular uptake was monitored by intracellular enzyme-activated fluorescence and localization of SWCNTs within cells was further confirmed by Raman mapping. In vivo photoacoustic, fluorescence and positron emission tomography imaging of coated SWCNTs display high tumor targeting capability while providing long-term, fluorescence molecular imaging of targeted enzyme events. By utilizing a single biomaterial surfactant for SWCNT dispersion without additional bioconjugation, we designed a facile technique that brings nanocarbons closer to their biomedical potential.
Keywords: Carbon nanomaterials, one-step functionalization, hyaluronic acid, nanotubes, molecular
Nanocarbons, or carbon-based nanomaterials, have attracted particular interest in promising engineering applications from energy storage to biomedicine.1, 2 Because of their outstanding physicochemical properties,3 nanocarbons continue to make significant impact in the biomedical field as composite materials for tissue engineering,4, 5 biosensors,6–8 imaging agents,9, 10 drug carriers11 and photothermal therapeutics. 12, 13 Yet, three major issues of uncoated nanocarbons - poor dispersibility, lack of biological targetablity and inherent cytotoxicity - have stunted their uses in physiological conditions and greatly restrict the capabilities for in vivo targeting, delivery and/or imaging.
Surface engineering of nanocarbons with various biocompatible compounds and targeting ligands empower its applications in biomedicine by improving aqueous dispersibility while reducing aggregation, minimizing toxicity and enhancing cellular targetability. Among nanocarbons, carbon nanotubes (CNTs), especially single-walled carbon nanotubes (SWCNTs), have been particularly investigated for drug, gene and protein delivery due to their large surface area, in vivo imaging based on their intrinsic optical properties, and photothermal therapy attributable to their strong optical absorbance. To maintain these properties in biological conditions, proper surface functionalization is vital towards successful biomedical application of SWCNTs. The preferred technique is nondestructive, non-covalent functionalization, where the entire tube surface area of up to 2600 m2/g can be modified with aromatic compounds, surfactants, polymers or biomolecules via van der Waals forces, pi-pi interaction or adsorption/wrapping.14 Surfactants, amphiphilic molecules, are good candidates for CNT dispersion. They can adsorb on the nanotube surface via the hydrophobic part, dispersing individualized SWCNTs, while the hydrophilic end can provide solubility in the solvent. Charged surfactants like sodium dodecyl sulfate or cetyltrimethyl ammonium bromide have been extensively used.15 Although these positively charged surfactants in excess amounts show improvement in solubility and cellular uptake of CNTs, such surplus can lead to cell membrane lysis or protein denaturation. Furthermore, their application in physiological conditions suffers from non-specific absorption, where serum proteins can efficiently replace the surfactant, and hence lead to poor tissue accumulation.
We previously demonstrated that SWCNTs non-covalently modified with phospholipid–polyethylene glycol (PL-PEG) exhibit high stability in vivo and can be subjected to versatile chemical modification, like arginine–glycine–aspartic acid (RGD) peptide to target integrin receptors for high tumor accumulation 11, 13, 16–18 This pertinent technique has opened up the use of CNTs in biomedical applications for high sensitivity tumor imaging and delivery of abundant therapeutic pay-loads; yet, its preparation involves multi-step conjugations totaling up to ten days of functionalization and conjugation and involves great losses in recovered materials. For effective SWCNT use in future biomedical applications, sophisticated surface coatings are required to confer biocompatibility and multifunctionality. Although the existing coating methods demonstrate great potential in proof-of-concept in vivo applications and studies continue towards innovative multifunctional purposes, complicated synthetic processes and time-consuming purification steps hamper translation. Therefore, to harness the potential of nanocarbons for real biomedical applications in the clinic, a facile surface coating is required to equip nanocarbons with solubility and multifunctionality for imaging, delivery and therapy.
Here we introduce a single and facile technique that offers solubility and multifunctionality to nanocarbons with a single, multifunctional biosurfactant, hyaluronic acid-5β-cholanic acid conjugate (HAC). We previously reported on the use of this biosurfactant as a highly efficient carrier/solubilizer for hydrophobic small molecules with efficient tumor uptake because of their high biocompatibility, specific targeting and cell-permeability 19, 20 In terms of its physiological conditions, HAC is biocompatible, cell-permeable and specifically targets cancer cells that overexpress CD44, a cell-surface glycoprotein responsible for tumor metastasis. Such features, when imparted onto SWCNTs, not only give the nanotube solubility but also biocompatibility and cancer cell targetability. With the use of a single, versatile and multifunctional biosurfactant, the nanocarbons can attain cancer cell targetability and high receptor-mediated uptake in vitro and in vivo without the need for multi-step bioconjugation. In this report, we introduce the ability of HAC to induce highly-soluble nanocarbons and use SWCNTs as a model nanocarbon to demonstrate the unique biological characteristics of the multifunctional HAC-coated SWCNT (HA-NTs) in cells and in a murine xenograft. Using a variety of imaging modalities, including TEM, Raman mapping, positron emission tomography (PET), fluorescence and photoacoustic (PA) imaging, we demonstrate HA-NTs retained the biocompatibility, fast targeting and uptake properties of HAC. With this facile technique, the true therapeutic potentials of CNTs that are already established, such as photothermal therapy (PTT) and drug delivery, can now be effectively achieved.
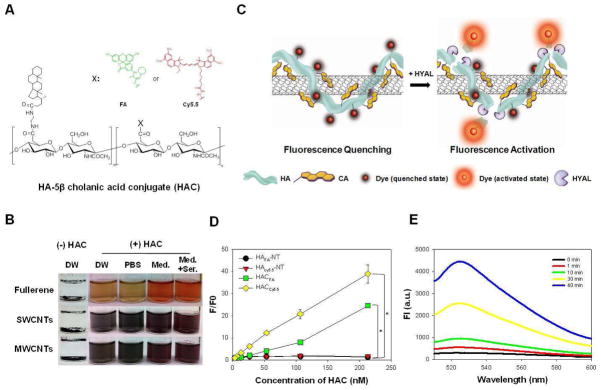
First, HAC-wrapped nanocarbons (HA-nanocarbons) were prepared, purified and characterized by physicochemical properties. HAC was synthesized as previously reported.21 HA-nanocarbons were formulated by sonicating HAC (Fig. 1A) with fullerenes, single- and multi-walled carbon nanotubes at a weight ratio of 2:1, a much smaller amount than dispersing agents previously reported.22–24 As soon as HAC was added, the nanocarbons exhibited effective dispersion in distilled water (DW). Additionally, an observed maximum concentration of soluble SWCNT was greater than 5 mg/mL, not commonly reported for dispersing agents. Probe sonication was performed to induce cholanic acid hydrophobic interaction with the SWCNT surface and in turn disrupt the inter-tube Van der Waals interactions. HA-nanocarbons were easily purified by PD-10 desalting column. Once in DW and purified, HA-nanocarbons could be further transferred into phosphate buffered saline solution (PBS, 10 mM, pH 7.4), cell culture medium (Med, RPMI 1640), and medium with 10% serum (Med + Ser), as shown in Fig. 1B and continued to remain soluble for over 2 months (see Supporting Information Fig. S1). It should be noted that the whole process, facile coating of HA-nanocarbons and purification, was completely achieved in less than 1.5 h. Proper coating of HA-NT was verified by AFM images (see Supporting Information Fig. S2), identification of UV-Vis absorbance and Raman spectroscopy peaks for disperse SWCNTs and zeta potential measurements. AFM phase image displays individualized HA-NTs when dried on a substrate with little excess of HAC. Zeta-potential measurements of purified HA-NTs exhibited a negative charge at −62.7 ± 5 mV, similar to previous reported data for HAC,21 implying the coated HAC contribution on SWCNTs. HA-NTs continued to exhibit the characteristic Raman shift at 1585 cm−1, G-band, in a concentration dependent manner (see Supporting Information Fig. S3). For cellular and in vivo fluorescence imaging, HA was further labeled with fluoresceinamine (HAFA) and cyanine 5.5 (HACy5.5), respectively (see Supporting Information Fig. S4). Analysis by UV-Vis spectroscopy showed that about 130 FA molecules and 7 Cy5.5 molecules were conjugated per HAC chain, respectively (M W. of HA, 234.4 kDa). It was hypothesized that because of the high optical absorbance, SWCNTs coated with HAFA or HACy5.5 could effectively quench the fluorescence when closely interacting with each other. HA can be specifically degraded by hyaluronidase (HYAL) such as Hyal–1, Hyal–2 and PH-20.25 We hypothesized that this enzymatic reaction can be used to recover the fluorescence of HAdye-NTs (Fig. 1C). To firstly observe the quenching effect, the HAdye-NT fluorescence property was measured by spectrofluorometry (Fig. 1D). HAdye and HAdye-NT fluorescence intensity fold from 3.3 nM HAdye was measured over the 3.3 – 213 nM concentration range of HAdye. As expected, without SWCNTs, HAFA and HACy5.5 fluorescence increased concentration dependently by 25 ± 0.1 and 38.9 ± 4.0-fold at 213 nM. On the other hand, with NTs, HAFA-NT and HACy5.5-NT fluorescence only increased by 1.4 ± 0.1 and 1.7 ± 0.2-fold. Therefore the NT quenched HAFA and HACy5.5 fluorescence at 213 nM by 17.8 ± 0.1 and 23.1 ± 2.7-fold, respectively. Furthermore, fluorescence activation of 213 nM HAFA-NT (based on the content of HAFA) after the addition of 400 units/mL of HYAL lead to 10 ± 2.7-fold fluorescence recovery after 40 minutes (Fig. 1E). The fluorescence activation was not only time dependent but also HYAL activity dependent (see Supporting Information Fig. S5A). The same fluorescence activation effect was seen for HACy5.5-NT (see Supporting Information Fig. S5B). The in vitro enzyme assays (Figs. 1E and S5) demonstrated that HAdye-NTs are able to provide enough fluorescence signal amplification to monitor and track SWCNTs both in cells and in vivo. The location of HA degradation by HYAL is an important factor when considering tracking. Of the HYALs, PH-20 and Hyal-2 are glycosylphosphatidylinositol-anchored proteins located on the surface of plasma membranes. While PH-20 is only found on sperms cells, Hyal-2 is a more prevalent protein that initiates the cleavage of high molecular weight HA to transitional HA units of 50–100 saccharides in the extracellular space. Although Hyal-2 initiates extracellular degradation of HA, HA turnover occurs mainly within cells due to Hyal-1. Hyal-1 is widely expressed in various somatic tissues and plasma; but, because of its sharp optimum pH of around 3.7, Hyal-1 is strongly active in lysosomes. It exhibits high specific activity and degrades HA oligomers into small sized fragments such as tetrasaccharides in the lysosome. Therefore, we hypothesize that the unique fluorescence activation by an intracellular enzyme, Hyal-1, can not only aid in tracking SWCNT cellular uptake but also provide truly molecular, fluorescence imaging in vivo
Figure 1.
A) Structure of the hyaluronic acid-5β-cholanic acid (HAC), where X is OH. When HAC is dye-labeled, X corresponds to fluoresceinamine (FA) (HAFA) or cyanine 5.5 (Cy5.5) (HACy5.5). B) Photographs of insoluble, non-coated nanocarbons (-HAC) in distilled water (DW) and soluble nanocarbons when sonicated with HAC in DW, phosphate buffer saline solution (PBS, 10 mM, pH 7.4), RPMI 1640 media (Med.) and media supplemented with 10% fetal bovine serum (Med.+Ser.). Nanocarbons included are fullerenes and single-walled and multi-walled carbon nanotubes (SWCNT, MWCNTs). C) Schematic of dye-labeled HAC wrapped on SWCNTs (HA-NT) and its fluorescence activation properties. HAC coating on SWCNTs render the fluorescent dye-labeled material quenched. In the presence of hyaluronidase (HYAL), an enzyme that specifically cleaves HA, the dye molecules are released from the SWCNT and fluorescence is recovered. D) Fluorescence fold increase from 3.3 nM HAFA or Cy5.5 as a measure of increasing HAFA or Cy5.5 concentration with and without SWCNTs. HAFA excitation: 490 nm, emission: 525 nm; HACy5.5 excitation: 675 nm, emission: 695 nm. E) HAFA–NT fluorescence (ex: 490 nm, em: 525 nm) after 400 units of HYAL was added to 213 nM (in respect to HAFA) of HAFA–NT over time.
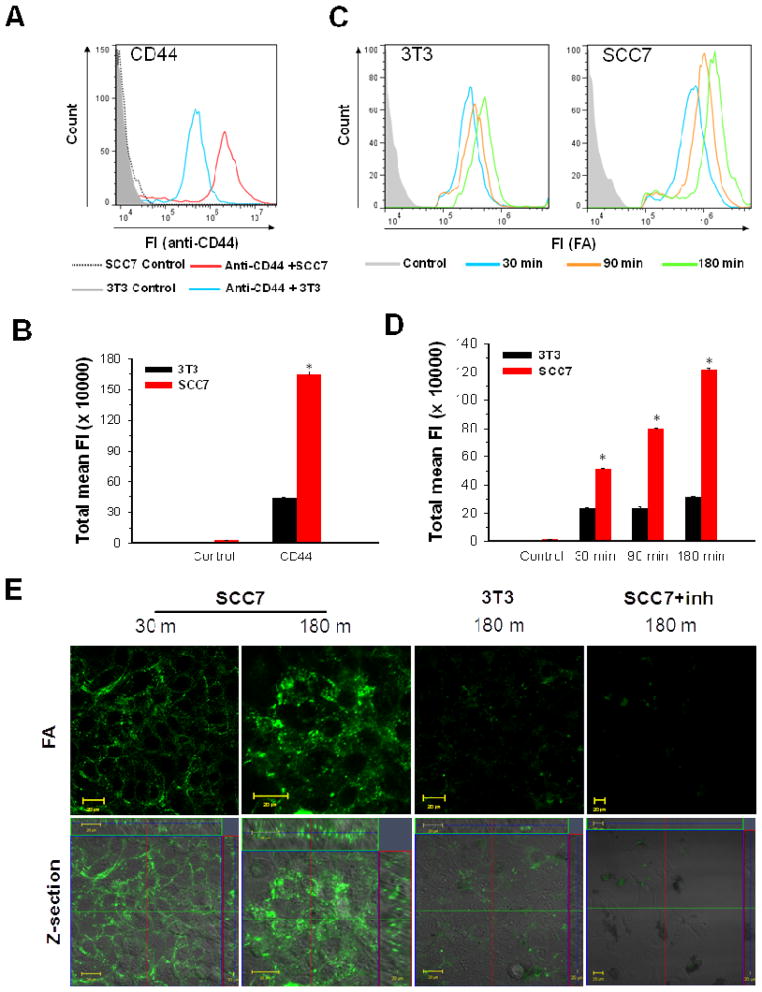
Next, selective cancer cell uptake of HAFA-NTs was investigated. Numerous studies have shown that interactions between hyaluronic acid and CD44 promote endocytosis and hyaluronic acid has been previously utilized for fast tumor targeting via selective uptake.21, 25 Therefore, HAFA-NTs were hypothesized to maintain HA targetability of CD44 and improve cellular uptake of SWCNTs. We evaluated the cellular uptake of HAFA-NTs in SCC7 (head and neck squamous cell carcinoma) cells that are strongly positive for CD44 and HYAL (CD44+/HYAL+) and in NIH 3T3 (mouse embryonic fibroblast) cells, less positive for CD44 and HYAL (CD44−/HYAL−). CD44 receptor labeling of SCC7 and 3T3 cells was analyzed by fluorescence activated cell sorting (FACS) (Fig. 2A). A higher expression of CD44 receptors on SCC7 cells than 3T3 cells was confirmed, approximately 3.8-fold greater (p < 0.05) (Fig. 2B). Next, cells were treated with HAFA-NTs (50 μg/mL) for 30, 60 and 180 min at 37°C. To ascertain the cellular uptake, in vitro FA fluorescence was measured by FACS on these samples. FACS data exemplified a time dependent uptake of HAFA-NTs in SCC7 cells, which can be attributed to HYAL degradation of HA and imply a receptor-mediated uptake of SWCNTs in CD44 receptor positive cells (Fig. 2C). On the other hand, minimal fluorescence intensity and no time dependency were seen in 3T3 cells, implying that SWCNT uptake and HAFA degradation is due to non-specific mechanisms. Interestingly, the cellular uptake ratio of HAFA-NTs between SCC7 and 3T3 cells was proportional to their CD44 receptor expressions. FA total mean fluorescence was 3.9 ± 1.6-fold greater in SCC7 than 3T3 cells, similar to the 3.8 ± 0.40-fold greater CD44 labeling on SCC7 cells, after 180 min of HAFA-NTs uptake (Fig. 2D). As shown in the confocal images in Fig. 2E, green fluorescence signals from activated HAFA were significantly more intense in CD44+/HYAL+ SCC7 than in the CD44−/HYAL− 3T3 cells. Further analysis of fluorescence intensity profiles of confocal images is shown in Supporting Information Fig. S6. When the SCC7 cells were treated with excess HA to inhibit the CD44 receptors, no intracellular fluorescence signals were observed. This indicates that CD44 receptors are responsible for the efficient cellular uptake of HAFA-NTs.
Figure 2.
A) CD44 receptor expression of SCC7 and 3T3 cells analyzed by fluorescence-activated cell sorting (FACS) after CD44 antibody labeling. B) Quantitative analysis of FACS total mean fluorescence (S.D., n = 5,000 cells, * p<0.05) of data in (A). C) FACS distribution of HAFA fluorescence in respective cell types after 30 min (blue), 90 min (orange), and 180 min (green) treatment with HAFA–NT. D) Quantitative analysis of FACS total mean fluorescence (S.D., n = 5,000 cells, * p<0.05) of data in (C). E) Confocal fluorescence imaging of CD44 positive cells SCC7 and CD44 negative cells 3T3 treated with HAFA–NT for 30 and 180 min. SCC7 cells were inhibited by excess HA (SCC7 + inh.) before treatment with HAFA–NT.
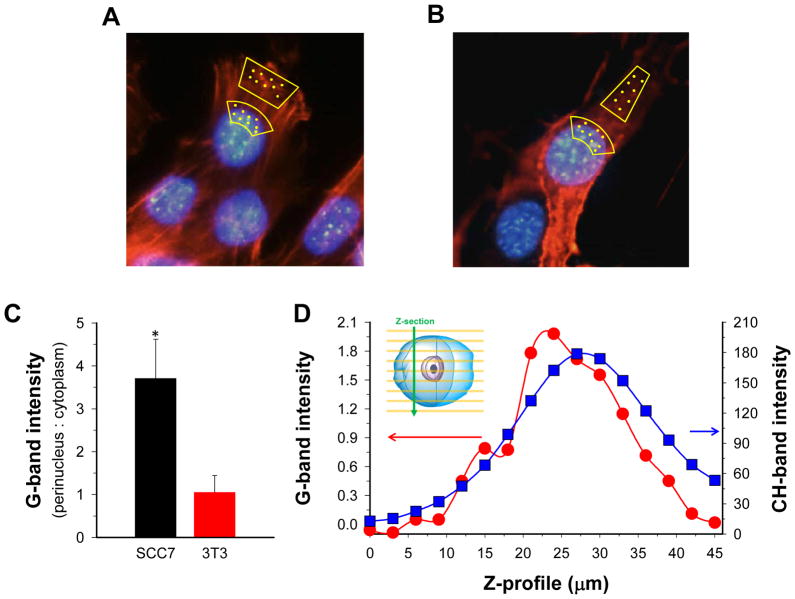
To verify intracellular SWCNT presence, Raman spectra were measured by confocal Raman microspectroscopy at selected locations of the cells treated with HAFA-NTs. These spectra sense presence of graphene structures which exhibit the G-band at 1580 – 1590 cm−1 wavenumbers. This band is strong and easily distinguishable from other Raman bands in biological samples and has been used in previous in vitro, ex vivo and in vivo applications of Raman imaging of SWCNTs.9, 10, 17. As seen in Fig. 3A, B, Raman spectra were collected from various location points of fixed SCC7 and 3T3 cells after treatment with 50 μg/mL HAFA-NT solution for 3 h followed by washing. Baseline-corrected integral intensities of the G-band showed preferential accumulation of SWCNTs in the perinuclear region of CD44+/HYAL+ SCC7 cells whereas CD44−/HYAL− 3T3 cells lacked preferential accumulation (Fig 3C). Such accumulation of SWCNTs paralleled the preferential accumulation of the fluorescence label of HAFA-NTs (Figs. 2C and S6). To verify that the higher SWCNT presence in SCC7 cells was because of delivery inside the cell rather than attachment to the cell membrane or pinning underneath the cell, we recorded Raman spectra through the perinuclear locations of the SCC7 cells treated with HAFA- NTs for 3 h. The cells were suspended, fixed, placed between microscope slides in PBS and recorded at pre-determined z distances. The stretching vibrations of CH-groups of all cell molecules at 2862–2912 cm−1 served as a marker of the cell interior. This recording identified the G-band inside the SCC7 cells (Fig. 3D). Repeated recording at the same positions indicated that displacement of SWCNT by Raman laser was negligible.
Figure 3.
A, B) Representative cell images with actin and nuclei staining displaying where Raman spectra were collected in cell culture for SCC7 cells (A) and 3T3 cells (B). Yellow spots represent locations. C) Integral intensity of SWCNT G-band at 1550–1610 cm−1 at locations specified in (A and B). Error bars display S.E. for three SCC7 and three 3T3 cells (6–30 points at each location). D) Integral intensity of G-band and stretching vibration band of CH groups across the z-axis of an SCC7 cell suspended between microscope slides. Integration range for CH: 2800 – 3100 cm−1.
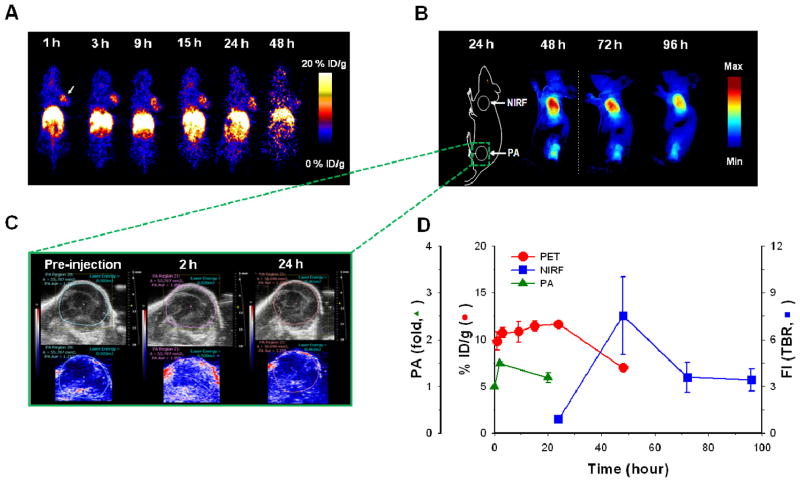
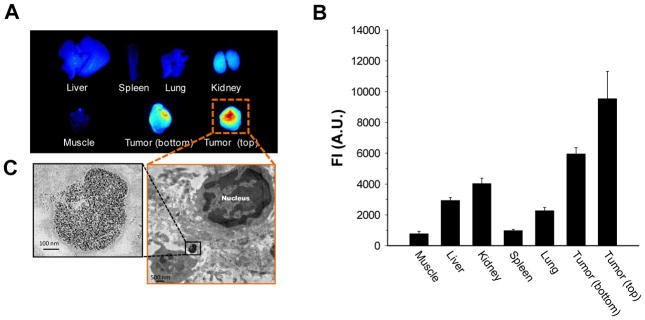
After systemic validation of HA-NTs in vitro, to demonstrate the utility of HA-NTs for in vivo biomedical applications, we analyzed selective tumor specificity of HA-NTs in a SCC7 tumor-bearing mice model using three different imaging modalities, PET, fluorescence and PA imaging system. 64Cu and Cy5.5-labeled HA-NTs, namely HA64Cu-DOTA-NTs and HACy5.5-NTs, were prepared for PET scans and for fluorescence and PA imaging. A series of typical images are illustrated in Fig. 4. First, the in vivo tumor accumulation of HA-NTs was imaged by PET at multiple time points for up to 48 h following intravenous injection of HA64Cu-DOTA-NTs (100 – 200 μCi in 100 uL PBS) in SCC7 xenograft mouse model (Fig. 4A). Just as other reported nanomaterials including SWCNT-based formulations, HA64Cu-DOTA-NTs showed a tendency to accumulate in the major organs and at 48 h post-injection, HA64Cu-DOTA-NTs exhibited a high uptake of 24.4 ± 3.2, 8.9 ± 0.7 and 17.2 ± 5.6 % ID/g (injected dose per gram of tissue) in the liver, kidney, and spleen, respectively (see Supporting Information Fig. S7). However, it should be noted that unlike other materials, HA64Cu-DOTA-NTs demonstrated a high tumor uptake of 9.8 ± 1.6 % ID/g in a considerably short time, less than 1 h, and accumulation was maintained up to 11.7 ± 0.4 % ID/g for 24 h and gradually decreased to 7.0 ± 0.2 % ID/g at 48 h post-injection. This rapid uptake and long-term accumulation of HA-NTs in tumor regions is a unique property compared to that of other nanocarbon formulations decorated with targeting ligands. For example, our previously reported PEGylated SWCNTs conjugated with RGD peptides showed a similar high tumor uptake of 10 – 15 % ID/g in integrin receptor-positive U87 tumors; however, it took more than 6 h to reach an accumulation plateau.16 In addition to the relatively fast tumor uptake, HA-NTs provided a considerably low variation in signal among mice, compared to our previous formulations. Once we quantitatively monitored the tumor specificity of HA-NTs by PET scans, the tumor accumulation of HA-NTs was further confirmed by fluorescence and PA imaging using HACy5.5-NTs. We inoculated SCC7 tumors at both the shoulder (for fluorescence) and left hip (for PA) regions of mice. Unlike PET imaging, fluorescence images exhibited strong fluorescence signals at the tumor site 48 h post-injection (Fig. 4B). We hypothesize that although the CNTs targeted the tumor site quickly, fluorescence activation was only visible after the HA on the HA-NTs was degraded by the intracellular, lysosomal enzyme, Hyal-1. Even though the extracellular enzyme Hyal-2 could initiate HA catabolism, the cellular and in vivo observations exhibit intracellular fluorescence activation. Therefore, cellular uptake time and fluorescence quenching could attribute to the later fluorescence emission. In contrast, as expected, PA imaging discerned the SWCNT absorbance at the tumor site within one hour after injection (Fig. 4C). PA signal from the tumor was increased up to 1.5 ± 0.1-fold at 2 h post-injection of HACy5.5-NTs compared to pre-injection. Comparing all imaging modalities used, tumor uptake profiles over time were recorded in Fig. 4D. Tumor uptake profiles for PET, which tracks the radiolabeled HAC coating, and PA imaging, which directly detects the SWCNT, show similar trends of fast uptake. This can imply the proper coating of HA-NT in vivo. Fluorescence intensities, however, which depend on HYAL degradation were only detected 24 h post-injection. This delay in signal compared to PET or PA imaging may be attributed to the time the HA-NTs are endocytosed via CD44 receptors and then degraded in lysosomal Hyal-1.25 Various organs were carefully collected after sacrificing the mice at 96 h post-injection and the biodistribution was evaluated in terms of fluorescence intensities (Fig. 5A, B). As shown in Fig. 5, in accordance with in vivo fluorescence images, fluorescence was activated predominantly in both tumors. Tumor from the left hip showed relatively low fluorescence signals compared to the tumor for the shoulder; possibly due to the photobleaching of Cy5.5 induced by continuous exposure to laser light during PA imaging. Since fluorescence imaging depends on the intracellular molecular interaction between HA and HYAL, the fluorescence signal intensity demonstrates molecular imaging of HYAL rather than just tracking of HA-NTs. Hyal-1 is hypothesized to play a major role in the intracellular degradation of HA and hence the fluorescence activation of HA-NTs. As seen in Fig. 5C, TEM images of a tumor section verify HA-NTs were successfully delivered into the tumor cells and accumulated in lysosomes, where Hyal-1 is highly active. A higher concentration of HYAL in the tumor region has been reported in similar head and neck tumor models,25 which can contribute to the high fluorescence activation at the tumor site over background.
Figure 4.
A) Positron emission tomography images of SCC7 tumor-bearing mice at 1 – 48 h post-injection of 64Cu labeled HA-NT (HA64Cu-DOTA-NTs). B) In vivo near-infrared fluorescence (NIRF) imaging of SCC7 tumor-bearing mice at 24 – 96 h post-injection of HACy5.5-NTs. The color bar represents the radiant efficiency (min: 0, max: 1.2 × 10⁵). C) Ultrasound (top) and photoacoustic imaging (bottom) of the bottom hind limb SCC7 tumor of mice at pre-injection and 2 and 20 h post- injection of HACy5.5-NTs. D) Quantitative analysis of all imaging modality intensities at the tumor site of mice treated with HA-NTs. Error bars represent S.D, n = 3 mice. Each modality is displayed on its respective y-axis (red circle: PET, % injected dose per gram; blue square: NIRF, tumor to background ratio (TBR) of fluorescence intensity; PA, photoacoustic signal fold from pre-injection timepoint).
Figure 5.
A) Ex vivo biodistribution of an SCC7 tumor-bearing mouse treated with HACy5.5-NTs imaged by NIRF imaging. Bottom tumor relates to the hind limb tumor, imaged by photoacoustic imaging in Figure 4C. Top tumor relates to the front flank tumor location. B) Quantitative analysis of NIRF of ex vivo biodistribution. Error bars represent S.D, n = 3 mice. C) TEM image of a representative tumor slice showing a high concentration of SWCNTs in the vesicle of the tumor cell.
The biomaterial coating introduced in this study simultaneously serves as a dispersing and targeting agent for carbon nanomaterials, which both contribute to the effective tumor accumulation in vivo. HA-NTs exhibited high tumor targeting in vivo, as measured by PET and PA imaging, with intracellular delivery, as signaled by fluorescence activation. We hypothesize that the exhibited CD44 targeting played a large role in tumor retention of our HA-NT platform. But as seen by our previous study, non-targeting phospholipid-PEG coated SWCNTs can accumulate in tumors at an approximate tumor uptake of 3–4% ID/g.16 Non-targeted accumulation can be attributed to the EPR effect, where nanoparticles can extravasate from the blood stream to the tumor site through the leaky vasculature during tumor development. Therefore, properly coated but non-targeted SWCNTs can still collect in the tumor regions in vivo, but targeting greatly enhances the effect by at least 2.75 fold as shown in the phospholipid coated SWCNT coating. The HA target, CD44, is an important regulator between HA in the extracellular matrix and responsive intracellular signaling cascades. These signal-transduction processes play critical roles in cell function such as matrix adhesion, T cell adhesion and activation, and haematopoiesis 26, 27 Therefore, CD44 is expressed in most vertebrate cells. However, elevated CD44 expression levels have been implicated in different malignancies compared to normal tissues and can be correlated with tumorigenesis and metastasis.25 It is this significant overexpression of CD44 in most cancer cell types that aids in the targeting and uptake of HA-NT in cells and in vivo (Figs. 2, 4). Detailed quantitative pharmacokinetic and biodistribution studies are underway to fully understand the fate of HA-NTs in vivo.
In this study, using SWCNT as a model nanocarbon, we demonstrated that the use of a unique coating biomaterial, amphiphilic hyaluronic acid conjugate, can disperse nanocarbons and provide multifunctionalities to SWCNTs, especially for tumor-targeted biomedical applications. By simple sonication, with total preparation totaling less than 1.5 h, HAC transformed the raw powder form of SWCNTs into multifunctional SWCNTs with high aqueous solubility, enhanced cell penetration and selective targeting both in cells and tumors. HA-NTs were chemically labeled with fluorescent dyes to confirm its selective CD44 receptor uptake in cells and its ability to fluorescently activate based on enzyme degradation by HYAL. Furthermore, Raman micro-spectroscopic mapping was utilized to directly detect SWCNT signals in cells and analysis confirmed higher uptake of SWCNTs in CD44+ over CD44- cells. Intracellular delivery of SWCNTs, rather than just its fluorescence activated dye, was confirmed by z-profiling of Raman spectra. These properties were further taken advantage of to provide highly tumor targetable and truly molecular imaging agents. As imaged by PET, which tracks the DOTA labeled coating of the SWCNTs, and PA imaging, which directly senses the SWCNT absorbance, effectively coated HA-NTs targeted the tumor site within one hour. Furthermore, the non-destructed SWCNT coating was confirmed by its efficient quenching capabilities in vivo. The unique fluorescence activation properties of this HA-NT allowed for the direct molecular imaging of HYAL, which was only activated after 24 h. This not only confirms that the HAC was stably coated onto the SWCNT during its in vivo distribution with little non-specific fluorescence activation, but it confirms the conjugate’s ability for molecular detection of HYAL. With a facile, one-step technique, HA-NTs can simultaneously provide solubility, targetability and sensing capabilities in vivo.
Supplementary Material
Acknowledgments
This work was supported by the Intramural Research Program (IRP) of the National Institute of Biomedical Imaging and Bioengineering (NIBIB) and of the National Institute of Child Health and Human Development (NICHD), National Institutes of Health (NIH), the International Cooperative Program of the National Science Foundation of China (NSFC) (81028009), Chinese Academy of Sciences professorship for Senior International Scientists (2011T2J06) and partially supported by an NIH Pathway to Independence (K99/R00) Award. The authors thank the input of Dr. Albert Jin for his AFM work, Dr. Guofeng Zhang for his TEM expertise, Dr. John Sun of VisualSonics for his great effort with photoacoustic imaging and Ms. Myung Sun Lee for illustrations.
Footnotes
Supporting Information, the details of physicochemical properties of HA-NTs. This material is available free of charge via the Internet at http://pubs.acs.org.
References
- 1.Baughman RH, Zakhidov AA, de Heer WA. Science. 2002;297:787–792. doi: 10.1126/science.1060928. [DOI] [PubMed] [Google Scholar]
- 2.Yang ST, Luo J, Zhou Q, Wang H. Theranostics. 2012;2:271–282. doi: 10.7150/thno.3618. [DOI] [PMC free article] [PubMed] [Google Scholar]
- 3.Dai H. Surf Sci. 2002;500:218–241. [Google Scholar]
- 4.Harrison BS, Atala A. Biomaterials. 2007;28:344–353. doi: 10.1016/j.biomaterials.2006.07.044. [DOI] [PubMed] [Google Scholar]
- 5.Correa-Duarte MA, Wagner N, Rojas-Chapana J, Morsczeck C, Thie M, Giersig M. Nano Lett. 2004;4:2233–2236. [Google Scholar]
- 6.Besteman K, Lee JO, Wiertz FGM, Heering HA, Dekker C. Nano Lett. 2003;3:727–730. [Google Scholar]
- 7.Alivisatos P. Nat Biotechnol. 2004;22:47–52. doi: 10.1038/nbt927. [DOI] [PubMed] [Google Scholar]
- 8.Chen RJ, Bangsaruntip S, Drouvalakis KA, Kam NWS, Shim M, Li YM, Kim W, Utz PJ, Dai HJ. Proc Natl Acad Sci U S A. 2003;100:4984–4989. doi: 10.1073/pnas.0837064100. [DOI] [PMC free article] [PubMed] [Google Scholar]
- 9.Heller DA, Baik S, Eurell TE, Strano MS. Adv Mater. 2005;17:2793–2799. [Google Scholar]
- 10.Keren S, Zavaleta C, Cheng Z, de la Zerda A, Gheysens O, Gambhir SS. Proc Natl Acad Sci U S A. 2008;105:5844–5849. doi: 10.1073/pnas.0710575105. [DOI] [PMC free article] [PubMed] [Google Scholar]
- 11.Liu Z, Chen K, Davis C, Sherlock S, Cao Q, Chen X, Dai H. Cancer Res. 2008;68:6652–6660. doi: 10.1158/0008-5472.CAN-08-1468. [DOI] [PMC free article] [PubMed] [Google Scholar]
- 12.Kam NWS, O’Connell M, Wisdom JA, Dai H. Proc Natl Acad Sci U S A. 2005;102:11600–11605. doi: 10.1073/pnas.0502680102. [DOI] [PMC free article] [PubMed] [Google Scholar]
- 13.De La Zerda A, Zavaleta C, Keren S, Vaithilingam S, Bodapati S, Liu Z, Levi J, Smith BR, Ma TJ, Oralkan O, Cheng Z, Chen X, Dai H, Khuri-Yakub BT, Gambhir SS. Nat Nanotechnol. 2008;3:557–562. doi: 10.1038/nnano.2008.231. [DOI] [PMC free article] [PubMed] [Google Scholar]
- 14.Karousis N, Tagmatarchis N, Tasis D. Chem Rev. 2010;110:5366–5397. doi: 10.1021/cr100018g. [DOI] [PubMed] [Google Scholar]
- 15.Tasis D, Tagmatarchis N, Bianco A, Prato M. Chem Rev. 2006;106:1105–1136. doi: 10.1021/cr050569o. [DOI] [PubMed] [Google Scholar]
- 16.Liu Z, Cai W, He L, Nakayama N, Chen K, Sun X, Chen X, Dai H. Nat Nanotechnol. 2007;2:47–52. doi: 10.1038/nnano.2006.170. [DOI] [PubMed] [Google Scholar]
- 17.Liu Z, Davis C, Cai W, He L, Chen X, Dai H. Proc Natl Acad Sci U S A. 2008;105:1410–1415. doi: 10.1073/pnas.0707654105. [DOI] [PMC free article] [PubMed] [Google Scholar]
- 18.Zavaleta C, de la Zerda A, Liu Z, Keren S, Cheng Z, Schipper M, Chen X, Dai H, Gambhir SS. Nano Lett. 2008;8:2800–2805. doi: 10.1021/nl801362a. [DOI] [PMC free article] [PubMed] [Google Scholar]
- 19.Choi KY, Yoon HY, Kim JH, Bae SM, Park RW, Kang YM, Kim IS, Kwon IC, Choi K, Jeong SY, Kim K, Park JH. ACS Nano. 2011;5:8591–8599. doi: 10.1021/nn202070n. [DOI] [PubMed] [Google Scholar]
- 20.Liu G, Choi KY, Bhirde A, Swierczewska M, Yin J, Lee SW, Park JH, Hong JI, Xie J, Niu G, Kiesewetter DO, Lee S, Chen X. Angew Chem, Int Ed. 2012;51:558–558. doi: 10.1002/anie.201105565. [DOI] [PMC free article] [PubMed] [Google Scholar]
- 21.Choi KY, Chung H, Min KH, Yoon HY, Kim K, Park JH, Kwon IC, Jeong SY. Biomaterials. 2010;31:106–114. doi: 10.1016/j.biomaterials.2009.09.030. [DOI] [PubMed] [Google Scholar]
- 22.Moulton SE, Maugey M, Poulin P, Wallace GG. J Am Chem Soc. 2007;129:9452–9457. doi: 10.1021/ja072160h. [DOI] [PubMed] [Google Scholar]
- 23.Razal JM, Gilmore KJ, Wallace GG. Adv Funct Mater. 2008;18:61–66. [Google Scholar]
- 24.Liu Z, Tabakman SM, Chen Z, Dai H. Nat Protoc. 2009;4:1372–1381. doi: 10.1038/nprot.2009.146. [DOI] [PMC free article] [PubMed] [Google Scholar]
- 25.Choi KY, Saravanakumar G, Park JH, Park K. Colloids Surf, B. 2011 doi: 10.1016/j colsurfb.2011.10.029. [DOI] [PMC free article] [PubMed] [Google Scholar]
- 26.Ponta H, Sherman L, Herrlich PA. Nat Rev Mol Cell Biol. 2003;4:33–45. doi: 10.1038/nrm1004. [DOI] [PubMed] [Google Scholar]
- 27.Zoller M. Nat Rev Cancer. 2011;11:254–67. doi: 10.1038/nrc3023. [DOI] [PubMed] [Google Scholar]
Associated Data
This section collects any data citations, data availability statements, or supplementary materials included in this article.


