Abstract
The management and quantification of bone loss is a major challenge in primary and revision total hip replacement. Defining the normal three-dimensional (3D) anatomy of the acetabular vault could aid in assessing pathologic changes and in designing prosthetic joint components. We performed a quantitative assessment of normal 3D acetabular vault structure to define the shape and location of weight-bearing acetabular bone referred to as the vault. Images from 70 normal hip computed tomography images were used to define the 3D acetabular vault anatomy and develop a 3D model. Variation in vault shape was quantified by measuring the distance between every surface point on a subject’s hemipelvis and the reference vault. Variation among different hip alignments was assessed using 19 scans from subjects with varus, valgus and dysplastic hip morphologies. The acetabular vault model had 96.6% (95% CI: 91.7–101.5), 97.8% (95% CI: 94.5–101.1) and 96.4% (95% CI: 98.7–94.1) of the surface points within 3 mm of normal male, normal female and abnormal hip specimens, respectively. Comparison of acetabular vault model fit between gender and hip types revealed that it was only significantly different between normal males and normal females (P = 0.0194) and between normal males and dysplastic females (P = 0.0377). A conserved 3D acetabular vault shape and location exists that can accommodate various hip morphologies. Defining a normal vault may increase the precision with which hip pathology can be identified and may also serve as a preoperative assessment tool for planning total hip arthroplasty.
Keywords: acetabular anatomy, acetabular vault, preoperative planning, total hip arthroplasty
Introduction
The weight-bearing portion of the acetabulum was first described by Knight & Smith (1958) as the portion of the cortical and cancellous bone of the anterior superior quadrant of the acetabulum. This region has a higher density of trabecular bone than the rest of the pelvis to support the forces of weight-bearing and motion (Dalstra et al. 1993). Alterations to the shape of the vault lead to abnormalities in superior acetabular dome trabecular bone stresses, which is one impetus for recreating normal anatomy in surgical procedures (Rapperport et al. 1985). A challenge in hip reconstruction is that the native bony anatomy of the hip is often deficient, especially in revision and dysplastic total hip arthroplasty (THA) cases, making preoperative planning imperative for a successful outcome (Crutcher & James, 2000).
Traditionally, preoperative assessment of deformity and bone loss in hip reconstruction and THAs have been limited to plain film x-ray and computed tomography (CT). These techniques are criticized for being imprecise and qualitative (Delp et al. 1994; Huppertz et al. 2011). Currently, no gold standard exists for assessing the borders and structural integrity of the acetabular vault (Noordin et al. 2010), leading to speculation about the changes in a joint (Debarge et al. 2008) and resulting in less favorable functional outcomes (Delp et al. 1994). Three-dimensional (3D) reconstructions from CT scans of the hip joint have recently been introduced to preoperatively assess hip anatomy and are designed to give surgeons the ability to analyze the anatomy of the hip as a free body, usually independent of patient alignment within the gantry. Despite the improved visualization afforded by 3D reconstructions, the ability to reproduce a patient’s normal anatomy is still lacking. Defining the 3D architecture and location in anatomic space of a normal acetabular vault and its variability in a population may improve the precision with which hip pathology is identified, providing surgeons with a guide for correcting bony deformities when reconstructing a patient’s normal anatomy. Theoretically, this capability could lead to improved stability and fixation of the acetabular prosthesis in THA and minimize failures. This surrogate for normal anatomy may also allow the surgeon to recreate normalized biomechanics in severely pathologic hips. This is particularly important given the influence of appropriate acetabular component placement on wear (Patil et al. 2003), impingement (D’Lima et al. 2001), and loosening (Yoder et al. 1988) of hip prostheses.
The 3D shape of the normal acetabular vault and its variation among the population has not been evaluated previously. The objective of this study was to define the shape and location of the normal 3D acetabular vault in a population of normal pelvi and quantify its variability among different hip morphologies.
Materials and methods
Image acquisition
This study was reviewed and approved by the Institutional Review Board at our facility. A sample of 89 de-identified CT scans of patients performed between June 2009 and August 2009 were obtained using magicview 3000 software (GE Healthcare, Piscataway, NJ). These scans were from cases in which abdominal and pelvic imaging studies were performed for non-hip-related complaints (e.g. gastrointestinal or genitourinary). Images were reconstructed at 0.8-mm increments using previously described methods (Scalise et al. 2008a), which provide excellent bone edge definition.
Patient scans were grouped into normal, dysplastic, varus, and valgus using previously described methods for measuring the neck shaft angle (NSA), the angle between the femoral shaft and femoral neck, and the center edge angle (CEA), the angle between a cephalocaudal line perpendicular to the line tangent to the bilateral ischial tuberosities in AP view and a line through the center of the femoral head to the most superolateral point on the acetabular rim (Yochum & Rowe, 2005). Normal hip joints had a NSA and CEA ranging between 120°–135° and > 25°, respectively. Hips with a CEA < 25° were grouped as dysplastic. Hip joints with an NSA > 135° were designated valgus, while those with an NSA < 120° were designated varus.
Patient scans were excluded for the following reasons: (i) evidence of protrusio acetabuli (CEA > 40º and medialization of the medial wall of the acetabulum past the ilioischial line) (McBride et al. 2001), (ii) presence of hip prostheses, and/or (iii) multiple hip joint deformities. Using these criteria, a final cohort consisting of 70 normal pelvi (37 male), 11 valgus pelvi (2 male), 3 varus pelvi (2 male) and 5 dysplastic pelvi (0 male) was included in the study. The average age of patients was 60 ± 18 years (range, 21–93). After grouping the scans based upon NSA and CEA, the reconstructed images were loaded into a custom software package for 3D post-processing (MicroView, Beijing, China). The software converts data from the CT scan into a 3D volumetric image, which allows the pelvis to be viewed from any angle and analyzed as a free body.
Vault generation
We performed a quantitative assessment of the normal, 3D acetabular vault structure and location using similar methodology to that developed, validated, and reported in the shoulder (Codsi et al. 2008; Scalise et al. 2008a,b). After converting the CT scan into a 3D representation, each image set was digitally cropped to include only the right hemipelvis. The external cortical profile of the hemipelvis from each frontal section was defined by a digital imaging process known as splining (Fig. 1), whereby the cortex of the hemipelvis in each anterior-posterior (AP) section was outlined with a series of manually placed dots connected by lines. Each dot serves as a data point defining the cortical surface and when the outlines of each section are stacked together, or ‘stitched’, the result is a 3D rendering of the hemipelvis. An average of 68 (± 10.1) points were placed per AP section and there were an average of 78 (± 13.1) AP sections per hemipelvis, resulting in an average of 5324.7 (± 1126.4) points per hemipelvis.
Fig. 1.
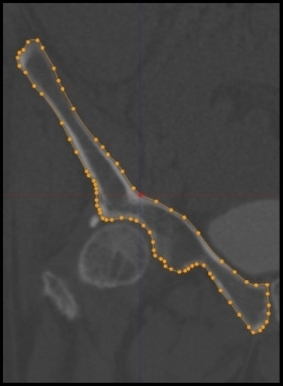
External cortical surface tracings of a frontal image of the right hemipelvis.
Splining was performed in the AP view beginning anteriorly where the ala of the ilium and the margin of the acetabulum join to form the anterior column. Splining ended where the posterior column diverged into the alar process carrying the posterior inferior iliac spine and the ischial spine. Superior, inferior, medial, and lateral borders were defined for each pelvis in every AP slice. We purposely oversampled the area selected during splining, with the intention of fine-tuning the actual vault once we had seen the shape and could infer the most efficacious model volume. The superior border of the vault was defined as a curve along the contour of the femoral head cortex at a distance of 60% of the head diameter from the femoral head. The inferior border of the vault was defined by a horizontal transverse line at the level of the equator of the femoral head. The medial border of the vault was defined by the contour of the medial wall between the superior border and the femoral head equator. The lateral border of the vault was defined by the contour of the acetabulum and lateral wall of the ilium between the superior border and the femoral head equator in each AP image (Fig. 2). Each set of 2D splines was then stitched into a 3D model, representing a patient’s unique right hemipelvis (Fig. 3).
Fig. 2.
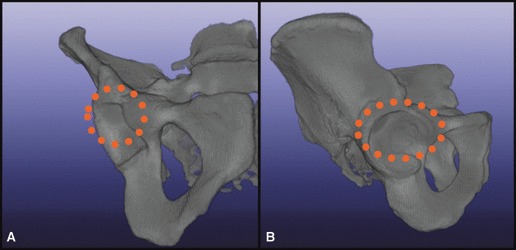
Outline of superior, inferior, medial, and lateral borders. (A) Anterior view, (B) lateral view.
Fig. 3.
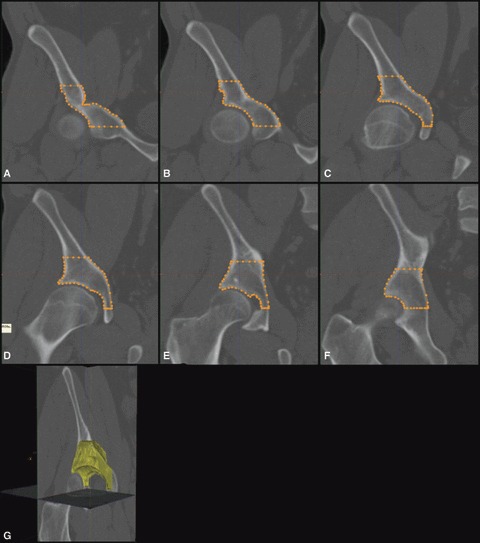
(A–F) Series of external cortical surface tracings of a frontal image of the right hemipelvis. (G) 3D model of patient vault overlaid on 3-mm CT scan slice.
Normalization and validation of vault model
All 3D hemipelvi were normalized by best-fitting a sphere to the femoral head, and then scaling it to a fixed 25-mm radius (Fig. 4). The standard size was based upon the reference vault model. The 3D reference vault was then oriented to the hemipelvis in a two-step, best-fit process. A preliminary manual fit consisted of aligning the vault model acetabular fossa to the patient’s superior fossa. During the manual fit, the fovea and rim features were used as references for depth and roll orientation. After this, the proprietary software refined the vault-to-hemipelvis fit using a process known as iterative closest point (ICP) registration. Variation in vault shape between the study population and reference vault was quantified using the Euclidean distance between nearest neighboring points method. In this process, the software measured the distance between every point on each of the patient’s hemipelvi to the nearest point on the reference vault model. In the best fit configuration, the distance between points on a patient’s hemipelvis and the reference vault model was calculated and illustrated in color (Fig. 5).
Fig. 4.
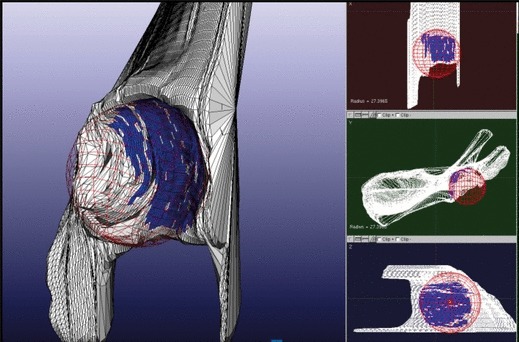
Representation of femoral head as a best-fit sphere, used for normalization of models.
Fig. 5.
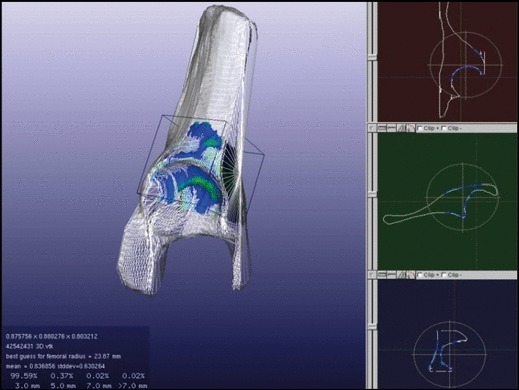
Best-fit configuration of a patient hemipelvis and the reference vault model that are to be morphologically compared. Colors represent the distance between the two vaults at each point: Blue, < 3 mm; green, 3–5 mm; yellow, 5–7 mm; red, > 7 mm.
Statistical considerations
The statistical mean, standard deviation and range were calculated for all continuous variables and any categorical variables were evaluated using proportions. Student’s t-test was used to detect differences between means of parametric data and the Wilcoxon rank sum test was used to detect differences between means of nonparametric data. Analyses were done using the jmp 9.0 (SAS, Cary, NC) statistical package.
Results
Comparing normal male and female hemipelvi to the reference vault, at least 96.6% (95% CI: 91.7–101.5%) and 97.8% (95% CI: 94.5–101.1%) of the surface points were within 3 mm, respectively (Table 1). Figure 6 illustrates the 3D volumetric rendering of the reference vault model used to determine surface point distance distribution. When the reference vault was compared to the various hip morphologies, all groups except the valgus male shared greater than 95.7% of the surface points at a distance of 0 mm to 3 mm between vault model and patient acetabular surfaces (Table 1). Even when the valgus male data were considered, at least 93.8% of the surface points were within 3 mm of the reference vault. When the distance between surfaces was extended from 0 to 7 mm, the shared reference points increased to at least 99.5%.
Table 1.
Surface point distance distribution from reference vault for each vault grouping
| Surface points distance distribution [Mean percentage (SD)] | ||||
|---|---|---|---|---|
| Group | [0 mm, 3 mm] | [3 mm, 5 mm] | [5 mm, 7 mm] | > 7 mm |
| Normal male (n = 37) | 96.59 (2.47) | 2.92 (1.72) | 0.37 (0.67) | 0.12 (0.38) |
| Normal female (n = 33) | 97.81 (1.64) | 2.07 (1.58) | 0.10 (0.11) | 0.02 (0.03) |
| Varus male (n = 2) | 97.04 (0.99) | 2.86 (0.92) | 0.06 (0.03) | 0.03 (0.04) |
| Varus female (n = 1) | 95.73 | 3.52 | 0.61 | 0.14 |
| Valgus male (n = 2) | 93.76 (4.98) | 4.63 (3.01) | 1.10 (1.30) | 0.51 (0.66) |
| Valgus female (n = 9) | 96.90 (2.17) | 3.03 (2.16) | 0.05 (0.05) | 0.01 (0.02) |
| Dysplastic Female (n = 5) | 98.50 (1.01) | 1.49 (1.01) | 0.01 (0.01) | 0 (0) |
Fig. 6.

Three-dimensional volumetric rendering of the acetabular vault model (right-sided), which approximates the general vault morphology. (A) Inferior view, (B) lateral view, (C) anterior view.
Table 2 depicts the comparisons of vault model fit between gender and the various hip morphologies. There was a difference (P = 0.0194) between the average number of surface points within 3 mm of the reference vault and hemipelvis for normal males (96.59 ± 2.47 points) and normal females: (97.81 ± 1.64 points). There was also a difference (P = 0.0377) between the median number of surface points within 3 mm of the reference vault and hemipelvis for normal males: 96.4 (interquartile range: 95.57–98.59) compared with dysplastic females: 98.70 (interquartile range: 97.51–99.38).
Table 2.
Comparison of the number of surface points < 3 mm between the reference vault and hemipelvis for all groups. Mean and standard deviation (n ≥ 20), median and interquartile range (n < 20)
| Group 1 | [Mean (SD) or median (interquartile range) points < 3 mm] | Group 2 | [Mean (SD) or median (interquartile range) points < 3 mm] | P-value |
|---|---|---|---|---|
| Normal male | 96.59 (2.47) | Normal female | 97.81 (1.64) | 0.0377 |
| Normal male | 96.4 (95.57–98.59) | Valgus male | 93.76 (90.24–97.28) | 0.3083 |
| Normal male | 96.4 (95.57–98.59) | Valgus female | 97.66 (95.14–98.76) | 0.5703 |
| Normal male | 96.4 (95.57–98.59) | Varus male | 97.04 (96.34–97.74) | 0.8485 |
| Normal male | 96.4 (95.57–98.59) | Dysplastic female | 98.7 (97.51–99.38) | 0.0377 |
| Normal female | 97.81 (1.64) | Valgus male | 93.76 (90.24–97.28) | 0.1179 |
| Normal female | 97.81 (1.64) | Valgus female | 97.66 (95.14–98.76) | 0.3045 |
| Normal female | 97.81 (1.64) | Varus male | 97.04 (96.34–97.74) | 0.4344 |
| Normal female | 97.81 (1.64) | Dysplastic female | 98.7 (97.51–99.38) | 0.4498 |
| Valgus male | 93.76 (90.24–97.28) | Valgus female | 97.66 (95.14–98.76) | 0.2386 |
| Valgus male | 93.76 (90.24–97.28) | Varus Male | 97.04 (96.34–97.74) | 0.4386 |
| Valgus male | 93.76 (90.24–97.28) | Dysplastic female | 98.7 (97.51–99.38) | 0.1213 |
| Valgus female | 97.66 (95.14–98.76) | Varus male | 97.04 (96.34–97.74) | 0.9369 |
| Valgus female | 97.66 (95.14–98.76) | Dysplastic female | 98.7 (97.51–99.38) | 0.1615 |
| Varus male | 97.04 (96.34–97.74) | Dysplastic female | 98.7 (97.51–99.38) | 0.1213 |
It is important to recognize that nonconforming points tended to be in areas where medial wall thickness, especially when measured through the fovea to the interior cortex, varied from that of the vault model. The recurring outliers were usually distal to the load-bearing area that would be considered the functional acetabular vault. These minimal areas of the acetabular rim, medial wall, and select segments of the anterior and posterior columns, while not vital to the vault proper, were necessary orientation references used for accurate vault placement. Omitting them would have reduced operator certainty of placement for the initial step in fitting, whereas including them in the vault model still yielded at least 93.8% surface point correlation within 3 mm, and 99.5% correlation within 7 mm.
Discussion
In this study, normal acetabular vault shape was defined and assessed for variability among different hip morphologies. Comparison of the normal hemipelvi revealed that, on average, at least 97% of the surface points between the reference acetabular vault and hemipelvi varied by less than 3 mm, suggesting that a single vault geometry fits a variety of hip morphologies. When comparing all hip morphologies to the reference vault, we found that, on average, 96.4% of the surface points of the acetabular vaults varied by less than 3 mm. This suggests that the reference vault shape from this study is generalizable among the patient populations in these cohorts.
With the development of the Digital Imaging and Communications in Medicine (DICOM) format, joint characteristics that are useful for preoperative assessment are more easily and reliably obtained using implant simulation programs. Specifically, 3D CT-reconstructions have improved a surgeon’s accuracy in measuring angles (Suh et al. 2006) and lengths (Noble et al. 2003) that were previously inaccurately obtained. Additionally, Seel et al. (2006) demonstrated how 3D CT-reconstructions allow surgeons to preoperatively simulate range of motion and optimize acetabular cup position. Sariali et al. (2009) showed that these reconstructions can accurately measure hip offset and anteversion. While knowledge of a patient’s precise bony pathology is valuable, corrective strategies based solely upon an individual’s pathology force surgeons to guess at how to recreate a normal foundation and location for the patient. This is particularly important considering that maintaining normal acetabular vault anatomy is essential to ensuring proper biomechanical force distribution in the hip joint (Rapperport et al. 1985; Barsoum et al. 2007).
This study demonstrates that, through a combination of manual fit and ICP registration, the location of the acetabular vault can be reliably found in a variety of hip morphologies. Pelvic morphology is thought to develop, in part, as a result of force distribution (Beaupre et al. 1990). Moreover, the location of the acetabular component has a significant bearing on the forces that are transmitted through the pelvis. The importance of restoring the hip to its anatomic center during reconstruction has been demonstrated by multiple studies (Crowninshield et al. 1983; Bayley et al. 1987; Gates et al. 1989). For instance, Lachiewicz (Lachiewicz et al. 1986; Lachiewicz, 1997) showed that placement of the acetabular component > 5 mm from the original anatomic position in treatment of protrusio acetabuli leads to increased loosening of components. The use of our acetabular vault model with ICP registration allows 98.5% of the surface area of dysplastic acetabulae to be correctly identified to within 3 mm, which may be useful for prosthesis placement and reconstruction of the joint to restore an individual’s original morphology.
In the past, studies have shown that the use of CT can enhance the surgeon’s ability to measure presumed bone loss (Puri et al. 2002), but no study has described the use of a validated surrogate to assist in placement of the implant in the acetabulum. We believe that this surrogate can be helpful in determining the true extent of bone loss and may play a role in planning reconstructive options as described in the glenoid (Scalise et al. 2008a). Future studies should be conducted to evaluate the acetabular vault’s efficacy in predicting bone loss in patients with osteoarthritis.
While our findings suggest that the vault is conserved in patients with varus, valgus and dysplastic hip orientations, further evaluation is necessary to conclusively demonstrate consistency in hip joints with known bone loss or profound deformity. It is important to recognize that this paper does not propose a novel prosthetic acetabular component. Evaluating the fit of a stereolithographic anatomic (SLA) model of the conserved acetabular vault in cadaver pelvi would further validate the conserved nature of the acetabular vault shape and location. Additionally, the criteria used in this study to determine the accuracy of acetabular vault shape were the distance between the reference acetabular vault and a patient’s hemipelvis. However, the mechanical stability of this shape would require further evaluation before consideration as a prototype acetabular component. To model acetabular deformities more reliably, measurements in patients with unilateral hip deformity should be taken and compared to their normal hip in a future study.
In conclusion, the acetabular vault is a structurally important and highly conserved volume of bone. Our vault model is an important first step in moving toward better defining bone loss and structural integrity of the vault, which could improve planning and execution of hip reconstruction and THA in many patient populations. We believe that the use of a surrogate model to create normal mechanics and improve pre-operative planning is an important step in improving patient outcomes.
Acknowledgments
Dr. Barsoum would like to report that he is a consultant to Stryker Orthopaedics and Shukla Medical. He has received research support from Stryker Orthopaedics, Zimmer, TissueLink Medical (Salient Surgical Technologies), CoolSystems, and Orthovita. Additionally, he has received royalties from Stryker Orthopaedics, Exactech, Wright Medical Technology, and Shukla Medical as well as stock options in OtisMed Corporation.
Author contributions
Wael K. Barsoum: contributions to concept/design, data analysis/interpretation, critical revision of manuscript and approval of article. Travis Smith: contributions to concept/design, data acquisition, data analysis/interpretation, critical revision of manuscript and approval of article. Leonard Buller: data analysis/interpretation, drafting of manuscript, critical revision of manuscript and approval of article. Alison Klika: critical revision of manuscript and approval of article. Constantine Mavroudis: contributions to concept/design, data acquisition, data analysis/interpretation. Jason Bryan: contributions to concept/design, data analysis/interpretation.
References
- Barsoum WK, Patterson RW, Higuera C, et al. A computer model of the position of the combined component in the prevention of impingement in total hip replacement. J Bone Joint Surg Br. 2007;89:839–845. doi: 10.1302/0301-620X.89B6.18644. [DOI] [PubMed] [Google Scholar]
- Bayley JC, Christie MJ, Ewald FC, et al. Long-term results of total hip arthroplasty in protrusio acetabuli. J Arthroplasty. 1987;2:275–279. doi: 10.1016/s0883-5403(87)80059-1. [DOI] [PubMed] [Google Scholar]
- Beaupre GS, Orr TE, Carter DR. An approach for time-dependent bone modeling and remodeling – theoretical development. J Orthop Res. 1990;8:651–661. doi: 10.1002/jor.1100080506. [DOI] [PubMed] [Google Scholar]
- Codsi MJ, Bennetts C, Gordiev K, et al. Normal glenoid vault anatomy and validation of a novel glenoid implant shape. J Shoulder Elbow Surg. 2008;17:471–478. doi: 10.1016/j.jse.2007.08.010. [DOI] [PubMed] [Google Scholar]
- Crowninshield RD, Brand RA, Pedersen DR. A stress analysis of acetabular reconstruction in protrusio acetabuli. J Bone Joint Surg Am. 1983;65:495–499. [PubMed] [Google Scholar]
- Crutcher J, James P. Preoperative planning for total hip arthroplasty. Oper Tech Orthop. 2000;10:102–105. [Google Scholar]
- Dalstra M, Huiskes R, Odgaard A, et al. Mechanical and textural properties of pelvic trabecular bone. J Biomech. 1993;26:523–535. doi: 10.1016/0021-9290(93)90014-6. [DOI] [PubMed] [Google Scholar]
- Debarge R, Lustig S, Neyret P, et al. Confrontation of the radiographic preoperative planning with the postoperative data for uncemented total hip arthroplasty. Rev Chir Orthop Reparatrice Appar Mot. 2008;94:368–375. doi: 10.1016/j.rco.2007.07.004. [DOI] [PubMed] [Google Scholar]
- Delp SL, Komattu AV, Wixson RL. Superior displacement of the hip in total joint replacement: effects of prosthetic neck length, neck-stem angle, and anteversion angle on the moment-generating capacity of the muscles. J Orthop Res. 1994;12:860–870. doi: 10.1002/jor.1100120614. [DOI] [PubMed] [Google Scholar]
- D’Lima DD, Chen PC, Colwell CW., Jr Optimizing acetabular component position to minimize impingement and reduce contact stress. J Bone Joint Surg Am. 2001;83-A(Suppl 2 Pt 2):87–91. doi: 10.2106/00004623-200100022-00005. [DOI] [PubMed] [Google Scholar]
- Gates HS, 3rd, Poletti SC, Callaghan JJ, et al. Radiographic measurements in protrusio acetabuli. J Arthroplasty. 1989;4:347–351. doi: 10.1016/s0883-5403(89)80036-1. [DOI] [PubMed] [Google Scholar]
- Huppertz A, Radmer S, Asbach P, et al. Computed tomography for preoperative planning in minimal-invasive total hip arthroplasty: radiation exposure and cost analysis. Eur J Radiol. 2011;78:406–413. doi: 10.1016/j.ejrad.2009.11.024. [DOI] [PubMed] [Google Scholar]
- Knight RA, Smith H. Central fractures of the acetabulum. J Bone Joint Surg Am. 1958;40-A:1–16. passim. [PubMed] [Google Scholar]
- Lachiewicz PF. Rheumatoid arthritis of the hip. J Am Acad Orthop Surg. 1997;5:332–338. doi: 10.5435/00124635-199711000-00005. [DOI] [PubMed] [Google Scholar]
- Lachiewicz PF, McCaskill B, Inglis A, et al. Total hip arthroplasty in juvenile rheumatoid arthritis. Two to eleven-year results. J Bone Joint Surg Am. 1986;68:502–508. [PubMed] [Google Scholar]
- McBride MT, Muldoon MP, Santore RF, et al. Protrusio acetabuli: diagnosis and treatment. J Am Acad Orthop Surg. 2001;9:79–88. doi: 10.5435/00124635-200103000-00002. [DOI] [PubMed] [Google Scholar]
- Noble PC, Sugano N, Johnston JD, et al. Computer simulation: how can it help the surgeon optimize implant position? Clin Orthop Relat Res. 2003;417:242–252. doi: 10.1097/01.blo.0000096829.67494.dc. [DOI] [PubMed] [Google Scholar]
- Noordin S, Masri BA, Duncan CP, et al. Acetabular bone loss in revision total hip arthroplasty: principles and techniques. Instr Course Lect. 2010;59:27–36. [PubMed] [Google Scholar]
- Patil S, Bergula A, Chen PC, et al. Polyethylene wear and acetabular component orientation. J Bone Joint Surg Am. 2003;85-A(Suppl 4):56–63. doi: 10.2106/00004623-200300004-00007. [DOI] [PubMed] [Google Scholar]
- Puri L, Wixson RL, Stern SH, et al. Use of helical computed tomography for the assessment of acetabular osteolysis after total hip arthroplasty. J Bone Joint Surg Am. 2002;84-A:609–614. doi: 10.2106/00004623-200204000-00016. [DOI] [PubMed] [Google Scholar]
- Rapperport DJ, Carter DR, Schurman DJ. Contact finite element stress analysis of the hip joint. J Orthop Res. 1985;3:435–446. doi: 10.1002/jor.1100030406. [DOI] [PubMed] [Google Scholar]
- Sariali E, Mouttet A, Pasquier G, et al. Three-dimensional hip anatomy in osteoarthritis. Analysis of the femoral offset. J Arthroplasty. 2009;24:990–997. doi: 10.1016/j.arth.2008.04.031. [DOI] [PubMed] [Google Scholar]
- Scalise JJ, Bryan J, Polster J, et al. Quantitative analysis of glenoid bone loss in osteoarthritis using three-dimensional computed tomography scans. J Shoulder Elbow Surg. 2008a;17:328–335. doi: 10.1016/j.jse.2007.07.013. [DOI] [PubMed] [Google Scholar]
- Scalise JJ, Codsi MJ, Bryan J, et al. The three-dimensional glenoid vault model can estimate normal glenoid version in osteoarthritis. J Shoulder Elbow Surg. 2008b;17:487–491. doi: 10.1016/j.jse.2007.09.006. [DOI] [PubMed] [Google Scholar]
- Seel MJ, Hafez MA, Eckman K, et al. Three-dimensional planning and virtual radiographs in revision total hip arthroplasty for instability. Clin Orthop Relat Res. 2006;442:35–38. [PubMed] [Google Scholar]
- Suh KT, Kang JH, Roh HL, et al. True femoral anteversion during primary total hip arthroplasty: use of postoperative computed tomography-based sections. J Arthroplasty. 2006;21:599–605. doi: 10.1016/j.arth.2005.04.042. [DOI] [PubMed] [Google Scholar]
- Yochum T, Rowe L. Yochum and Rowe’s Essentials of Skeletal Radiology. 3rd edn. Philadelphia: Lippincott Williams and Wilkins; 2005. [Google Scholar]
- Yoder SA, Brand RA, Pedersen DR, et al. Total hip acetabular component position affects component loosening rates. Clin Orthop Relat Res. 1988;228:79–87. [PubMed] [Google Scholar]


