

Abstract
The importance of serum immunoglobulin (Ig)G concentration in IgG replacement therapy for primary immunodeficiency diseases is established in certain settings. Generally, IgG is infused via the intravenous (IVIG) or subcutaneous (SCIG) route. For IVIG infusion, published data demonstrate that higher IgG doses and trough levels provide patients with improved protection from infection. The same conclusions are not yet accepted for SCIG; data from two recent Phase III studies and a recent post-hoc analysis, however, suggest the same correlation between higher SCIG dose and serum IgG concentration and decreased incidence of infection seen with IVIG. Other measures of clinical efficacy have not been considered similarly. Thus, combined analyses of these and other published SCIG studies were performed; a full comparison of the 13 studies was, however, limited by non-standardized definitions and reporting. Despite these limitations, our analyses indicate that certain clinical outcomes improve at higher SCIG doses and associated higher serum IgG concentrations, and suggest that there might be opportunity to improve patient outcomes via SCIG dose adjustment.
Keywords: dose, IgG replacement therapy, immunoglobulin, primary immunodeficiency, subcutaneous
Introduction
Replacement of immunoglobulin (Ig)G is a standard therapy for patients with primary immunodeficiency disease (PIDD) characterized by primary antibody deficiency (PAD). To provide adequate protection from infection, a serum IgG concentration of ≥500 mg/dl following IgG therapy has been recommended [1–3]. Several retrospective studies and one prospective study, however, have shown that higher serum IgG concentrations, resulting from higher doses of intravenous IgG (IVIG), are associated with a decreased incidence of infections [4–6].
To date, most studies on dose–response relationships have focused on IVIG therapy because, since the early 1980s, it has been used more frequently in clinical practice [7]. In 2002, a survey of 1243 patients with PIDD in 16 countries found that 90% of patients were using IVIG compared with only 7% subcutaneous IgG (SCIG) [8]. Studies of different IVIG doses have shown that higher IgG doses lead to higher serum IgG concentrations [2,9] and better clinical outcomes [2,4,5,10]. A recent meta-analysis focused on the diagnosis of pneumonia, the most comparable end-point, in 16 individual studies of IVIG and demonstrated a statistically significant inverse correlation between higher IgG dose and a lower incidence of pneumonia, with a 27% decrease in incidence for every 100 mg/kg increase in dose [5].
Compared to IVIG, there are fewer studies of SCIG treatment regimens. Formerly, subcutaneous SCIG therapy was offered as an alternative for patients with PAD already accustomed to IVIG therapy. SCIG has been a useful option where venous access is difficult or adverse events (AEs) complicate IVIG therapy [11–15], and it is being offered more widely as an alternative to IVIG therapy. Several studies have documented improved health-related quality of life when patients switch from hospital- or office-based IVIG to home-based SCIG, although much of the improvement can be attributed to the convenience of home infusions [12,16,17]. Until recently, consideration of the effects of different doses of SCIG on the rates of infection and other outcome measures has not been possible [18]. Clinical data, however, have been accumulating and now allow for more comprehensive combined analyses.
On converting from IVIG to SCIG replacement therapy for PAD, the equivalent monthly dose of IgG is usually determined in one of two ways: (i) 1:1 dosing, wherein the monthly IVIG dose is split into four equal weekly SCIG infusions; and (ii) area under the curve (AUC) dosing, in which the SCIG dose is calculated from pharmacokinetic data to provide a monthly exposure to IgG equivalent to that with IVIG. The former is common in Europe, while the latter is a requirement of the US Food and Drug Administration (FDA) for SCIG labelling studies. For AUC dosing, the SCIG dose has been 1·37 or 1·53 times higher than the previous IVIG dose [7,19]. Thus, there are two sets of published reports accumulating in the literature: one set reporting results of higher SCIG doses on a mg/kg of body weight basis than the other.
Two recent studies of the same 20% SCIG preparation used different mean doses due to local regulatory requirements. Although not designed or powered to examine dose-related differences in clinical outcomes with SCIG therapy, the results of these studies suggest that higher doses might improve clinical outcomes. An analysis of these two, as well as other clinical studies, with regard to the question of dose and outcome is presented here. We have focused on the relationship between dose, serum IgG concentration and clinical outcomes.
Methods
SCIG studies
We identified 13 studies (Table 1) that provide sufficient data to evaluate possible dose-related outcomes in SCIG therapy that utilized eight different immunoglobulin products. Studies were identified between January and May 2011 using a PubMed search with a combination of key terms that included: SCIG, IgG, dose, infection and subcutaneous. Results were not restricted by publication year, but had to report original data. Only studies which included data on IgG dose, serum IgG concentration and the resulting clinical outcomes were included. To the best of our knowledge, no study meeting these criteria was excluded from the analysis. The selected studies included 12 English-language papers and one translated from Spanish; 12 were prospective clinical trials and one was a retrospective analysis [20]. All studies were open-label, and lasted at least 6 months (Table 1). Patients or their representatives had given informed consent, and all studies were conducted in accordance with the Declaration of Helsinki, the International Conference on Harmonization Guidelines for Good Clinical Practice (ICH-GCP) and local and national requirements, as applicable.
Table 1.
Characteristics of studies of subcutaneous immunoglobulin (SCIG) therapy in patients with primary immunodeficiency disease (PIDD)
| Study (reference) | Product | % IgG | Description | Duration | Primary outcomes | Secondary outcomes |
|---|---|---|---|---|---|---|
| Gardulf et al. 1991 [14] | Gammaglobulin Kabi® | 16·5 | Open-label study to evaluate health-related quality of life associated with SCIG | 6 months hospital treatment, home treatment continuous | Health-related quality of life | Hospitalization |
| Chapel et al. 2000 [13] | Gammabulin® | 16 | Randomized, open-label, international, multi-centre, cross-over study to compare SCIG and IVIG | 24 months (treatment switched after 12 months) | Number and severity of infections | Length of infection, days off work/school |
| Gardulf et al. 2006 [17] | Vivaglobin® | 16 | Prospective, longitudinal, multi-national study to follow patients switching from IVIG to SCIG using AUC dosing | 43 weeks | Serum IgG concentrations | Non-serious infections, AEs |
| Ochs et al. 2006 [7] | Vivaglobin® | 16 | Open-label, prospective, multi-centre study to evaluate the efficacy, safety and tolerability of SCIG | 12 months | SBIs | Non-serious infections, days off work |
| Fasth et al. 2007 [24] | Subcuvia® | 16 | Open-label, prospective, observational study to evaluate the safety and tolerability of home treatment of SCIG | 6 months | Safety, AEs | Infections and quality of life |
| Desai et al. 2009 [22] | Gamunex® | 10 | Open-label, randomized, 2-arm cross-over study to determine the feasibility of comparing IVIG and SCIG | 6 months | Number of acute SBIs | AEs, patient preference for SCIG or IVIG therapy |
| Maroto et al. 2009 [20] | Vivaglobin® | 16 | Open-label, observational, descriptional study to compare the efficacy, safety, quality of life and cost of SCIG and IVIG | 12 months | Trough IgG levels, infections | Quality of life and cost per patient |
| Berger et al. 2010 [16] | Vivaglobin® | 16 | Open-label, uncontrolled study to assess satisfaction and the overall safety and efficacy of maintenance SCIG therapy | 12 months | Health-related quality of life and SBIs | Non-serious infections, AEs |
| Hagan et al. 2010 [19] | Hizentra® | 20 | Open-label, prospective, multi-centre, single-arm, Phase III study to evaluate the efficacy and safety of AUC dosing | 15 months | SBIs | Non-serious infections, days off work/school, days in hospital |
| Thepot et al. 2010 [30] | Subcuvia® | 16 | Longitudinal study to assess the impact of reducing IgG dose while switching from IVIG to SCIG | 12 months | IgG trough level | Hospitalization |
| Gammanorm® | 16·5 | |||||
| Vivaglobin® | 16 | |||||
| Wasserman et al. 2010 [1] | Gamunex® | 10 | Open-label, cross-over study evaluating the suitability of a selected dose conversion factor for the transition to SCIG from IGIV | 44 weeks (28-week efficacy period) | Steady-state AUC of plasma total IgG | SBIs, local AEs |
| Jolles et al. 2011 [25] | Hizentra® | 20 | Open-label, prospective, multi-centre, single-arm, Phase III study to evaluate the efficacy and safety of Hizentra®, 1:1 dosing | 40 weeks (28-week efficacy period) | IgG trough level | SBIs, non-serious infections, days off work/school, days in hospital |
| Wasserman et al. 2011 [23] | Gammagard® | 10 | Open-label, prospective, non-controlled, multi-centre study to evaluate efficacy and tolerability | 12 months (median time) | Pharmacokinetics, SBI | Non-serious infection, AEs |
AE, adverse event; AUC, area under the curve; IgG, immunoglobulin G; SBI, serious bacterial infection; SCIG, subcutaneous IgG.
Efficacy measures
The rate of serious bacterial infection (SBI) was the most common primary efficacy end-point in the studies reviewed. Secondary end-points included overall infections (defined as infections not meeting SBI criteria), missed days of work or school, days in hospital and days on antibiotics. Definitions of overall infections and SBIs were not standardized across studies. In six studies, SBIs were defined by FDA criteria [21] and included bacterial pneumonia, meningitis, sepsis, osteomyelitis or visceral abscess [1,7,17,19,22,23]. In two studies, an SBI was defined as an infection requiring hospitalization [20,24].
Overall infections were generally physician-defined [7,17,19,20], and in one study included febrile episodes with body temperature >38·5°C [7]. In one study, each patient kept a diary of symptoms that was reviewed by the physician to confirm an infection [22]. In another study, overall infection was defined as any clinical sign or symptom of infection supported by a C-reactive protein measurement [24]. In contrast, a third study defined overall infection as at least two of the following features being present: body temperature >37°C, symptoms related to site of infection, positive bacterial culture or C-reactive protein >50 mg/l [13]. This study did not report the annual rate of infection; rather, an infection score was calculated, in which infections were weighted as major = 2, moderate = 1 or mild = 0.
In order to avoid inappropriate bias, a comparison of annualized rate (events per patient per year) was performed for SBIs, overall infections, days in hospital, missed days of work or school and days on antibiotics. However, it should be noted that criteria for hospital admission or use of antibiotics for treatment and/or prophylaxis of infections were not standardized. Data on all efficacy parameters were not available in all studies. Thus, the number of individual studies used in each analysis was not consistent (see Table 2).
Table 2.
Results of studies of subcutaneous immunoglobulin (SCIG) therapy in patients with primary immunodeficiency (PI)
| Study (reference) | Number of patients | IgG dose mg/kg/month | IgG serum concentration mg/dl | SBI events/pt/y | Infections events/pt/y | Missed work days/pt/y | Hospitalization days/pt/y | Local AEs events/infusion |
|---|---|---|---|---|---|---|---|---|
| Gardulf et al. 1991 [14] | 25 | 400 | 810 | n.a. | n.a. | n.a. | 0·2 | n.a. |
| Chapel et al. 2000 [13] | 30 | 589·5 | 855 | 0·019 | 3·82 | 12 | n.a. | 0·084 |
| Gardulf et al. 2006 [17] | 52 | 400 | 926 | 0·04 | 4·52 | n.a. | n.a. | 0·280† |
| Ochs et al. 2006 [7] | 65 | 632 | 1040 | 0·04 | 4·43 | 3·7 | 0·23 | 0·49 |
| Fasth et al. 2007 [24] | 12 | 436 | 1232·5 | 0 | 2 | n.a. | n.a. | n.a. |
| Desai et al. 2009 [22] | 12 | n.a. | 1160 | 0·091 | 4·72 | n.a. | n.a. | 0·697‡ |
| Maroto et al. 2009 [20] | 11 | 408 | 831·27 | 0 | 2·22 | n.a. | n.a. | 0·089 |
| Berger et al. 2010 [16] | 51 | n.a. | 1137·8 | 0·03 | 3·42 | 4·5 | n.a. | 0·119‡ |
| Hagan et al. 2010 [19] | 49 | 807·2 | 1253 | 0 | 2·76 | 2·06 | 0·2 | 0·592 |
| Thepot et al. 2010 [30] | 65 | 432 | 882 | n.a. | n.a. | n.a. | 1·19 | n.a. |
| Wasserman et al. 2010 [1] | 32 | n.a. | 1140 | 0 | 4·1 | n.a. | n.a. | 0·580 |
| Jolles et al. 2011 [25] | 46 | 474·8 | 810 | 0 | 5·18 | 8 | 3·48 | 0·060 |
| Wasserman et al. 2011 [23] | 32 | 730·4 | 1202 | 0·067 | 4·1 | 4 | 0 | 0·028 |
Proportion of infusions with local AEs.
Proportion of infusion sites for which local AEs were reported. n.a., data not available; pt, patient; y, year; kg, kilogram (body weight).
Tolerability measures
Tolerability end-points included local AEs and selected systemic AEs. In most studies, investigators monitored AEs during visits or reviewed them based on patient diaries [1,16,17,19,22]. In several studies, no drug-related serious AEs were reported [5–7,19,20,22,23,25]. Where specified, local AEs were defined as preferred terms in the Medical Dictionary for Regulatory Activities (MedDRA) that included the infusion/injection site [19]. In the analyses reported here, both systemic AEs and local AEs were calculated as events per infusion.
Statistical methodology
Due to differences in definitions and reporting, statistical analyses were restricted to dosing, serum IgG concentration and infection rate. Basic statistical analyses and graphing were undertaken using Microsoft Excel®; for non-parametric and weighted data analysis and graphing, the r Statistical Package [26] was used. For all tests, a P-value ≤ 0·05 was used to define significance. In addition to the formal statistical analysis, the qualitative data trends are discussed.
The relationships between IgG dose and clinical outcome data were analysed using the Pearson correlation. The degree of the linear relationship between the two variables is given by the Pearson product–moment correlation co-efficient (r). The analysis of variance (anova) test was used to report the significance (P) of data correlation. In each case, the r- and P-values are reported.
The number of patients (n) in the studies ranged from 11 to 65. In order to account for the sample size, weighted regression statistics were calculated, using a weight of ✓n to provide more emphasis on data from studies involving more patients [27]. In this case, a study with population size 11 has a weight of 3·3, whereas a study with population size of 65 has a weight of 8·1. Where an analysis is displayed graphically, the weight given to each study is represented by the area of the circle, for which the radius = ✓(n/π).
The two methods of dose calculation from IVIG (1:1 and AUC) were compared using the non-parametric, Welch two-sample, one-sided t-test.
For comparison of efficacy end-points between the US and European Hizentra® studies, a log ratio  was used. Given that
  , the log ratio, unlike a simple ratio, produces a symmetrical distribution about zero and facilitates data comparison.
Results
In total, data from 482 patients representing more than 27 500 infusions (data not provided in all cases) were analysed. In most studies, SCIG was administered once or twice a week; in one study, SCIG was administered at a frequency of once or twice weekly to once every 2 weeks [24]. The overall median SCIG dose infused was 455·4 mg/kg/month (range 400–807·2 mg/kg/month).
Clinical studies: similar design, different dose
In two recent clinical studies of a 20% liquid preparation, IgPro20 (Hizentra®; CSL Behring, King of Prussia, PA, USA), with similar study design, patients in the United States and Europe received markedly different mean IgG doses. This difference was a feature of two variables: the first was the different doses on which patients were maintained by their physicians before enrolling into the study and the second was a dose adjustment to ensure equivalent AUC in accordance with local regulations governing study design [19,25]. In the US study (n = 38), the mean IgG dose during the efficacy phase of the study was 807·2 mg/kg/month and was derived from individual prior monthly IVIG doses using an adjustment calculated to yield an AUC on SCIG equivalent to that on previous IVIG therapy [19]. In the European study (n = 46), the mean IgG dose was 474·8 mg/kg/month and was obtained using a 1:1 conversion from the individual prior monthly doses [25]. Patients in the US study achieved higher serum IgG concentrations, spent fewer days in hospital and had fewer missed days of work or school (Fig. 1). US patients using the higher doses spent a mean of 0·20 days per patient per year in hospital compared to 3·48 days per patient per year for European patients using the lower doses. Similarly, patients in the US study missed only 2·06 days of work or school per patient per year compared with patients in the European study, who missed 8·00 days per patient per year. Antibiotic treatment was used on 49 and 73 days per patient per year in the United States and European studies, respectively.
Fig. 1.
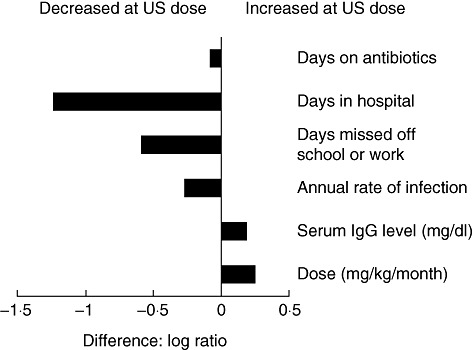
Suggested dose-related response in two recent clinical studies. The higher immunoglobulin (Ig)G dose in the Hizentra® US study [19] resulted in an increased serum IgG concentration and reduced days on antibiotics, days in hospital, days off work/school and non-serious infections. The x-axis shows the log ratio  between efficacy indicators in the US and European trials [25].
These two studies, however, were not powered to evaluate the relationship between dose and outcomes. The definition of SBI was the only measure defined specifically in both studies; overall infections were defined according to the individual investigator's discretion. The results may therefore reflect country-specific medical practices such as criteria for admission and length of stay in hospital, and cultural thresholds for missing work or school. Moreover, these studies, as did most studies in PAD, enrolled primarily patients with common variable immunodeficiency (CVID) and X-linked agammaglobulinaemia (XLA). CVID is a phenotypic diagnosis and encompasses a variety of mixed aetiologies and immunological severities [28]. Different numbers of patients with CVID were included in these studies, and neither the underlying immunological diagnosis nor the presence of pre-existing bronchiectasis or other complications was controlled for specifically in individual studies. Therefore, the morbidity within the cohorts may have differed, potentially impacting outcome. Of note, the pre-study IgG doses differed between the two studies (576 mg/kg/month in the US study compared with 488 mg/kg/month in the European study [29]).
Overall, five of the studies reviewed here used doses adjusted to achieve matching AUC (US studies) [1,7,16,19,23], five used 1:1 dosing [13,17,22,24,25], and three used other methods [14,20,30]. Factors influencing the selection of the IVIG dose before enrolment were not standardized. In the US studies, adjusted monthly doses were 1·37 [1,16] to 1·53 [19] times higher than the previous monthly IVIG doses and resulted in serum IgG concentrations up to 25% higher than those achieved with previous IVIG therapy [16]. Using the Welch two-sample, unpaired, one-tailed t-test we found that, as expected, both the SCIG doses (P = 0·008) and serum IgG concentrations (P = 0·071) were significantly higher in patients receiving doses adjusted to achieve matching AUC compared to those receiving doses equivalent to previous IVIG treatment.
Dose and IgG level in published SCIG studies
Ten studies provided data for evaluation of the relationship between dose and steady-state serum IgG concentration, defined as IgG concentration measured before SCIG infusion (it should be noted that, once patients are stabilized on a given weekly SCIG dose, fluctuations in the serum IgG level within each dosing interval are minimal – generally <5% of the mean [31]). The mean IgG dose in these studies was 455·4 mg/kg/month (range 400–807·2 mg/kg/month). As found for IVIG therapy, and as expected following comparison of the two Hizentra® trials, higher SCIG doses resulted in higher serum IgG concentrations. No corrections were made for individual patient baseline IgG concentration. The change from baseline in IgG levels might be expected to correlate more accurately with the dose, but these data are not available. Nevertheless, the serum IgG levels correlated positively and significantly (r = 0·746, P = 0·013) with the SCIG doses (Fig. 2). This corresponded to an increase in serum IgG concentration of 84·4 mg/dl for every increase in SCIG dose of 100 mg/kg/month.
Fig. 2.
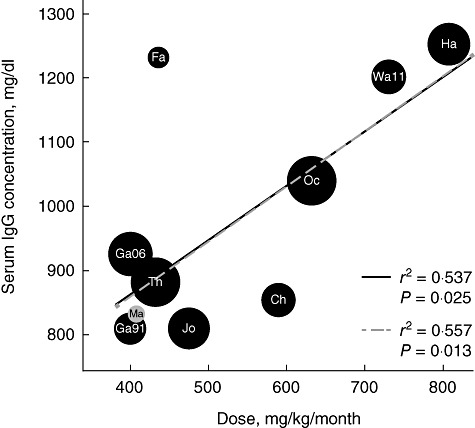
Subcutaneous immunoglobulin (SCIG) dose and serum IgG concentration. Higher SCIG doses were correlated significantly with higher serum IgG concentrations (r = 0·746, P = 0·013). Mean, median and mean of median data provided in [7,13,17,20,24,25] were analysed. The outlier [24] might occur because no washout period was incorporated between intravenous immunoglobulin (IVIG) and SCIG therapy and the serum IgG concentration range for months 0–6 was provided. Black circles are prospective clinical trials, and the grey circle is the only retrospective study: Maroto et al. [20]. The solid trendline represents the weighted regression excluding Maroto et al.; the dashed trendline includes data from Maroto et al. Circles are sized proportionally to the number of patients in the study, with text overlay indicating the study: Chapel 2000 (Ch), Fasth 2007 (Fa), Gardulf 1991 (Ga91), Gardulf 2006 (Ga06), Hagan 2010 (Ha), Jolles 2011 (Jo), Maroto 2008 (Ma), Ochs 2006 (Oc), Thepot 2010 (Th) and Wasserman 2011 (Wa11).
IgG level and rate of SBIs
The rate of SBIs was reported in 11 studies. SBIs were rare in all studies and some reported none [19,20,24,25]. No correlation was found between IgG dose nor serum IgG concentration, and the annual rate of SBIs. This might be due, at least in part, to the different definitions of SBI used and the low overall SBI rate in these studies (0–0·091 SBI/patient/year). Only one [22] of the five studies using a 6-month efficacy period recorded an SBI, and it could not be assigned with certainty to the SCIG or IVIG phase. In comparison, five of nine studies (56%) that lasted more than 6 months reported an SBI [7,13,16,17,23]. Even with six total SBIs, however, a meaningful analysis of predictive risks and/or associations was not possible. This attests to the fact that immunoglobulin replacement therapy in general is effective in preventing SBIs in PAD.
IgG level and rate of overall infections
In contrast to the low incidence of SBIs, there was a higher number of overall infections in the individual studies of SCIG replacement therapy, thus enabling further analysis. The combined results suggest that annualized rate of overall infection correlated inversely with serum IgG concentrations. This correlation was not significant (r = −0·438, P = 0·178) when all 11 studies with available data were considered. When the single retrospective study [20] was excluded, however, and only the prospective studies were considered, the correlation was significant (r = −0·682, P = 0·030, Fig. 3). This corresponds to a decrease in the annual rate of infection of 0·38 events/patient/year for every 100 mg/dl increase in serum IgG concentration. In the retrospective study, only infections recorded by a clinician when the patient was in hospital were reported. This could have led to an under-reporting bias in that study compared with the prospective studies, in which the majority of events was recorded in ongoing patient logs.
Fig. 3.
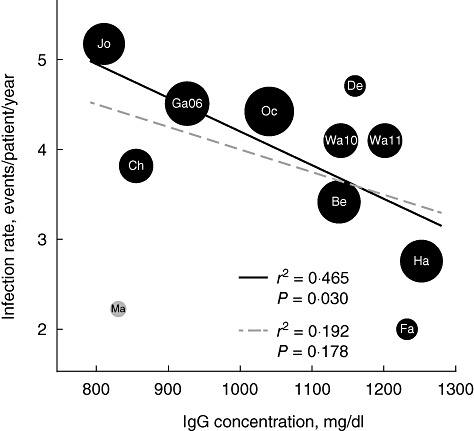
Rate of infection and steady-state immunoglobulin (Ig)G level. A higher serum IgG concentration results in a lower rate of non-serious infection. The correlation is significant (P = 0·030) when only clinical trial data are included. Significance is lost when the retrospective study by Maroto et al. is included (P = 0·178). Black circles are clinical trials and the grey circle is the retrospective study. The solid trendline represents the weighted regression excluding Maroto et al.; the dashed trendline includes data from Maroto et al. Circles are sized proportionally to the number of patients in the study, with text overlay indicating the study: Berger 2009 (Be), Chapel 2000 (Ch), Desai 2009 (De), Fasth 2007 (Fa), Gardulf 2006 (Ga06), Hagan 2010 (Ha), Jolles 2011 (Jo), Maroto 2008 (Ma), Ochs 2006 (Oc), Wasserman 2010 (Wa10) and Wasserman 2011 (Wa11).
Despite the strong correlations between SCIG dose and IgG level, and between IgG level and the annualized rate of infections, the relationship between SCIG dose and annualized rate of infection was weak and not significant. Although a correlation seems apparent on visual inspection (Fig. 4), this relationship did not achieve statistical significance, even when the retrospective study was excluded. Further data in large cohorts with standardized definitions of infection would be required to confirm or refute a significant correlation.
Fig. 4.
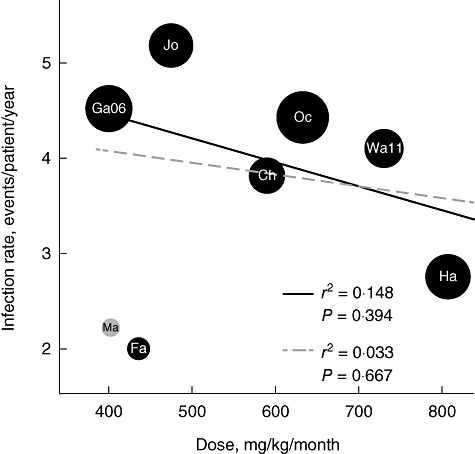
Subcutaneous immunoglobulin (SCIG) dose and rate of infection. The SCIG dose did not correlate with the rate of infection. However, data from the larger clinical trials (black circles) suggest that under these conditions SCIG dose might be linked to infection rate. Black circles are clinical trials and the red circle the retrospective study. The solid trendline represents the weighted regression excluding Maroto et al.; the dashed trendline includes data from Maroto et al. Circles are sized proportionally to the number of patients in the study, with text overlay indicating the study: Chapel 2000 (Ch), Fasth 2007 (Fa), Gardulf 2006 (Ga06), Hagan 2010 (Ha), Jolles 2011 (Jo), Maroto 2008 (Ma), Ochs 2006 (Oc) and Wasserman 2011 (Wa11).
Other indicators of efficacy
Not all publications describing effect of SCIG administration for PAD reported the same secondary efficacy indicators. However, there was overlap in some studies, including: days in hospital (n = 6) [7,14,19,23,25,30], missed days of work or school (n = 6) [7,13,14,16,19,23], days on antibiotics (n = 4) [7,14,19,23,25] and days of infection (n = 2) [7,13] (Table 2). Apparent relationships were found between SCIG dose and days in hospital and days missed of work or school, but these did not reach significance. The correlations between serum IgG concentration and these efficacy end-points were stronger, but also failed to reach statistical significance. The qualitative trends appeared to support further consideration of dose-related responses once sufficient comparable data become available for these end-points. At this time, available data prevent drawing a formal conclusion.
Adverse events
Systemic AEs are known to occur at lower frequency in SCIG than in IVIG therapy [12,14,15,23]. Relationships between systemic AEs and SCIG dose, or resulting IgG serum level, have not been described. In the studies included in this analysis, the frequency of systemic AEs was not influenced by the SCIG dose infused.
Local AEs are common in SCIG therapy but decrease over time, a finding that is supported by all studies reviewed here for which data or comment were available [1,7,14,16,17,19,20,23,24]. There was no increase in severe local AEs with higher doses reported in the literature [19,25]. As observed in the two trials of Hizentra®, local AEs reported in the studies analysed were mainly of mild intensity. An attempt was made to correlate local AEs to the SCIG dose and resulting serum IgG level. Unfortunately, local AEs could not be compared between studies due to different reporting, characterization and/or consideration of these events among the studies considered.
Discussion
Relationships between IgG dose, IgG trough level and clinical outcomes in IVIG therapy have been demonstrated repeatedly in individual studies [2,9,10,32]. However, comparisons between different studies are difficult for a number of reasons, including heterogeneity of patients' underlying diagnoses and conditions, different dosing schemes and differences in definitions used for outcome variables. Nevertheless, sufficient agreement between studies could be found to permit meta-analysis of the relationships between IVIG dose, serum IgG level and the incidence of pneumonia [5]. Our present analysis indicated that a similar relationship between serum IgG concentration and dose holds for SCIG replacement therapy in PAD: we found an increase in serum IgG concentration of 84·4 mg/dl for every increase in SCIG dose of 100 mg/kg/month. The corresponding increase for IVIG therapy was calculated to be 121 mg/dl per 100 mg/kg/month [5]. The smaller increase in serum IgG concentrations with SCIG therapy may be related to the lower serum bioavailability of SCIG compared to IVIG [31,33,34]; however, in the European IgPro20 study, patients switching from previous IVIG therapy achieved a 17·7% increase in steady-state serum IgG levels at the same IgG dose [25]. In addition, the distribution of doses in this analysis (400–807·2 mg/kg/month) and the meta-analysis by Orange et al. (0–600 mg/kg/month) [5] differed substantially and could, potentially, have affected the slope of the curve and the calculated IgG increase. It cannot be excluded that the different IgG concentrations of the products may have influenced the results. The available data do not allow a comparison of 10, 16 and 20% SCIG products.
While the meta-analysis of IVIG identified a relationship between serum IgG concentration and pneumonia incidence, we did not find such a relationship when combining the studies we analysed, probably because of the very low incidence of pneumonia and other SBIs reported in these studies. However, when the rate of infections not meeting the criteria for SBIs was examined, we identified a significant inverse correlation between the annual rate of infection and the serum IgG concentrations in prospective studies. We did not find a statistically significant relationship between dose and infection rate, which is distinct from that identified for pneumonia in the IVIG meta-analysis. As SCIG dose correlated with serum IgG level, this may represent a lack of appropriate power to define this association. It may, however, point to a more complex relationship between SCIG dose and steady-state serum IgG level than that existing between IVIG dose and serum IgG trough. Compared to IVIG, which is administered in established 3- or 4-weekly regimens, SCIG replacement therapy is administered in a variety of ways, with dose, frequency of infusions and number and location of infusion sites each potentially affecting the uptake of IgG into the bloodstream. This may have important implications for the individualization of SCIG therapy for patients with PAD. The financial ramifications of dose adjustments need to be in balance with potential clinical impact, but this represents a separate topic that warrants its own specific analysis now that these results are available.
In our combined analyses, we also gained insight from comparing studies specifically designed to meet regulatory agencies' criteria for licensing in particular jurisdictions, other prospective studies and a retrospective study. The differences between these and variability in study designs in general, as well as in definitions of outcome measures, suggest that a more careful definition of end-points would have probably improved our ability to extract general conclusions. Given the relative rarity of patients with PAD and the expense of conducting studies, more standardized primary and secondary outcome measures would represent great value to clinicians and ultimately their ability to optimize and scientifically evaluate therapy for patients. For instance, it would be helpful to use an agreed definition of infection or particular categorization of infections, and provide more details regarding the infections course and the impact of infections on the overall clinical situation. Secondary efficacy end-points, such as days in hospital due to infection, missed days of work or school and days on antibiotic treatment, have become useful tools for efficacy evaluation and should be included in all future clinical trials. A sufficient and more uniform description of AEs would certainly contribute to the field. An agreed minimum of health-related quality of life measures would be helpful in understanding the patients' view on treatment.
It is evident from the present evaluation that serum IgG concentrations achieved in all these studies generally provided adequate protection from SBI. As the rate of SBI becomes less discriminatory, more sensitive measures are needed to discern differences between therapeutic approaches. Given the other non-standardized measures of efficacy used, it is difficult to evaluate and compare trials precisely. This experience supports the development of new standards for the comparison of such clinical trial data.
Most of the clinical studies used in the present analysis based their SCIG dose calculation on previous therapy. Two studies sought only to maintain the IgG trough level obtained on previous IVIG therapy [20,30]. In some cases, the serum IgG concentration could be maintained with SCIG therapy using a lower monthly dose [20,30]. Unfortunately, it is difficult to assess the impact of that approach on clinical outcomes based on the available data. One of these studies found no difference in the annual rate of overall infection between IVIG and SCIG [20]. The second study [30] provided no data on overall infections or other secondary outcome measures, and reported instead that hospitalizations were higher on IVIG than on SCIG therapy. Hospitalization represents a relatively severe outcome in PAD and thorough re-evaluation of this practice is probably indicated, utilizing more sensitive measures.
On switching from IVIG to SCIG, 1:1 dosing increased serum IgG concentrations compared to previous IVIG therapy [20,25,30]. Doses adjusted to maintain the AUC were significantly higher than those with 1:1 dosing and resulted in significantly higher serum IgG concentrations compared with previous therapy. Results reported here showed that higher serum IgG concentrations were associated with improvement in some clinical outcome measures. Differences in the incidence of hospitalization and in days lost from work or school may have important pharmacoeconomic implications. These variables can be influenced heavily by geographical and/or country-specific cultural differences and local standards of medical care. The trends are of interest but, because of the limitations in the methodology discussed above, the lack of significance in some instances begs the need for additional studies using defined and more sensitive outcome measures. An analysis of the serum levels of antibodies against pathogens common in PAD patients may offer further insights, and merits a separate evaluation.
Conclusions
Analysis of clinical results available to date supports consideration of higher SCIG doses and serum IgG concentrations (as it does for the use of IVIG) to improve clinical outcomes in individual patients with PAD. While conclusions cannot be drawn in all cases because of the lack of comparable data and statistical significance, it should be noted that none of the studies analysed herein was designed to determine the optimal SCIG replacement dose. Indeed, there is no agreement on how to define an ‘optimal’ dose, nor are there adequate data available on what that dose might be. Physicians should maintain reasonable expectations for the ability of optimal IgG replacement to minimize infection in their PIDD patients and should continually seek opportunities to improve the outcome for individual patients. Efforts to standardize measures and reporting to enable further analysis should be encouraged.
Acknowledgments
Grant support was provided by CSL Behring. The editorial assistance of PHOCUS Services Ltd, supported by CSL Behring, is acknowledged.
Disclosure
Dr Orange is a consultant to Baxter Healthcare Corp., Talecris Biotherapeutics and CSL Behring, a member of the review panel for Octapharma and a member of the advisory board for IBT reference laboratories; Dr Borte reports consultant fees from CSL Behring and Baxter and honoraria for lectures from CSL Behring, Baxter and Octapharma; Dr Hagan declares clinical trial support from CSL Behring and Medimmune and is chairman of the Dyax Post-Marketing Adverse Event Adjudication Panel; Dr Jolles has received clinical trial support from CSL Behring, Baxter and Octapharma and consultant fees from Baxter, Octapharma, Shire, Swedish Orphan Biovitrum, Meda UK and Biotest; Dr Wasserman has served as investigator and consultant for Baxter BioScience, CSL Behring, NABI, Omrix and Talecris; Dr Grimbacher is a member of the IgPro20 Steering Committee and Advisory Boards and has received honoraria for presentations from Baxter and Grifols; Dr Berger and Dr Baggish are employees of CSL Behring; Dr Saunders is an employee of PHOCUS Services Ltd, part of the Fishawack Group of Companies. No other potential conflicts of interest were reported.
References
- 1.Wasserman RL, Irani AM, Tracy J, et al. Pharmacokinetics and safety of subcutaneous immune globulin (human), 10% caprylate/chromatography purified in patients with primary immunodeficiency disease. Clin Exp Immunol. 2010;161:518–26. doi: 10.1111/j.1365-2249.2010.04195.x. [DOI] [PMC free article] [PubMed] [Google Scholar]
- 2.Eijkhout HW, van der Meer JW, Kallenberg CG, et al. The effect of two different dosages of intravenous immunoglobulin on the incidence of recurrent infections in patients with primary hypogammaglobulinemia. A randomized, double-blind, multicenter crossover trial. Ann Intern Med. 2001;135:165–74. doi: 10.7326/0003-4819-135-3-200108070-00008. [DOI] [PubMed] [Google Scholar]
- 3.Bonilla FA. Intravenous immunoglobulin: adverse reactions and management. J Allergy Clin Immunol. 2008;122:1238–9. doi: 10.1016/j.jaci.2008.08.033. [DOI] [PubMed] [Google Scholar]
- 4.Lucas M, Lee M, Lortan J, Lopez-Granados E, Misbah S, Chapel H. Infection outcomes in patients with common variable immunodeficiency disorders: relationship to immunoglobulin therapy over 22 years. J Allergy Clin Immunol. 2010;125:1354–60. doi: 10.1016/j.jaci.2010.02.040. [DOI] [PubMed] [Google Scholar]
- 5.Orange JS, Grossman WJ, Navickis RJ, Wilkes MM. Impact of trough IgG on pneumonia incidence in primary immunodeficiency: a meta-analysis of clinical studies. Clin Immunol. 2010;137:21–30. doi: 10.1016/j.clim.2010.06.012. [DOI] [PubMed] [Google Scholar]
- 6.Quinti I, Soresina A, Guerra A, et al. Effectiveness of immunoglobulin replacement therapy on clinical outcome in patients with primary antibody deficiencies: results from a multicenter prospective cohort study. J Clin Immunol. 2011;31:315–22. doi: 10.1007/s10875-011-9511-0. [DOI] [PubMed] [Google Scholar]
- 7.Ochs HD, Gupta S, Kiessling P, Nicolay U, Berger M. Safety and efficacy of self-administered subcutaneous immunoglobulin in patients with primary immunodeficiency diseases. J Clin Immunol. 2006;26:265–73. doi: 10.1007/s10875-006-9021-7. [DOI] [PubMed] [Google Scholar]
- 8.Quinti I, Pierdominici M, Marziali M, et al. European surveillance of immunoglobulin safety results of initial survey of 1243 patients with primary immunodeficiencies in 16 countries. Clin Immunol. 2002;104:231–6. doi: 10.1006/clim.2002.5239. [DOI] [PubMed] [Google Scholar]
- 9.Ochs HD, Fischer SH, Wedgwood RJ, et al. Comparison of high-dose and low-dose intravenous immunoglobulin therapy in patients with primary immunodeficiency diseases. Am J Med. 1984;76:78–82. doi: 10.1016/0002-9343(84)90324-3. [DOI] [PubMed] [Google Scholar]
- 10.Roifman CM, Levison H, Gelfand EW. High-dose versus low-dose intravenous immunoglobulin in hypogammaglobulinaemia and chronic lung disease. Lancet. 1987;1:1075–7. doi: 10.1016/s0140-6736(87)90494-6. [DOI] [PubMed] [Google Scholar]
- 11.Moore ML, Quinn JM. Subcutaneous immunoglobulin replacement therapy for primary antibody deficiency: advancements into the 21st century. Ann Allergy Asthma Immunol. 2008;101:114–21. doi: 10.1016/S1081-1206(10)60197-4. [DOI] [PubMed] [Google Scholar]
- 12.Moore ML, Quinn JM. Subcutaneous immunoglobulin therapy in pediatric primary antibody deficiency. Pediatr Health. 2009;3:231–40. [Google Scholar]
- 13.Chapel HM, Spickett GP, Ericson D, Engl W, Eibl MM, Bjorkander J. The comparison of the efficacy and safety of intravenous versus subcutaneous immunoglobulin replacement therapy. J Clin Immunol. 2000;20:94–100. doi: 10.1023/a:1006678312925. [DOI] [PubMed] [Google Scholar]
- 14.Gardulf A, Hammarstrom L, Smith CI. Home treatment of hypogammaglobulinaemia with subcutaneous gammaglobulin by rapid infusion. Lancet. 1991;338:162–6. doi: 10.1016/0140-6736(91)90147-h. [DOI] [PubMed] [Google Scholar]
- 15.Borte M, Bernatowska E, Ochs HD, Roifman CM. Efficacy and safety of home-based subcutaneous immunoglobulin replacement therapy in paediatric patients with primary immunodeficiencies. Clin Exp Immunol. 2011;164:357–64. doi: 10.1111/j.1365-2249.2011.04376.x. [DOI] [PMC free article] [PubMed] [Google Scholar]
- 16.Berger M, Murphy E, Riley P, Bergman GE. Improved quality of life, immunoglobulin G levels, and infection rates in patients with primary immunodeficiency diseases during self-treatment with subcutaneous immunoglobulin G. South Med J. 2010;103:856–63. doi: 10.1097/SMJ.0b013e3181eba6ea. [DOI] [PubMed] [Google Scholar]
- 17.Gardulf A, Nicolay U, Asensio O, et al. Rapid subcutaneous IgG replacement therapy is effective and safe in children and adults with primary immunodeficiencies – a prospective, multi-national study. J Clin Immunol. 2006;26:177–85. doi: 10.1007/s10875-006-9002-x. [DOI] [PubMed] [Google Scholar]
- 18.Berger M. Incidence of infection is inversely related to steady-state (trough) serum IgG level in studies of subcutaneous IgG in PIDD. J Clin Immunol. 2011;31:924–6. doi: 10.1007/s10875-011-9546-2. [DOI] [PubMed] [Google Scholar]
- 19.Hagan JB, Fasano MB, Spector S, et al. Efficacy and safety of a new 20% immunoglobulin preparation for subcutaneous administration, IgPro20, in patients with primary immunodeficiency. J Clin Immunol. 2010;30:734–45. doi: 10.1007/s10875-010-9423-4. [DOI] [PMC free article] [PubMed] [Google Scholar]
- 20.Maroto HM, Soler PP, Martin NN, Oliveras AM, Espanol BT, Figueras NC. Subcutaneous gammaglobulin in common variable immunodeficiency. First experience in Spain. An Pediatr (Barc) 2009;70:111–9. doi: 10.1016/j.anpedi.2008.11.011. [DOI] [PubMed] [Google Scholar]
- 21.US Food and Drug Administration (FDA) FDA Guidance for industry: safety, efficacy, and pharmacokinetic studies to support marketing of immune globulin intravenous (human) as replacement therapy for primary humoral immunodeficiency. 2008. Available at: http://www.fda.gov/downloads/BiologicsBloodVaccines/GuidanceComplianceRegulatoryInformation/Guidances/Blood/ucm078526.pdf (accessed 12 December 2011)
- 22.Desai SH, Chouksey A, Poll J, Berger M. A pilot study of equal doses of 10% IGIV given intravenously or subcutaneously. J Allergy Clin Immunol. 2009;124:854–6. doi: 10.1016/j.jaci.2009.07.051. [DOI] [PubMed] [Google Scholar]
- 23.Wasserman RL, Melamed I, Kobrynski L, et al. Efficacy, safety, and pharmacokinetics of a 10% liquid immune globulin preparation (Gammagard Liquid, 10%) administered subcutaneously in subjects with primary immunodeficiency disease. J Clin Immunol. 2011;31:323–31. doi: 10.1007/s10875-011-9512-z. [DOI] [PubMed] [Google Scholar]
- 24.Fasth A, Nystrom J. Safety and efficacy of subcutaneous human immunoglobulin in children with primary immunodeficiency. Acta Paediatr. 2007;96:1474–8. doi: 10.1111/j.1651-2227.2007.00485.x. [DOI] [PubMed] [Google Scholar]
- 25.Jolles S, Bernatowska E, de Gracia J, et al. Efficacy and safety of Hizentra® in patients with primary immunodeficiency after a dose-equivalent switch from intravenous or subcutaneous replacement therapy. Clin Immunol. 2011;141:90–102. doi: 10.1016/j.clim.2011.06.002. [DOI] [PubMed] [Google Scholar]
- 26.R Development Core Team. r: a language and environment for statistical computing. R Foundation for Statistical Computing. 2011. Available at: http://www.R-project.org (accessed 7 December 2011)
- 27.Chambers JM. Linear models. In: Chambers J, Hastie TJ, editors. Statistical models. Pacific Grove, CA: Wadsworth & Brooks/Cole; 1992. pp. 95–145. [Google Scholar]
- 28.Yong PFK, Thaventhiran JED, Grimbacher B. ‘A rose is a rose is a rose,’ but CVID is not CVID: common variable immune deficiency (CVID), what do we know in 2011? Adv Immunol. 2011;111:47–107. doi: 10.1016/B978-0-12-385991-4.00002-7. [DOI] [PubMed] [Google Scholar]
- 29.Haddad E, Berger M, Wang EC, Jones CA, Bexon M, Baggish JS. Higher doses of subcutaneous IgG reduce resource utilization in patients with primary immunodeficiency. J Clin Immunol. 2012;32:281–9. doi: 10.1007/s10875-011-9631-6. [DOI] [PMC free article] [PubMed] [Google Scholar]
- 30.Thepot S, Malphettes M, Gardeur A, et al. Immunoglobulin dosage and switch from intravenous to subcutaneous immunoglobulin replacement therapy in patients with primary hypogammaglobulinemia: decreasing dosage does not alter serum IgG levels. J Clin Immunol. 2010;30:602–6. doi: 10.1007/s10875-010-9417-2. [DOI] [PubMed] [Google Scholar]
- 31.Berger M, Rojavin M, Kiessling P, Zenker O. Pharmacokinetics of subcutaneous immunoglobulin and their use in dosing of replacement therapy in patients with primary immunodeficiencies. Clin Immunol. 2011;139:133–41. doi: 10.1016/j.clim.2011.01.006. [DOI] [PubMed] [Google Scholar]
- 32.Roifman CM, Schroeder H, Berger M, et al. Comparison of the efficacy of IGIV-C, 10% (caprylate/chromatography) and IGIV-SD, 10% as replacement therapy in primary immune deficiency. A randomized double-blind trial. Int Immunopharmacol. 2003;3:1325–33. doi: 10.1016/s1567-5769(03)00134-6. [DOI] [PubMed] [Google Scholar]
- 33.Misbah S, Sturzenegger MH, Borte M, et al. Subcutaneous immunoglobulin: opportunities and outlook. Clin Exp Immunol. 2009;158(Suppl. 1):51–9. doi: 10.1111/j.1365-2249.2009.04027.x. [DOI] [PMC free article] [PubMed] [Google Scholar]
- 34.Waniewski J, Gardulf A, Hammarstrom L. Bioavailability of gamma-globulin after subcutaneous infusions in patients with common variable immunodeficiency. J Clin Immunol. 1994;14:90–7. doi: 10.1007/BF01541341. [DOI] [PubMed] [Google Scholar]