

Background: Switching from the acute early initiation to late adaptation response after TLR4 stimulation depends on SirT1.
Results: Switching from glucose to fatty acid oxidation between initiation and adaptation responses requires SirT6 and SirT1.
Conclusion: Bioenergy integrates metabolism and acute inflammation.
Significance: Understanding bioenergy shifts during inflammation may enable development of new therapies.
Keywords: Bioenergetics, Biosensors, Macrophages, Metabolism, NAD, Sepsis, Sirtuins, HIF-1α, PGC-1, Acute Inflammation
Abstract
The early initiation phase of acute inflammation is anabolic and primarily requires glycolysis with reduced mitochondrial glucose oxidation for energy, whereas the later adaptation phase is catabolic and primarily requires fatty acid oxidation for energy. We reported previously that switching from the early to the late acute inflammatory response following TLR4 stimulation depends on NAD+ activation of deacetylase sirtuin 1 (SirT1). Here, we tested whether NAD+ sensing by sirtuins couples metabolic polarity with the acute inflammatory response. We found in TLR4-stimulated THP-1 promonocytes that SirT1 and SirT 6 support a switch from increased glycolysis to increased fatty acid oxidation as early inflammation converts to late inflammation. Glycolysis enhancement required hypoxia-inducing factor-1α to up-regulate glucose transporter Glut1, phospho-fructose kinase, and pyruvate dehydrogenase kinase 1, which interrupted pyruvate dehydrogenase and reduced mitochondrial glucose oxidation. The shift to late acute inflammation and elevated fatty acid oxidation required peroxisome proliferator-activated receptor γ coactivators PGC-1α and β to increase external membrane CD36 and fatty acid mitochondrial transporter carnitine palmitoyl transferase 1. Metabolic coupling between early and late responses also required NAD+ production from nicotinamide phosphoryltransferase (Nampt) and activation of SirT6 to reduce glycolysis and SirT1 to increase fatty oxidation. We confirmed similar shifts in metabolic polarity during the late immunosuppressed stage of human sepsis blood leukocytes and murine sepsis splenocytes. We conclude that NAD+-dependent bioenergy shifts link metabolism with the early and late stages of acute inflammation.
Introduction
Acute systemic inflammation associated with sepsis involves a sequential shift between the early initiating and later adaptation and immunosuppressive phenotypes (1). The early response is brief, severe, and often lethal, but the late phase can persist for weeks with sustained morbidity and mortality from immunosuppression and multiorgan failure (reviewed in Ref. 2).
Cellular bioenergy and metabolism play important roles in regulating acute inflammation and immunity. Early innate and adaptive immune responses require a high energy state supported by glucose-dependent production of ATP and activation of NADPH oxidase to kill microorganisms by reactive oxygen species (3). During this early stage of sepsis, precipitous decreases in ATP production by mitochondrial oxidative phosphorylation occur (4), and glycolysis provides the primary source of ATP (4, 5). In contrast, the later stage of acute inflammation is a low-energy response (6) that heals and eventually restores homeostasis. However, it also represses innate and adaptive immunity (7), as recently documented in human spleen and lung from deceased sepsis patients (8). A caution from this important study is that postmortem changes in the viable cells studied might change phenotype.
Emerging data support that interactions between inflammation and metabolism play critical roles in chronic inflammatory diseases like obesity with diabetes and atherosclerosis (9–11). These chronic inflammatory and metabolic responses are heterogeneous and involve cells of both innate and adaptive immunity. Less is known about how metabolism influences acute inflammation, which progresses through sequential stages. We recently reported that NAD+ informs deacetylase sirtuin 1 (SirT1)3 to direct a sequential epigenetic switch between early and late TLR4 responses in a THP-1 promonocyte sepsis cell model and in human sepsis blood leukocytes (12). In this study, we used the same THP-1 sepsis model of TLR4 responses, as well as human and murine sepsis leukocytes to show that NAD+-dependent sensing by SirT1 and SirT6 integrates sequential reprogramming of metabolic and acute inflammatory responses.
EXPERIMENTAL PROCEDURES
Human Sepsis
Blood was drawn from healthy controls and sepsis subjects according to the Institutional Review Board protocol approved by Wake Forest University School of Medicine. Patients fit the diagnosis of the systemic inflammatory response syndrome with septic shock and were receiving vasopressors (13). Blood leukocytes were isolated as described (12). The blood leukocytes were 95% viable and subjected to cell culture under the indicated conditions. We used mixed blood leukocytes because both neutrophils and mononuclear cells form silent heterochromatin during the late stage of sepsis that exhibits immunosuppression.
Murine Sepsis
The sublethal animal sepsis model was approved by the Institutional Animal Care and Use Committee of the Wake Forest University School of Medicine, and studies were performed according to the National Institutes of Health guidelines. C57BL/6, 6- to 8-week-old mice were obtained from The Jackson Laboratories (Bar Harbor, ME), and the cecal ligation and puncture (CLP) procedure was performed under anesthetization as detailed previously (14). In sham mice, all procedures were identical to the CLP mice except for the cecal ligation and puncture. The LD50 of septic mice is 77 h after CLP. Splenocytes from septic mice contain a mixture myeloid-derived suppressor cells that are hyporesponsive to LPS stimulation ex vivo by 18 h after CLP (unpublished observations)4. Thus, the spleen cell phenotype in mice mimics the circulating mixed leukocyte phenotype observed in human sepsis.
However, there are two potential limitations from using mixtures of blood or spleen cells obtained from normal or sepsis participants. One is the presence of mixed cell types (neutrophils, monocyte/macrophages, and T or B lymphocytes). The second is that the state of cell differentiation (e.g. immaturity) may differ. A possible advantage of impure populations is the cross-talk that may occur during inflammation (e.g. paracrine effects).
THP-1 Human Promonocyte Sepsis Model of TLR4 Responses
THP-1 cells were obtained from the ATCC and maintained in RPMI 1640 medium (Invitrogen) supplemented with 100 units/ml penicillin, 100 μg/ml streptomycin, 2 mm l-glutamine, and 10% fetal bovine serum (HyClone, Logan, UT) in a humidified incubator with 5% CO2 at 37 °C. Cells were stimulated with 1 μg/ml of Gram-negative bacteria LPS for indicated times to generate different inflammatory phases. This ultrapure LPS product extracted from Escherichia coli serotype 0111:B4 (Sigma) only acts via TLR4 (15, 16). We have confirmed TLR4-dependent responsivity of LPS in murine macrophages not expressing TLR4 or TLR2 (unpublished observations5). In this model of sepsis responses, the early inflammatory response is assessed at 4–8 h after TLR4 stimulation. The later adaptation stage is present by 24–48 h after TLR4 stimulation and mimics LPS responsivity of sepsis blood leukocytes. In some experiments, cells were pretreated 24 h with 10 nm FK866 (Cayman Chemical) (to deplete cellular NAD+), 10 mm 2-deoxyglucose (2-DG), 1 μm echinomycin (HIF-1α inhibitor), or 10 nm Etomoxir (carnitine palmitoyl transferase 1 inhibitor). The same quantity of viable cells as determined by trypan blue exclusion is used for each following experimental treatment after LPS, inhibitors, or electronic transfection.
Glucose and Fatty Acid Uptake
Uptake of glucose and fatty acid were measured by radiolabel (17, 18). One million cells in 100 μl were starved in triplicate in polypropylene vials for 30 min at 37 °C in glucose-free or serum-free Hanks' buffer. The assay was initiated by the addition of another 100 μl of hot buffer containing 1 μCi of D-[6-14C]glucose (PerkinElmer LifeSciences) and 2.5 μm cold glucose or 1 μCi of 1-[14C]palmitic acid in 0.2% BSA-Hanks' buffer. Glucose transport reaction was terminated after 5 min by washing cells three times in ice-cold PBS containing cytochalasin B (Sigma). Fatty acid uptake was stopped by washing cells with ice-cold PBS containing 0.1% BSA and 200 mm phloretin (Sigma). Cell pellets were solubilized in 0.5 m NaOH, and extracts were neutralized by glacial acetic acid. Cell-associated radioactivity was determined by scintillation β counter.
Glucose and Fatty Acid Oxidation
Central wells containing 1 million nutrients-starved cells in triplicates were placed into scintillation tube. After addition of 1 μCi of D-[6-14C]glucose and 2.5 μm cold glucose or 1 μCi of 1-[14C]palmitic acid in 0.2% BSA-Hank's buffer to cells, the scintillation tubes were sealed by a rubber stopper. Cells were incubated at 37 °C in a water bath with rotation. After 1 h of incubation, 200 μl of 2 N HCl was injected into the central well to terminate metabolic reactions, and 500 μl of Hyamine (PerkinElmer Life Sciences) was injected into the scintillation tube. After overnight shaking at room temperature, the central well was removed and 14CO2 generated by the oxidation of D-[6-14C]glucose or 1-[14C]palmitic acid was detected using β counter. One μCi of D-[6-14C]glucose alone or 1-[14C]palmitic acid alone in same amount of buffer was set for background counts.
Glycolysis
Glycolysis was measured by the conversion of D-[5-3H(N)]glucose to tritiated water (19). Cells in central wells in glucose-free RPMI (Invitrogen) in triplicates were incubated with 1 μCi of D-[5-3H(N)]glucose (PerkinElmer Life Sciences) at 37 °C for 1 h in scintillation tubes containing 1 ml of H2O. The reaction was stopped by adding HCl (1 N final), and the scintillation tube was sealed. [3H]2O generated by enolase activity from D-[5-3H(N)]glucose was vaporized overnight in a 50 °C oven and cooled down overnight at 4 °C. After removal of the central wells, [3H]2O was counted for detection of the glycolytic rate. 1 μCi of D-[5-3H(N)]glucose alone in triplicates was set for background control. 1 μCi of [3H]2O (PerkinElmer Life Sciences) alone in triplicates was set for detection the efficiency of this water vapor exchange.
Real-time RT-PCR
Levels of human TNF-α, IL-10, and RelB mRNA were measured by quantitative real-time RT-PCR using gene-specific TaqMan primer/probe sets in an ABI prism 7000 sequence detection system (Applied Biosystems). GAPDH mRNA was the internal loading control.
RNA Interference
For knockdown, 60 pmol of a pool of three target-specific siRNA (Santa Cruz Biotechnology) were electronically transfected into responsive THP-1 cells for 24 h using Amaxa nucleofector kit V and an Amaxa nucleofector II device (Lonza, Inc.) and with 1 μg/ml LPS before harvest. A pool of scrambled siRNAs was transfected as a negative control.
Western Blot Analysis
Equal amounts (50 μg) of cell lysates were separated by SDS-PAGE electrophoresis and transferred to a polyvinylidene difluoride membrane (PerkinElmer Life Sciences). Blots were blocked with 5% milk-TBS-Tween 20 for 1 h at room temperature and probed overnight at 4 °C with primary antibodies against Glut1 (Abcam), pyruvate dehydrogenase kinase 1 (PDHK1) (Enzo Life Sciences), pyruvate dehydrogenase E1α1 (PDHA1) (Invitrogen), p-PDHA1-Ser-232 (Calbiochem), phospho-fructose kinase 1 (pFK1) and pFK2 (Novus Biologicals), lactate dehydrogenase (Fitzgerald), CD36 (Thermo Scientific), carnitine palmitoyl transferase 1 (CPT-1), peroxisome proliferator-activated receptor γ coactivator 1-α and β (PGC-1α and PGC-1β) (Santa Cruz Biotechnology), and SirT1 and SirT6 (Cell Signaling Technology). β-actin was used as a loading control and was probed with mouse anti-human β-actin monoclonal antibody (Sigma). Protein complexes were detected by incubation for 1 h at room temperature with secondary antibody conjugated to horseradish peroxidase (Sigma) diluted at 1:5000 in blocking buffer and then detected by Enhanced Chemiluminescence Plus (GE Healthcare).
Flow Cytometry
Aliquots of 1 million cells were pelleted at 600 × g and resuspended in 80 μl of PBS with 1% BSA. Different cell aliquots were incubated with 10 μl of carboxyfluorescein-conjugated mouse IgG1 anti-human Glut1 antibody (Sigma), FITC-conjugated mouse IgG1anti-human CD36 antibody or isotype control antibody (Stem Cell Technologies), respectively. After incubation for 1 h on ice, cells were washed with PBS/BSA and resuspended in 1 ml of PBS/BSA. A volume of 250 μl of 3.7% formaldehyde was added to each tube, and the cells were assayed on an EPICS-XL flow cytometer (Coulter, Hialeah, FL) with filters set for FITC fluorescence detection. Gates were based on the basis of isotype control antibody staining so that there were <2% positive cells with isotype control antibodies. Ten thousand cells were evaluated for FITC positivity. Data were analyzed using FlowJo software.
Immunofluorescence Microscopy
For Glut1 staining, cells were incubated with 1 μg/ml of mouse anti-human Glut1 monoclonal antibody (R&D Systems) for 1 h, washed, and incubated for another 1 h on ice with rhodamine-conjugated goat anti-mouse IgG1 (1–1000 diluted in blocking buffer, Sigma). CD36 were stained with FITC-anti-human CD36 monoclonal antibody (1:10 diluted in blocking buffer, Stemcell Technologies) for 1 h. After two more washes with PBS, 1000 cells were fixed with 3.7% formaldehyde-PBS, cytospun onto slides, mounted (Victor Labs, Burlingame, CA), and analyzed using an LSM 510 microscope (Zeiss) with the LSM 510 image browser software.
Periodic Acid Schiff Staining
Intracellular glycogen was stained with the periodic acid Schiff procedure. Cells were cytospinned onto slides and fixed with Carnoy's fixative buffer containing 60% alcohol, 30% chloroform, and 10% glacial acetic acid. After washing with deionized water, slides were stained with 0.5% (w/v) of periodic acid solution (Sigma) for 10 min followed by Schiff reagent (Sigma) for 5 min. Slides were then counterstained with hematoxylin and examined using a Zeiss Axiocam charge-coupled device camera.
Evaluation for Intracellular NAD+, NADH, and NAD+/NADH Ratio
Total cellular NADt (NAD+ + NADH) extraction and evaluation were performed using a colorimetric NAD+/NADH assay kit (BioVision) according to the instructions of the manufacturer. NADt extractions were filtered by passing samples through a 10 Kd molecular weight cutoff filter to exclude the possible NADH consuming enzymes. For cellular NADH detection, NAD+ was decomposed before reaction by heating NADt samples for 30 min at 60 °C. Fifty microliters of NADt, NADH samples, or NADH standard were mixed for 10 min with 100 μl of working reagent in duplicate in a 96-well plate. 10 μl of NADH developer reagent was added to each well and incubated for another 1 h. The optical density was read at 450 nm. Cellular NADt and NADH levels of unknown samples were calculated from the standard curve and analyzed by Prism software (GraphPad Prism, version 4.0, GraphPad Software, San Diego, CA) and were normalized against protein levels. NAD+ levels were obtained by subtraction of the NADH level from NADt. The ratio of NAD+/NADH was calculated as (NADt-NADH)/NADH.
Plasma Pyruvate Detection
Human and mouse plasma were prepared by centrifugation of blood samples to remove cell components. Plasma pyruvate levels were measured using EnzyChromTM pyruvate assay kit (Bioassy Systems) according to the instructions of the manufacturer. Briefly, plasma was diluted 2-fold in PBS. 10 μl of samples or pyruvate standards were transferred into 96-well plates in duplicates. 90 μl of working solution was added into each well and incubated for 30 min at room temperature. The optical density at 570 nm was read, and the concentration of plasma pyruvate was calculated from a standard curve.
Statistical Analysis
Differences of metabolic changes between two related conditions were analyzed by Student unpaired “t” test, and the temporal changes in NAD+, NADH and NAD+/NADH ration following TLR stimulation were analyzed by ANOVA using GraphPad Prism version 4 (San Diego, CA). p values of less than 0.05 were considered significant.
RESULTS
Glucose and Fatty Acid Metabolism Shifts in TLR4-activated THP-1 Human Promonocytes
We have, over 20 years, found that TLR4-activated THP-1 human monocytic cells simulate sequential innate inflammatory responses of human sepsis blood leukocytes on the basis of gene-specific formation of silenced heterochromatin at acute proinflammatory genes and the presence of RelB-specific generation of adaptation and LPS tolerance during late acute inflammatory responses (20). Here, we further substantiate the temporal sequence of accentuated to repressed expression of proinflammatory TNF-α to immunorepressive IL-10 following TLR4 stimulation of THP-1 cells (Fig. 1A).
FIGURE 1.

Sequential metabolic shifts occur after TLR4 stimulation of THP-1 cells. Cells were assessed during the sequential early initial and late adaptation responses. A, TNF-α is repressed, and IL-10 mRNA is induced during the adaptation stage. B, glucose uptake is increased during the early inflammatory response. C, mitochondrial glucose oxidation is reduced during the early inflammatory response. D, glycolysis is increased during the early inflammatory response. E, palmitic acid uptake is increased during the adaptive response. F, palmitic acid mitochondrial fatty acid oxidation is increased during the hypoinflammatory response. Bar graphs depict mean values ± S.E. of one of three independent experiments.
To determine whether cellular metabolism varies with sequential TLR4 responses, we examined glucose and fatty acid metabolism. We used D-[6-14C]glucose to follow glucose uptake and glucose oxidation, D-[5-3H (N)]glucose for glycolysis analysis, and 1-[14C]palmitic acid for analysis of fatty acid uptake and oxidation. To validate the radiolabeling metabolic assays, we found that 500-fold excess of cold D-glucose or palmitate blocks uptakes of D-[6-14C]glucose and 1-[14C]palmitate up to 96% and 92%, respectively (not shown). We found that glucose uptake increased for 8 h (early acute inflammation phase) and decreased by 24 h (adaptation phase) (Fig. 1B). In contrast, glucose oxidation deceased rapidly and remained low at 24 h (Fig. 1C). We confirmed that increased glucose flux and decreased glucose oxidation during early TLR4 responses reflected enhanced glycolysis (Fig. 1D). Next, we showed that fatty acid uptake was relatively unchanged during the early TLR4 response but significantly increased by 24 h (Fig. 1E). This increase paralleled elevated fatty acid oxidation during the adaptation stage (Fig. 1F). Thus, increased glycolysis dominates early TLR4 responses and fatty acid flux and oxidation dominate late responses in THP-1 cells.
Distinct signaling events control glucose and fatty acid metabolism (21) (Fig. 2A). We further observed that the Warburg-like glycolytic profile during early acute TLR4 responses is supported by 1) the increased expression of glucose transporter Glut1 and its cell surface translocation, 2) deactivation of mitochondrial PDHA1, and 3) increased expression of glycolytic enzymes pFK1 and pFK2 and accumulation of cellular pyruvate and lactate (Figs. 2, B–G). We also observed that glycogenolysis supports glycolysis during late inflammatory response when Glut1 expression is diminished (data not shown).
FIGURE 2.

Dynamics in expression of key metabolic regulators in the THP-1 cell model of sepsis. A, schematic of key regulators in metabolic pathways. B, expression of Glut1 in THP-1 cells during TLR4 stimulation. C, expression of surface Glut1 on THP-1 cells. Cells were stimulated with 1 μg/ml of LPS for different times. Cell surface GluT1 was stained with human GluT1-specific mouse monoclonal antibody followed by rhodamine-conjugated goat anti-mouse IgG1. D, flow cytometry analysis of GluT1 expression in THP-1 cells during TLR4 stimulation. THP-1 cells were cultured for 24 h with or without 1 μg/ml LPS. Cell surface GluT1 was probed with carboxyfluorescein-conjugated human GluT1 monoclonal antibody. E, changes of pyruvate dehydrogenase complex activity during TLR4 stimulation. Cells were stimulated with 1 μg/ml of LPS for different times. Total cell lysates were analyzed by Western blot analysis for expressions of PDHK1, PDHA1, and phospho-PDHA1-Ser-232. F, expression of rate-limiting enzymes in the glucose metabolic pathway during TLR4 stimulation. G, expression of lactate dehydrogenase (LDH) and accumulations of intracellular pyruvate and lactate during TLR4 stimulation. H, expressions of rate-limiting enzymes in the fatty acid metabolic pathway during TLR4 stimulation. Changes of CD36 and CPT-1 were analyzed by Western blot analysis (left panel) and densitometry analysis (right panel). I, expression of external membrane CD36 on THP-1 cells. Cell surface CD36 was probed with FITC-conjugated mouse anti-human CD36. J, flow cytometry analysis of CD36 expression in THP-1 cells during TLR4 stimulation. The cell surface CD36 was stained with FITC-anti-CD36 monoclonal antibody. GluT1, glucose transporter 1. FA, fatty acid.
Increased fatty acid oxidation was associated with increased expression of CD36, a member of the class B scavenger receptor/transporter with a high affinity for long chain fatty acids, and CPT-1, the rate-limiting enzyme for long chain fatty acid mitochondrial transporter and fatty acid oxidation (Fig. 2, H–J). The TLR4-induced expression of CD36 and CPT-1 shown by Western blot analysis was further confirmed by densitometry analysis (Fig. 2H, right panel).
Glucose and Fatty Acid Switching Requires NAD+ Synthesis by Nicotinamide Phosphoribosyltransferase (Nampt)
We reported previously that Nampt-dependent accumulation of cellular NAD+ coordinates epigenetic reprogramming when TLR4 responses switch from early to late phenotypes (Fig. 3A) (12). Following early TLR4 activation, cellular NAD+ levels were decreased and then steadily accumulated. Mirroring the high energy requirement, TLR4 also increased NADH levels that later decreased (Fig. 3B). The dynamic changes in cellular NAD+ and NADH levels following TLR response are statistically significant (p = 0.0016 and p = 0.0002, respectively). NAD+/NADH ratios increased (p = 0.0004, Fig. 3C). We then tested whether NAD+-dependent events also regulate the metabolic switch during the sequential TLR4 inflammatory response. To do this, we depleted NAD+ by overnight pretreatment of cells with Nampt-specific inhibitor FK866 followed by TLR4 stimulation for 24 h. FK866 pretreatment decreased the basal rate of glucose oxidation and could not further diminish it without NAD+ after TLR4 activation (Fig. 3D). The reduction of basal glucose oxidation after FK866 treatment could have resulted from the decreased PDHA1 expression. However, inhibition of Nampt activity almost totally blocked late-state TLR4-induced increases in fatty acid oxidation, although the basal rate of fatty acid β oxidation was not altered (Fig. 3E). These observations parallel the early to late epigenetic switching response (12). The NAD+-dependent metabolic switch is further supported by the increased expression of PDHK1 and the phosphorylation of PDHA1 at PDHK1-specific site PDHA1-Ser-232, the inactive form of PDHA1, and decreased expression of PDHA1 and CPT-1 proteins in the presence of FK866 (Fig. 3F).
FIGURE 3.

TLR4-induced metabolic switching of glucose and fatty acid metabolism requires Nampt-dependent NAD+ generation. NAD+ was depleted by treating cells for 24 h with FK866, and TLR4 was stimulated with LPS for another 24 h. A, schematic of epigenetic gene-selective reprogramming and bioenergy shifts during the acute inflammatory response. B, dynamic changes of cellular NAD+ and NADH during TLR4 activation. C, dynamic changes of NAD+/NADH ratio during TLR4 activation. D, FK866 reduces mitochondrial glucose oxidation in quiescent cells and restrains its increase at 24 h. E, FK866 inhibits LPS-induced increase in fatty acid oxidation at 24 h. F, FK866 alters key glucose and fatty acid metabolism regulators: PDHK1, PDHA1, p-PDHA1-Ser-232, and CPT-1. Bar graphs represent mean ± S.E. of one of two independent experiments. FK, FK866; med, medium.
NAD+-dependent Deacetylase SirT1 and SirT6 Coordinate Metabolic Switching during Early and Late TLR4 Responses
We then reasoned that NAD+ sensors SirT6 and SirT1 might differentially coordinate the metabolic switching between early and late acute inflammatory responses because SirT6 regulates glycolysis and SirT1 regulates fatty acid oxidation (22). We first examined levels of SirT1 and SirT6 protein and confirmed our previous observation that SirT1 increases after TLR4 stimulation (12). In contrast, SirT6 was constitutively expressed, decreased after early TLR4 stimulation, and moderately increased during the late adaptation phase (Fig. 4A). We then assessed effects of SirT1 or SirT6 depletion on glucose and fatty acid metabolism. To do this, THP-1 cells were transfected with either control or test siRNAs for 24 h and analyzed 24 h after TLR4 stimulation. Immunoblot analysis showed that SirT6 knockdown caused 90% reduction of SirT6 protein without changing SirT1 levels. In contrast, SirT1 knockdown depleted both itself and SirT6, confirming reports that SirT1 regulates SirT6 (23) (Fig. 4H). SirT6 depletion significantly increased glucose uptake and glycolysis and further decreased glucose oxidation (Fig. 4, B–D) but did not alter fatty acid uptake or oxidation (Fig. 4, E and F). In contrast, SirT1 knockdown significantly decreased fatty acid uptake and fatty acid oxidation without changing glucose uptake, glycolysis, or glucose oxidation after TLR4 stimulation. Thus, both glucose and fatty acid metabolic changes during the acute TLR4 inflammatory responses depend on NAD+ for sirtuin activation, but SirT6 predominantly opposes the glucose metabolic switch, and SirT1 primarily supports the fatty acid switch.
FIGURE 4.

NAD+-dependent deacetylases SirT6 and SirT1 differentially regulate glucose and fatty acid metabolic switching. THP-1 cells were transfected with gene-specific siRNA for SirT1 and/or SirT6 for 24 h followed by 1 μg/ml LPS stimulation for 24 h. A, SirT1 levels increase and SirT6 levels are sustained after LPS stimulation. B, SirT6 knockdown increases glucose uptake, whereas SirT knockdown has little effect. C, SirT6 knockdown further decreases mitochondrial oxidation, whereas SirT1 has little effect. D, SirT6 knockdown increases glycolysis, whereas SirT1 has little effect. E, SirT1 knockdown reduces palmitic acid uptake, whereas SirT6 has little effect. F, SirT1 knockdown reduces palmitic acid mitochondrial oxidation, whereas SirT6 has little effect. G, SirT6 or SirT1 differentially influence Glut1 and CD36 expression, and SirT1 knockdown diminishes SirT6 (H). Bar graphs represent mean ± S.E. of one of three independent experiments. CTRL, control; R, responsive cells; A, adapted cells.
The differentially regulated inflammatory metabolic switch by SirT1 and SirT6 was further supported by immunoflourescence examination of cell surface transporters Glut1 and CD36. Glut1 transporter levels increased in early TLR4 responses and diminished by the 24 h late stage. In contrast, CD36 expression significantly increased by 24 h (Fig. 4G, upper panel). SirT1 knockdown partially blocked the decrease in Glut1 expression but completely attenuated increased CD36 expression (Fig. 4G, center panel). In contrast, SirT6 knockdown limited Glut1 decreases observed at 24 h without affecting CD36 (Fig. 4G, bottom panel). Immunoblot analysis of Glut1 and CD36 expression confirmed the immunoflourescence observations after gene-specific knockdowns (Fig. 4H).
Hypoxia-inducing Factor-1α (HIF-1α) and PGC-1 Support Metabolic Shifts during TLR4 Responses
HIF-1α is a master regulator of genes controlling glycolysis (24) and PGC-1 of genes controlling fatty acid oxidation and mitochondrial biogenesis (25). SirT6 represses the function of HIF-1α by epigenetically silencing chromatin at HIF-1α target gene promoters, thereby balancing glucose metabolism (26). In contrast, SirT1 directly binds and activates PGC-1 coactivators to support the fatty acid oxidative pathway and mitochondrial biogenesis (27). This suggested to us that HIF-1α and PGC-1 were targets of SirT6 and SirT1, respectively, during the shift from early to late acute inflammation. We next tested whether HIF-1α and PGC-1 coordinate the link between NAD+ sensing, metabolism, and inflammation. Although we were unable to detect HIF-1α protein under normoxia conditions, we observed increased expression of HIF-1α mRNA (data not shown) and HIF-1α target genes such as Glut1 and PDHK (Fig. 2). Depletion of HIF-1α expression by siRNA reduced basal glucose uptake and glucose oxidation and prevented these metabolic changes after TLR4 stimulation (Figs. 5, A and B). In contrast, HIF-1α knockdown had little effect on TLR4 -induced increases in fatty acid uptake and oxidation (Fig. 5, C and D). TLR4 stimulation increased expression of PGC-1α and β isoform mRNAs (data not shown) and proteins in THP-1 cells, with PGC-1β dominant (Figs. 6A). Gene-specific knockdown of PGC-1α or PGC-1β blocked TLR4-induced CD36 expression. Interestingly, knockdown of PGC-1β but not PGC-1α attenuated TLR4-induced CPT-1 expression (Fig. 6B). Like SirT1 knockdown, deficiency of either PGC-1α or PGC-1β blocked TLR4-mediated increases in fatty acid oxidation in the late adaptation stage (Fig. 6C).
FIGURE 5.

HIF-1α predominantly regulates glucose metabolism during TLR4 stimulation. THP-1 cells were transfected with HIF-1α-specific siRNA or control siRNA. After 24 h of transfection, cells were stimulated with 1 μg/ml LPS for another 24 h followed by radiolabeling for metabolic analysis. Knockdown HIF-1α significantly decreases uptake of D-[6-14C]glucose (A) and mitochondrial oxidation of D-[6-14C]glucose (B) but does not significantly affect uptake of 1-[14C]palmitic acid (C). D, knockdown HIF-1α has no effect on mitochondrial oxidation of 1-[14C]palmitic acid. Bar graphs depict mean values ± S.E. from two independent experiments. CTRL, control; KD, knockdown.
FIGURE 6.
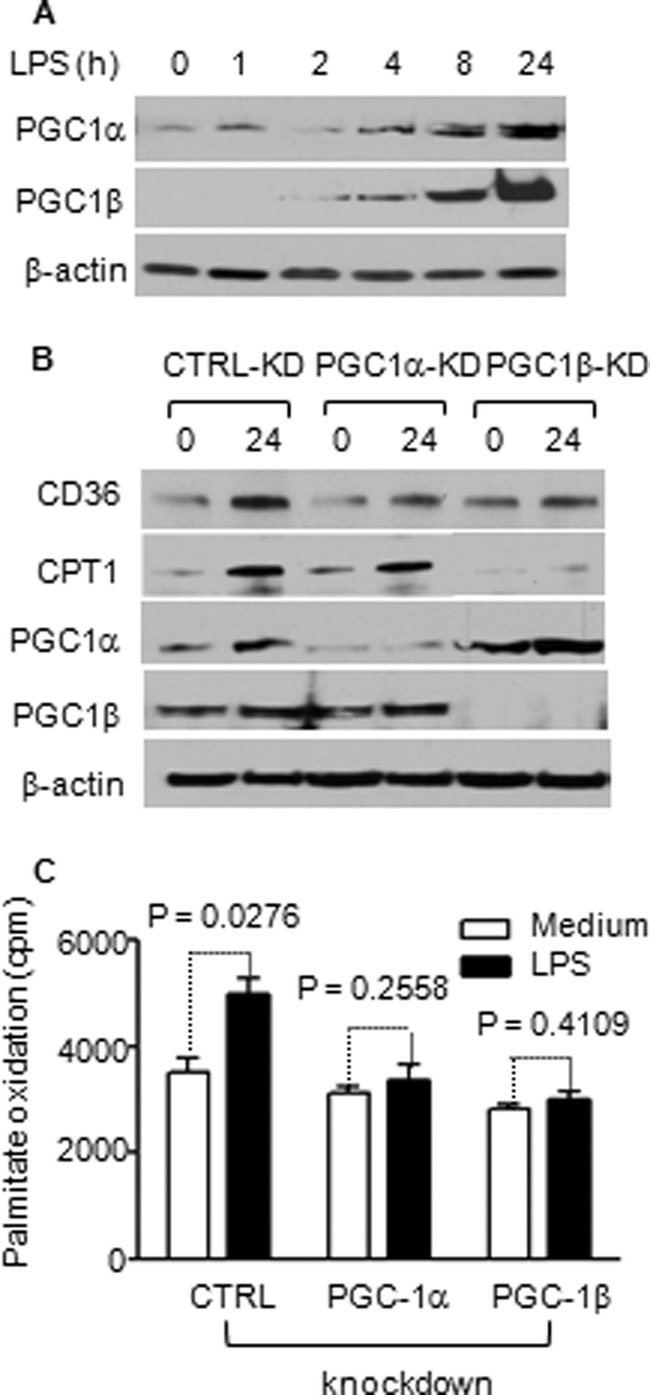
TLR4-induced fatty acid uptake and oxidation requires PGC-1 induction. THP-1 cells were stimulated with 1 μg/ml of LPS and followed for 24 h. A, TLR4 activation induces expression of PGC-1α and PGC-1β. B, PGC-1α or PGC-1β knockdown reduces CD36 expression, and PGC-1β specifically reduces CPT-1 expression. C, PGC-1 α or β knockdown reduces fatty acid oxidation. Bar graphs depict mean values ± S.E. of one from two independent experiments. CTRL, control; KD, knockdown.
Metabolic and Inflammatory Reprogramming Is Integrated
Because NAD+ and redox sensor sirtuins regulate reprogramming at many levels, a plausible concept is that changes in Nampt-dependent NAD+ production and sensing by SirT1 and SirT6 couple metabolism and inflammation. We examined whether metabolism and inflammation are integrated in three ways: 1) inhibiting glucose uptake with 2-deoxyglucose, 2) blocking HIF-1α glycolysis by echinomycin, and 3) depleting RelB, the dual function transcription factor required for gene-specific chromatin modifications associated with the adaptation phenotype in human sepsis and THP-1 cells (28). We found that blocking glucose uptake or chemically disrupting HIF-1α function significantly inhibited TNF-α and RelB transcription (Fig. 7, A–D). In contrast, inhibiting CPT-1 by etomoxir to limit fatty acid oxidation had no effect on TNF-α and RelB transcription (Fig. 7, E and F). siRNA knockdown of RelB had no effect on glucose metabolism but reduced fatty acid oxidation (Fig. 7G).
FIGURE 7.

Metabolism and inflammation reprogramming are integrated. Blocking glucose uptake by 2-deoxyglucose (2-DG) decreases TLR4-induced gene transcription of TNF-α (A) and RelB (B). Inhibiting glycolysis regulator HIF-1α DNA binding by echinomycin diminishes transcription of TNF-α (C) and RelB (D). CPT-1 inhibition does not alter TRL4-induced transcription of TNF-α (E) or RelB (F). G, RelB knockdown attenuates TLR4-mediated fatty acid oxidation. Bar graphs represent mean values ± S.E. of one of two independent experiments. CTRL, control.
Murine Splenocytes and Human Blood Leukocytes Switch from Glucose to Fatty Acid oxidation during Sepsis
Murine Sepsis
To confirm the metabolic switch of ex vivo TLR4 responses in the THP-1 sepsis model, we used the CLP murine sepsis model. C57BL/6 mice became adapted after 12–24 h of CLP. LPS-stimulated TNF-α transcription of septic splenocytes was diminished compared to that of sham splenocytes (data not shown). Significant decreases of glucose oxidation and increases in fatty acid oxidation occurred in late-stage septic splenocytes (Fig. 8, A and B). The metabolic switch in septic splenocytes was further supported by the induction of metabolic regulators (Fig. 8C). Thus, septic THP-1 cell model and murine sepsis show similar shifts in glucose and fatty acid metabolism between the early and late stages.
FIGURE 8.

Glucose and fatty acid oxidation shift in murine and human sepsis. Both murine and human sepsis analyses were performed during the adaptation stage (mice at 24 h after CLP and humans at least 24 h after sepsis onset). A, mitochondrial glucose oxidation is decreased in sepsis murine splenocytes. B, mitochondrial palmitic acid oxidation is increased in sepsis murine splenocytes. C, mitochondrial fatty acid regulators are modified in sepsis murine splenocytes. D, mitochondrial glucose oxidation is decreased in human sepsis leukocytes. E, mitochondrial palmitic acid oxidation is increased in human sepsis leukocytes. F, mitochondrial fatty acid regulators are modified in human sepsis leukocytes. Data are mean values ± S.E. N, normal; P, patients.
Human Sepsis
We next extended the concept of metabolic shifts to human sepsis patients whose blood leukocytes were in the late stage as determined by markedly reduced TLR4-induced TNF-α expression (data not shown). Reciprocal decreases in glucose oxidation and increases in fatty acid oxidation were observed (Fig. 8, D and E). We also showed elevated regulators of the metabolic shift, PDHK1, p-PDHA1-Ser-232, PGC-1s, and CPT-1 (Fig. 8F).
DISCUSSION
This study reports for the first time, to our knowledge, that NAD+-dependent processes couple metabolism with sequential early and late stages of the acute inflammatory response.
We constructed this paradigm using THP-1 promonocytic cells as a model of sepsis and extended the findings to human and murine sepsis. TLR4 stimulation induced sequential metabolic reprogramming that aligned with our previous report of gene-specific epigenetic chromatin remodeling between early and late sepsis responses (2). The HIF-1α-dependent glycolysis of the early response shifted to PGC-1-dependent fatty acid β-oxidation during the late adaptation response. This switch required Nampt-dependent generation of NAD+, which was sensed by SirT1 and SirT6. SirT6 reduced HIF-1α-dependent glycolysis and SirT1 enhanced PGC-1-dependent fatty acid flux and oxidation. We also identified co-dependent cross-talk between metabolism and inflammation during early and late reprogramming in that glycolysis supported TNF-α transcription and PGC-1 and RelB induction promoted fatty acid oxidation. We extended the concept by showing reciprocal reprogramming of metabolism in late-stage murine splenocytes and human sepsis blood leukocytes. We conclude that proximal shifts in NAD+ bioenergetics sensed by SirT 1 and SirT 6 concomitantly inform metabolic and inflammatory reprogramming during acute systemic inflammatory responses. Fig. 9 summarizes this concept.
FIGURE 9.

Alignment of NAD+-dependent metabolic and inflammatory switching after acute TLR4 responses and during sepsis. When sepsis is ignited by TLR responses, the high energy required for the early inflammatory response generates reactive oxygen species (ROS), which stabilizes HIF-1α protein and activates its transcription of glycolysis genes in concert with NF-κB p65 and its activation of proinflammatory genes. HIF-1α increases glycolysis, but inhibits mitochondrial glucose oxidation. As the early inflammatory response changes to late adaptation, glucose metabolism switches to increased fatty acid flux and enhanced fatty acid mitochondrial oxidation. Both the metabolic and adaptive switches require activation of Nampt and NAD+ sensors SirT1 and SirT6. SirT6 represses glucose metabolism by epigenetically silencing the HIF-1α path. SirT1 supports fatty acid oxidation by activating the PGC-1 path, which also promotes mitochondrial biogenesis and restores homeostasis in sepsis survivors.
It is increasingly clear that the sirtuin family of NAD+ sensors connect nutrition, metabolism, and epigenetic regulation of chromatin structure (29). In mammals, the primary source of NAD+ production is the intracellular Nampt salvage pathway, and this pathway plays a critical role in metabolic and inflammatory responses by controlling NAD+ production. Nampt is induced by TLR4 responses (12), and chemically inhibiting Nampt by FK866 markedly disrupts epigenetic (12) and metabolic shifts (this report) of acute inflammation. HIF-1α, which directly binds to and activates the Nampt promoter (30), may facilitate the regulatory loop of increased NAD+, generation that activates SirT6 to indirectly reduce HIF-1α effects on glycolysis by epigenetically silencing genes that encode regulators of glycolysis (22). NAD+ provided by Nampt also activates SirT1, which directly deacetylates and deactivates NF-κB p65 to promote chromatin compaction at proinflammatory genes (12, 31) and directly activates PGC-1 to promote a shift to fatty acid oxidation (25). Thus, SirT 6 and 1 may combine to restore metabolic homeostasis and resolve sepsis inflammation. In support of this, a recent report demonstrated that SirT1 hastens resolving inflammation after intravenous endotoxin administration to humans and mice (32).
Sepsis inflammation involves both innate and adaptive immunity (33). This study only examined coupling of bioenergy, metabolism, and acute inflammatory responses in circulating leukocytes and THP-1 promonocytes, but our findings align with other reports that T effector cells require glycolysis as fuel (e.g. CD4, CD8, and Th17 (34, 35)), whereas immune repressor Treg cells and CD8 T memory cells require fatty acid oxidation as fuel (36, 37). CD8 memory T cells also shift from fatty acid oxidation to glycolysis when they become effector cells and then switch back again (38, 39). Taken together, the emerging data support that global immune and inflammatory responses share a common program of metabolic and epigenetic reprogramming to support effector and repressor functions. We provide an added dimension that NAD+ acting through sirtuin redox sensors lies proximal to switches in both immune and inflammatory effector and repressor phenotypes and to generating polarity between glycolysis and fatty acid oxidation as fuel sources. This makes biological sense in the context of an acute systemic infection by ensuring a rapid high energy and maximal effector response that will clear the pathogen and then switch to a lower energy restorative state that rebalances immunity and inflammation and regains homeostasis. The later adaptive state of sepsis with modified bioenergetics may, however, contribute to immunosuppression. This new concept may support design of new therapies for immune and inflammatory diseases.
Acknowledgments
We thank Jean Hu, Sue Cousart, and Jiaozhong Cai for technical assistance and Richard Loeser for critical suggestions.
This work was supported, in whole or in part, by National Institutes of Health RO1 Grants AI-065791 and AI-079144 (to C. E. M.), K08 Grant GM086470 (to V. V.), and MO-1RR 007122 (to the Wake Forest University General Clinical Research Center). The research on human participants was endorsed by Wake Forest University Institutional Review Board protocol BG174. The animal sepsis model was approved by the Institutional Animal Care and Use Committee of the Wake Forest University School of Medicine.
T. F. Liu, V. T. Vachharajani, B. K. Yoza, and C. E. McCall, unpublished observations.
E. Lorenz and C. E. McCall, unpublished observations.
- SirT1
- deacetylase sirtuin 1
- TLR
- Toll-like receptor
- CLP
- cecal ligation and puncture
- PDHK
- pyruvate dehydrogenase kinase
- PDHA
- pyruvate dehydrogenase EA1
- PFK
- phospho-fructose kinase
- CPT
- carnitine palmitoyl transferase
- PGC
- peroxisome proliferator-activated receptor γ coactivator
- Nampt
- nicotinamide phosphoribosyltransferase
- HIF
- hypoxia-inducible factor.
REFERENCES
- 1. Munford R. S., Pugin J. (2001) The crucial role of systemic in the innate (non-adaptive) host defense. J. Endotoxin. Res. 7, 327–332 [PubMed] [Google Scholar]
- 2. McCall C. E., El Gazzar M., Liu T., Vachharajani V., Yoza B. (2011) Epigenetics, bioenergetics, and microRNA coordinate gene-specific reprogramming during acute systemic inflammation. J. Leukoc. Biol. 90, 439–446 [DOI] [PMC free article] [PubMed] [Google Scholar]
- 3. Schumer W. (1974) Metabolic aspects of shock. Surg. Annu. 6, 1–16 [PubMed] [Google Scholar]
- 4. Bolaños J. P., Almeida A., Moncada S. (2010) Glycolysis. A bioenergetic or a survival pathway? Trends Biochem. Sci. 35, 145–149 [DOI] [PubMed] [Google Scholar]
- 5. Carré J. E., Orban J. C., Re L., Felsmann K., Iffert W., Bauer M., Suliman H. B., Piantadosi C. A., Mayhew T. M., Breen P., Stotz M., Singer M. (2010) Survival in Critical Illness is Associated with Early Activation of Mitochondrial Biogenesis. Am. J. Respir. Crit. Care Med. 182, 745–751 [DOI] [PMC free article] [PubMed] [Google Scholar]
- 6. Singer M. (2008) Cellular dysfunction in sepsis. Clin. Chest Med. 29, 655–660 [DOI] [PubMed] [Google Scholar]
- 7. Hotchkiss R. S., Coopersmith C. M., McDunn J. E., Ferguson T. A. (2009) The sepsis seesaw. Tilting toward immunosuppression. Nat. Med. 15, 496–497 [DOI] [PMC free article] [PubMed] [Google Scholar]
- 8. Boomer J. S., To K., Chang K. C., Takasu O., Osborne D. F., Walton A. H., Bricker T. L., Jarman S. D., 2nd, Kreisel D., Krupnick A. S., Srivastava A., Swanson P. E., Green J. M., Hotchkiss R. S. (2011) Immunosuppression in patients who die of sepsis and multiple organ failure. JAMA 306, 2594–2605 [DOI] [PMC free article] [PubMed] [Google Scholar]
- 9. Chawla A., Nguyen K. D., Goh Y. P. (2011) Macrophage-mediated inflammation in metabolic disease. Nat. Rev. Immunol. 11, 738–749 [DOI] [PMC free article] [PubMed] [Google Scholar]
- 10. Odegaard J. I., Ricardo-Gonzalez R. R., Goforth M. H., Morel C. R., Subramanian V., Mukundan L., Red Eagle A., Vats D., Brombacher F., Ferrante A. W., Chawla A. (2007) Macrophage-specific PPARγ controls alternative activation and improves insulin resistance. Nature 447, 1116–1120 [DOI] [PMC free article] [PubMed] [Google Scholar]
- 11. Olefsky J. M., Glass C. K. (2010) Macrophages, inflammation, and insulin resistance. Annu. Rev. Physiol. 72, 219–246 [DOI] [PubMed] [Google Scholar]
- 12. Liu T. F., Yoza B. K., El Gazzar M., Vachharajani V. T., McCall C. E. (2011) NAD+-dependent SIRT1 deacetylase participates in epigenetic reprogramming during endotoxin tolerance. J. Biol. Chem. 286, 9856–9864 [DOI] [PMC free article] [PubMed] [Google Scholar]
- 13. Levy M. M., Fink M. P., Marshall J. C., Abraham E., Angus D., Cook D., Cohen J., Opal S. M., Vincent J. L., Ramsay G. (2003) 2001 SCCM/ESICM/ACCP/ATS/SIS International Sepsis Definitions Conference. Crit. Care Med. 31, 1250–1256 [DOI] [PubMed] [Google Scholar]
- 14. Vachharajani V., Cunningham C., Yoza B., Carson J., Jr., Vachharajani T. J., McCall C. (2012) Adiponectin Deficiency exaggerates sepsis-induced microvascular dysfunction in the mouse brain. Obesity 20, 498–504 [DOI] [PMC free article] [PubMed] [Google Scholar]
- 15. Imler J. L., Hoffmann J. A. (2003) Toll signaling. The TIReless quest for specificity. Nat. Immunol. 4, 105–106 [DOI] [PubMed] [Google Scholar]
- 16. Yumoto H., Chou H. H., Takahashi Y., Davey M., Gibson F. C., 3rd, Genco C. A. (2005) Sensitization of human aortic endothelial cells to lipopolysaccharide via regulation of Toll-like receptor 4 by bacterial fimbria-dependent invasion. Infect. Immun. 73, 8050–8059 [DOI] [PMC free article] [PubMed] [Google Scholar]
- 17. Wu X., Motoshima H., Mahadev K., Stalker T. J., Scalia R., Goldstein B. J. (2003) Involvement of AMP-activated protein kinase in glucose uptake stimulated by the globular domain of adiponectin in primary rat adipocytes. Diabetes 52, 1355–1363 [DOI] [PubMed] [Google Scholar]
- 18. Gao J., Ye H., Serrero G. (2000) Stimulation of adipose differentiation-related protein (ADRP) expression in adipocyte precursors by long-chain fatty acids. J. Cell Physiol. 182, 297–302 [DOI] [PubMed] [Google Scholar]
- 19. Sambandam N., Lopaschuk G. D. (2003) AMP-activated protein kinase (AMPK) control of fatty acid and glucose metabolism in the ischemic heart. Prog. Lipid Res. 42, 238–256 [DOI] [PubMed] [Google Scholar]
- 20. LaRue K. E., McCall C. E. (1994) A labile transcriptional repressor modulates endotoxin tolerance. J. Exp. Med. 180, 2269–2275 [DOI] [PMC free article] [PubMed] [Google Scholar]
- 21. Vats D., Mukundan L., Odegaard J. I., Zhang L., Smith K. L., Morel C. R., Wagner R. A., Greaves D. R., Murray P. J., Chawla A. (2006) Oxidative metabolism and PGC-1β attenuate macrophage-mediated inflammation. Cell Metab. 4, 13–24 [DOI] [PMC free article] [PubMed] [Google Scholar]
- 22. Zhong L., Mostoslavsky R. (2010) SIRT6. A master epigenetic gatekeeper of glucose metabolism. Transcription 1, 17–21 [DOI] [PMC free article] [PubMed] [Google Scholar]
- 23. Kim H. S., Xiao C., Wang R. H., Lahusen T., Xu X., Vassilopoulos A., Vazquez-Ortiz G., Jeong W. I., Park O., Ki S. H., Gao B., Deng C. X. (2010) Hepatic-specific disruption of SIRT6 in mice results in fatty liver formation due to enhanced glycolysis and triglyceride synthesis. Cell Metab. 12, 224–236 [DOI] [PMC free article] [PubMed] [Google Scholar]
- 24. Weidemann A., Johnson R. S. (2008) Biology of HIF-1α. Cell Death. Differ. 15, 621–627 [DOI] [PubMed] [Google Scholar]
- 25. Gleyzer N., Scarpulla R. C. (2011) PGC-1-related coactivator (PRC), a sensor of metabolic stress, orchestrates a redox-sensitive program of inflammatory gene expression. J. Biol. Chem. 286, 39715–39725 [DOI] [PMC free article] [PubMed] [Google Scholar]
- 26. Zhong L., D'Urso A., Toiber D., Sebastian C., Henry R. E., Vadysirisack D. D., Guimaraes A., Marinelli B., Wikstrom J. D., Nir T., Clish C. B., Vaitheesvaran B., Iliopoulos O., Kurland I., Dor Y., Weissleder R., Shirihai O. S., Ellisen L. W., Espinosa J. M., Mostoslavsky R. (2010) The histone deacetylase Sirt6 regulates glucose homeostasis via Hif1α. Cell 140, 280–293 [DOI] [PMC free article] [PubMed] [Google Scholar]
- 27. Rodgers J. T., Lerin C., Haas W., Gygi S. P., Spiegelman B. M., Puigserver P. (2005) Nutrient control of glucose homeostasis through a complex of PGC-1α and SIRT1. Nature 434, 113–118 [DOI] [PubMed] [Google Scholar]
- 28. Yoza B. K., Hu J. Y., Cousart S. L., Forrest L. M., McCall C. E. (2006) Induction of RelB participates in endotoxin tolerance. J. Immunol. 177, 4080–4085 [DOI] [PubMed] [Google Scholar]
- 29. Imai S., Guarente L. (2010) Ten years of NAD-dependent SIR2 family deacetylases. Implications for metabolic diseases. Trends Pharmacol. Sci. 31, 212–220 [DOI] [PMC free article] [PubMed] [Google Scholar]
- 30. Benita Y., Kikuchi H., Smith A. D., Zhang M. Q., Chung D. C., Xavier R. J. (2009) An integrative genomics approach identifies Hypoxia Inducible Factor-1 (HIF-1) target genes that form the core response to hypoxia. Nucleic Acids Res. 37, 4587–4602 [DOI] [PMC free article] [PubMed] [Google Scholar]
- 31. Yeung F., Hoberg J. E., Ramsey C. S., Keller M. D., Jones D. R., Frye R. A., Mayo M. W. (2004) Modulation of NF-κB-dependent transcription and cell survival by the SIRT1 deacetylase. EMBO J. 23, 2369–2380 [DOI] [PMC free article] [PubMed] [Google Scholar]
- 32. Zhang Z., Lowry S. F., Guarente L., Haimovich B. (2010) Roles of SIRT1 in the acute and restorative phases following induction of inflammation. J. Biol. Chem. 285, 41391–41401 [DOI] [PMC free article] [PubMed] [Google Scholar]
- 33. Hotchkiss R. S., Opal S. (2010) Immunotherapy for sepsis. A new approach against an ancient foe. N. Engl. J. Med. 363, 87–89 [DOI] [PMC free article] [PubMed] [Google Scholar]
- 34. Shi L. Z., Wang R., Huang G., Vogel P., Neale G., Green D. R., Chi H. (2011) HIF1α-dependent glycolytic pathway orchestrates a metabolic checkpoint for the differentiation of TH17 and Treg cells. J. Exp. Med. 208, 1367–1376 [DOI] [PMC free article] [PubMed] [Google Scholar]
- 35. Michalek R. D., Gerriets V. A., Jacobs S. R., Macintyre A. N., MacIver N. J., Mason E. F., Sullivan S. A., Nichols A. G., Rathmell J. C. (2011) Cutting edge. Distinct glycolytic and lipid oxidative metabolic programs are essential for effector and regulatory CD4+ T cell subsets. J. Immunol. 186, 3299–3303 [DOI] [PMC free article] [PubMed] [Google Scholar]
- 36. Zhang J., Lee S. M., Shannon S., Gao B., Chen W., Chen A., Divekar R., McBurney M. W., Braley-Mullen H., Zaghouani H., Fang D. (2009) The type III histone deacetylase Sirt1 is essential for maintenance of T cell tolerance in mice. J. Clin. Invest. 119, 3048–3058 [DOI] [PMC free article] [PubMed] [Google Scholar]
- 37. Gerriets V. A., Rathmell J. C. (2012) Metabolic pathways in T cell fate and function. Trends Immunol. 33, 168–173 [DOI] [PMC free article] [PubMed] [Google Scholar]
- 38. van der Windt G. J., Everts B., Chang C. H., Curtis J. D., Freitas T. C., Amiel E., Pearce E. J., Pearce E. L. (2012) Mitochondrial respiratory capacity is a critical regulator of CD8(+) T cell memory development. Immunity 36, 68–78 [DOI] [PMC free article] [PubMed] [Google Scholar]
- 39. Pearce E. L., Walsh M. C., Cejas P. J., Harms G. M., Shen H., Wang L. S., Jones R. G., Choi Y. (2009) Enhancing CD8 T-cell memory by modulating fatty acid metabolism. Nature 460, 103–107 [DOI] [PMC free article] [PubMed] [Google Scholar]