

Abstract
BACKGROUND
We previously cloned prosaposin (PSAP) from metastatic castrate-resistant prostate cancer (mCRPCa) cells and demonstrated its genomic amplification and/or overexpression in metastatic PCa cell lines, xenografts, and lymph node metastases. The clinicohistopathological significance of serum-PSAP levels and its tissue expression and association with predictive or prognostic variable in primary or advanced PCa are not known.
METHODS
We examined PSAP expression by immunohistochemical staining during early embryogenic development of the prostate and within a large tissue microarray which included 266 benign and malignant prostate tissues. In addition, serum PSAP levels in the age-adjusted normal male population and in 154 normal individuals and patients with primary or mCRPCa were measured by an ELISA assay.
RESULTS
Univariate and multivariate analyses revealed a significant and inverse association between PSAP expression and clinical stage II and III tumors, dominant Gleason patterns 3 and 4, and seminal vesicle invasion. In the normal male population, the lowest serum-PSAP level was detected before puberty, peaked at the most reproductive age group (20–39 years old), and then, decreased to a range between the two groups for men above 40 years old. Regardless of age and when compared with normal individuals, serum-PSAP levels significantly decreased in primary organ-confined PCa, but increased in those with mCRPCa.
CONCLUSION
Our results show that PSAP has the potential to differentiate between primary and advanced PCa. Additional large-scale studies are needed to define the usefulness of tissue expression or serum-PSAP levels as a diagnostic or prognostic marker or as a therapeutic target in PCa.
Keywords: Prosaposin, Prostate Cancer, Metastasis, Castrate-resistant
INTRODUCTION
Prostate cancer is one of the most frequently diagnosed and the second most lethal cancer in men in western countries. In addition to male hormones, other polypeptide growth factors, cytokines, and small neuroactive peptides have been implicated in normal and neoplastic growth and androgen-independent (AI) and metastatic progression of PCa. It is not surprising that in PCa, the expression, regulation, and production of many of these non-androgenic factors are changed [1–6]. Alterations may take the form of up- or down-regulation of growth factors or their receptors, a change from paracrine to autocrine mediation of growth factor signaling pathways, and/or the amplification of common signal transduction pathways.
Hormonal therapy (androgen ablation) serves as the first-line therapy for metastatic PCa, commonly leading to a temporary radiographic, symptomatic, and biochemical regression. In many patients this will be followed by the development of castrate-resistant (formerly hormone refractory) progressive disease which is only moderately sensitive to chemotherapy or radiotherapy [7–9]. Hormone-refractory disease (i.e., androgen independent) was formerly defined as progression (either biochemical/PSA or tumor) while serum testosterone levels were at castrate levels (<50ng/dl). Contemporary understanding of the role of even low levels of testosterone on the growth of PCa has prompted the use of the clinical term castrate-resistant PCa [10].
The serum Prostate-specific antigen (PSA) level is currently the best available prostate-specific tumor marker. Although the serum PSA test has extremely high organ specificity, its ideal role in the screening and diagnosis or prostate cancer is inadequate due to a lack of cancer specificity. Although PSA is effective at identifying men who may have PCa, it is often elevated in men with benign prostatic hyperplasia (BPH), prostatitis, and other benign conditions [11]. Therefore, due to the limited sensitivity and specificity of PSA, identification of additional molecular markers is needed to refine the screening criteria, diagnosis, prognosis, or treatment of PCa.
During our search for a PCa biomarker, we cloned prosaposin (PSAP) as a secreted protein overexpressed in the highly invasive and metastatic PCa cell line, PC-3 by cloning/sequencing, after probing a PC-3 cDNA library expressed in the λTriplEx phagemid expression vector with a polyclonal rabbit antibody generated against pooled human seminal plasma [12]. In addition, we discovered PSAP overexpression and/or genomic amplification in several AI- and/or metastatic-PCa cell lines and in punch biopsy samples of LuCaP PCa xenografts and lymph node metastases [12].
PSAP is a dual function glycoprotein that exists as the lysosomal precursor of sphingolipid activator proteins, known as saposins, and function as essential co-factors for sphingolipid hydrolases [13]. Secreted PSAP is a well-known potent neurotrophic factor expressed in various cell types and body fluids such as milk, serum, and seminal fluid [14,15]. Total PSAP deficiency is lethal in both man and mice [16–18]. However, deficiency of individual saposin proteins is responsible for a number of lipid storage diseases [17–19]. Homozygous inactivation of the PSAP gene in mice led to shrinkage and atrophic changes in the male reproductive organs, with gross pathological features including a reduction in size and weight of the testes, seminal vesicle, and prostate gland [16]. Histological examination of the involuted prostate tissue revealed the presence of undifferentiated epithelial cells.
We have previously demonstrated that treating PCa cell lines with PSAP and its bioactive derivatives (e.g., TX14A peptide, saposin C) increases cell survival and anti-apoptotic response under serum-starvation or upon exposure to apoptogenic agents, stimulates migration and invasion, and activates PI3K/Akt- and MAPK-signaling pathways in PCa cell lines [20–22]. We recently demonstrated that in metastatic PCa cells, transient or stable down-modulation of PSAP by RNA-interference via a lysosomal proteolysis-dependent pathway decreased β1A-integrin expression, its cell-surface clustering, cell adhesion to basement membrane proteins, migration, and invasion; led to disassembly of focal adhesion complex; and decreased phosphorylative activity of focal adhesion kinase (FAK) and its association with Src-kinase and other downstream adaptor molecules such as paxillin [23]. Overall, these data strongly support important multi-potential paracrine and intracrine regulatory functions for PSAP in malignancy-associated phenotypes and during the multistep process of invasion and metastasis in PCa.
For the first time, we describe in this article the development of a sensitive sandwich ELISA assay for the measurement of serum-PSAP levels in an age-adjusted normal male population. In order to determine the clinicohistopathological significance of PSAP expression and its association with predictive or prognostic variables of PCa, we analyzed tissue expression of PSAP in tissue microarrays (TMAs) with 266 benign and malignant prostate tissues and in 154 serum samples from patients with primary or metastatic and/or castrate-resistant PCa.
MATERIALS AND METHODS
Expression and Purification of PSAP Calibrator in CHO-K1 Cells
The construction of a recombinant human (rh)-PSAP expression vector, the expression, and the purification of biologically active rhPSAP have been previously described [23]. Briefly, the full-length cDNA of PSAP gene (GenBank Accession No. NP002769) was synthesized, tagged at the C-terminal with hexa-histidine (His6), and subcloned into the mammalian expression vector pSectag2A (Invitrogen, Carlsbad, CA). After bacterial transformation and bi-directional sequence verification, stable CHO-K1 clones expressing high levels of the secreted rhPSAP were obtained using Zeocin as a selection antibiotic. The recombinant PSAP protein was purified from a culture supernatant using imidazole and Ni-NTA Superflow Resins (Qiagen, Santa Clara, CA). The size and purity of the purified proteins were determined by using 4–20% Tris-Glycine gel electrophoresis, coomassie blue staining, silver staining, and western blotting with previously characterized anti-PSAP antibodies [23]. The molecular size of rhPSAP in CHO-K1 cells was similar to that of the native PSAP secreted by normal or malignant prostate cells [23].
Ethical Considerations
Ethical approval was obtained from the Institutional Review Board at Louisiana State University Health Sciences Center, School of Medicine, New Orleans, LA.
Clinical Cohorts, Tissue Microarray (TMA), and Immunohistochemical Analysis
The PCa TMA included radical prostatectomy specimens obtained from 154 patients with localized primary PCa. Clinicohistopathological characteristics of the TMA study subjects included age at surgery, preoperative serum PSA, tumor volume, clinical stage, Gleason score, dominant Gleason pattern, seminal vesicle invasion (SVI), and lymph node involvement according to the provider (Accumax Array, Accurate Chemical & Scientific Corp, Westbury, NY). Developmental prostate tissues were obtained from Xijing Hospital and the First Affiliated Hospital of Medical School, Xi’an Jiaotong University with respective institutional approval. Mouse monoclonal anti-human PSAP (Abnova, Walnut, CA; at 1:100 dilution) was used as the primary antibody. This antibody does not cross-react with PSAP bioactive derivatives (i.e, saposins) in immunohistochemical staining of paraffin sections. A diaminobenzidine (DAB) substrate kit supplied and customized by Ventana Medical Systems (Tuscan, AZ) for horseradish peroxidase as the enzyme marker. After deparaffinization and hydration in three separate solutions of Xylene (20 min in the first and 20 sec each in the last two solutions), followed by three separate solutions of 100% ethanol (4 min in the first and 20 sec in each of the last two solutions), followed by 95% ethanol for 1 min and then, rinsed in distilled water for 5 minutes. Sections were then incubated in 3% hydrogen peroxide for 5 min to prevent endogenous peroxidase activity and washed in distilled water for 15 min. Non-specific binding was blocked with 20% goat serum for 30 minutes, incubated with the primary antibody and counterstained with hematoxylin for 4 minutes. Then, slides were rehydrated by immersion into 95% and 100% ethanol followed by Xylene each time for two minutes. To verify the staining specificity, additional serial sections were used as negative controls by omitting the primary antibody and replacing it with a non-immune serum (Ventana Medical Systems, Tuscan, AZ). Anti-PSAP immunoreactivity in each case was evaluated in relation to the dominant Gleason pattern. PSAP-staining in each case was graded semi-quantitatively as follows: 0 = no staining, 1 = weak staining, 2 = moderate staining and 3 = strong staining. Descriptive examinations and of cell type-specific anti-PSAP immunoreactivity (in neoplastic, hyperplastic and normal glands, stroma, vessels, etc) in the sections were completed by Drs. Ruiz Bernardo and Gissue Azabdaftari. Stained sections were also examined independently and on a random basis by Dr. Koochekpour. The final scores were determined after comparing and reaching a consensus agreement.
Serum Samples
Serum samples used to determine normal distribution of PSAP in the healthy age-adjusted male population were obtained from Xpressbio (Thurmont, MD). These samples were measured in three groups of age-adjusted subjects (<13, 20–32, and 40–80 years old). Serum samples, used to evaluate PSAP levels in normal individuals and patients with primary or bone-metastatic or castrate-resistant PCa, were obtained from the biospecimen core facility at the Louisiana Cancer Research Consortium and the tumor bank at the University of Washington Medical Center after informed consent and without any personal identifiers.
Development of a Sandwich-ELISA Assay for Serum-PSAP
Due to the lack of a commercially available methodology to quantify serum PSAP, we developed an indirect sandwich ELISA to immuno-quantify serum PSAP levels in human. The capture antibody was a mouse monoclonal anti-human PSAP (Abnova, Walnut, CA; at 0.5 μg/ml in PBS). This antibody recognizes PSAP and two of its bioactive derivatives (saposins C and D) in concentrated culture supernatants, cell lysates of PCa cell lines (e.g., PC-3 and DU-145), and in rhPSAP, expressed and purified from stable CHO-K1 transfectants [23]. The detection antibody was an affinity purified rabbit polyclonal antibody raised against rh-PSAP (Cat # 10801-1-AP; Protein Tech Group, Chicago, IL) which recognizes soluble PSAP and does not cross-react with other saposins. The detection antibody was HRP conjugated using EZ-Link Plus Activated Peroxidase kit according to manufacturer instruction (Proteintech Group, Rockford, IL) and used at final 1 μg/ml in PBS. The optimal working concentration of antibodies was determined by chessboard titration of both capture and HRP-conjugated detection antibodies.
Costar microtiter plates were coated with 100 μl of capture antibody and incubated overnight at 4°C. After discarding the solution by inverting the plate, plates were washed five times with 250 μl of wash buffer (WA126, R & D Systems, Minneapolis, MN) and, after the last wash, any remaining liquids were removed by inverting the plates against a clean paper towel. Then, the wells were then blocked with 300 μl of 5% of normal rabbit serum in a washing buffer for 2 h at room temperature and were washed as described above. Serum samples (1:50 dilution in 5% BSA/PBS), calibrators, and controls were added at 100 μl per well and, after sealing with adhesive strips (DY992, R&D Systems), they were incubated for 2 h at room temperature. After washing the wells, 100 μl of detection antibody was added and the plates were incubated for 2 h at room temperature. The wells were washed and 100 μl of substrate reagent mix (DY999, R&D Systems, Minneapolis, MN) was added and incubated for 20 minutes in a dark shelf at room temperature. The reaction was terminated by adding 50 μl of stop solution (2N sulfuric acid; DY994, R&D Systems). The absorbance was read at 450 nm using 470 nm as the reference wavelength.
Calibrators, Control specimens, and Standard Curve
For generation of standard curve, we prepared PSAP stock solution at high concentration (1 μg/ml) from our purified rhPSAP and stored at −80°C [23]. In addition, for internal positive control, we aliquoted a large volume of three positive control sera obtained from healthy adult males (40–45 years old) and stored at −80°C. To minimize the inter-assay variances, we purchased several batches of the two commercially available capture and detection antibodies from the same lot and, after mixing them in single tubes, they were aliquoted in several tubes. For the entire study, we used the HRP-conjugated detection antibody from a single preparation. For each ELISA plate, a standard curve was generated by measuring the absorbance of a serially diluted stock rhPSAP standard and plotting the average optical density (O.D) obtained for each of the standard concentrations on the vertical (Y) axis versus corresponding PSAP concentration on the horizontal (X) axis. Serum PSAP levels for positive control and test samples were calculated from the best fit linear curve that was generated from the PSAP standard by Microsoft Excel. The calculated regression value (R2) of ≥0.985 was accepted for each ELISA plate.
Analytical Characteristics of the ELISA Assay
The minimum detectable amounts for serum PSAP was 0.62 ng/ml and was calculated by adding two standard deviations to the mean optical density (OD) value of fifteen zero standard replicates and determining the corresponding concentration. The standard curve reproducibility was demonstrated in ten independent assays. The specificity was tested by using culture supernatants or lysates from PC-3 and LNCaP cell lines known to express high and low amounts of PSAP on Western blotting [12,23]. Since PSAP and individual saposin molecules (A, B, C, D) exist as soluble molecules in the serum, we also examined antibody cross-reactivity with saposins. We performed Western blotting using both capture and detection antibodies and different concentrations of recombinant human-saposin A, -saposin B, -saposin C, or -saposin D [24]. In addition, we included individual saposins either alone or in combination with rhPSAP (as standard) and followed our established protocol for sandwich ELISA.
The intra-assay variance was evaluated in ten replicates for three serum samples of known concentrations on one plate. The inter-assay precision was tested in three independent assays for three control samples in triplicates. The recovery of PSAP was measured by using a positive control serum spiked with a known concentration of rhPSAP which was serially diluted with a zero standard and assayed as triplicates. Stability of serum-PSAP was determined by incubating aliquots of serum samples of known PSAP concentrations at −20° C or −70 ° C for 3, 6, 12, 18, 24, 36, and 48 months. These serum samples were examined by sandwich ELISA and compared with parental serum samples. Matrix effect was evaluated by performing ELISA on serial dilutions of a serum sample with known concentration of PSAP. Serum PSAP values of different dilutions were compared with an undiluted original sample.
Statistical Design and Data Analysis
Statistical analyses were performed using SAS 9.1 (SAS Institute, Cary). Serum-PSAP quantitation was analyzed in age-adjusted normal population ranging from 2 to 79 years old. Independently, PSAP concentrations in the serum of PCa patients with primary or advanced disease were compared to a healthy population of adult males from age 40 to 79 years old. For this group, age and PSA categories were created as: 40–49, 50–59, 60–69, 70–79 and ≤4, 4.1–10, ≥10.1, respectively.
For TMAs, the association of the intensity of PSAP expression was evaluated in univariate and multivariate analyses using Cochran-Mantel-Haenszel statistics (ANOVA row mean scores). For serum samples, all measurements were log-transformed prior to statistical analysis. Serum PSAP levels in normal individuals, primary PCa with pathological stage T2 or T3, and bone metastatic or castrate-resistant tumors were compared using a mixed model approach to account for unequal variances; age was considered as a potential confounder. After performing a 2-way ANOVA, multiple comparisons were implemented with the Tukey-Kramer procedure to maintain an overall significance of 0.05. The association of PSAP and PSA was explored with linear regression for individual subgroups of the normal subjects, patients with primary (pT2 or pT3), or advanced PCa.
RESULTS
PSAP Is Differentially Expressed During Natural History of Prostate Growth and Development
Due to the lack of any systematic evaluation of the PSAP expression in the prostate, we investigated PSAP expression during the natural history of prostate growth and development using embryonic prostate tissues of 3, 4, and 5 month gestational-age embryos and in the normal prostate tissues derived from 22, 36, and 55 years old adults. This analysis revealed that an early weak expression of PSAP starts at 3 months in rudimentary epithelial and mesenchymal cells (Figure 1A), but becomes more visible at 4 months of age during the early morphogenesis steps when prostatic ducts are lengthening, branching, and canalizing to form primitive glandular structure (Figure 1B). At this stage, nuclear staining is detectable in only few of the luminal epithelial cells. At 5 months of gestational age, when more defined glandular structures are formed, PSAP expression could be easily detected as dense nuclear and weak focal cytoplasmic staining in mesenchymal and epithelial cells (Figure 1C). In early adulthood (22 years old), while nuclear staining is absent, diffused heterogeneous cytoplasmic staining is detectable in benign glands with staining enhancement towards the luminal border of acinar cells (Figure 1D). Compared to early adulthood, the intensity of PSAP staining slightly decreases at mid-age, but shows a pattern similar to that of early adulthood (Figure 1E). In patients with BPH, the PSAP expression pattern in hyperplastic glands appears as a diffuse homogeneous weak cytoplasmic (Figure 1F).
Figure 1. PSAP expression during the natural history of prostate growth and development.

Tissue sections were stained for PSAP using a mouse monoclonal antibody against human prosaposin and diaminobenzidine as a chromogen (brownish pigmentation). Sections were also counterstained with hematoxylin (blue stain). A: Prostate tissue at 3 months embryonic gestation shows weak cytoplasmic staining in poorly formed glandular structure (arrows). B: Prostate tissue at 4 months embryonic gestation shows weak focal staining (arrows) in more defined glandular structures. C: Prostate tissue at five months embryonic gestation shows weak focal cytoplasmic staining and strong focal nuclear staining in both glandular epithelium and stroma (arrows). D and E: Diffuse heterogeneous cytoplasmic staining in benign glands with staining enhancement towards the luminal border (black arrows) of the acinar cells in early adulthood (D: 22 years old and E: 36 years old). F: PSAP expression in patient with BPH appears as diffuse homogeneous weak cytoplasmic staining. Original magnifications, × 200 (A, C, E); ×100 (B, D, F).
Technical Issues Related to Immunohistochemical Analysis of TMAs
A total of 154 tissue samples out of 162 (95%) in TMA cores were informative for evaluation of PSAP expression (Table I). PSAP immunostaining was detected in 153 out of 154 interpretable PCa samples (99.3%) which also contain 96 corresponding BPH cases; the remaining cases were not available for analysis due to the core loss in the section or staining process. The number of LN positive cases (n = 2), PCa tissues with well-differentiated (Gleason patterns 1 and 2, n = 2), a poorly-differentiated tumor with Gleason pattern 5 (n = 8), and cases with stage I (n = 0) and stage IV (n = 4) tumors were too low for statistical analysis.
TABLE I.
Clinical and Pathological Characteristics of the Study Cohort on TMA (n = 154)
| Characteristics | Value |
|---|---|
| Median (range) age at surgery (years) | 62 (45–78) |
| Mean (range) PSA (ng/ml) | 13.04 (0.02–98.5) |
| Mean prostate volume (range) (ml) | 27 (5–95) |
| Mean tumor volume (rang) (ml) | 2.57 (0.08–3.5) |
| Age (year) | |
| <50 | 7 |
| 51–60 | 44 |
| 61–70 | 95 |
| >70 | 8 |
| PSA (ng/ml) | |
| ≤ 4 | 44 |
| 4.1–10 | 56 |
| >10.1 | 54 |
| Clinical Stage | |
| I | 0 |
| II | 89 |
| III | 61 |
| IV | 4 |
| Gleason Sum | |
| ≤6 | 11 |
| 7 | 61 |
| ≥ 8 | 82 |
| Analyzable Dominant Gleason pattern | |
| 1 | 0 |
| 2 | 2 |
| 3 | 71 |
| 4 | 70 |
| 5 | 8 |
| PIN | 16 |
| Seminal Vesicle Invasion | |
| Negative | 129 |
| Positive | 25 |
| Nodal Involvement | |
| No | 152 |
| Yes | 2 |
Note: Due to missing data, the numbers do not add up to 154 for cases in different categories.
Descriptive analysis showed that, among BPH areas within PCa tissues cores, PSAP expression was negative in 32% of the cases (31 out of 96), weak to moderate staining in 61%, and strong staining in only 7% (Table II). However, of the total of 154 PCa cases, PSAP expression was absent in only 1 case, weak to moderate in 52% of cases, and strong staining in 47%.
TABLE II.
Frequency Distribution of Anti-PSAP Staining Intensity in TMA
| Tissue type | Analyzable cases | PSAP expression
|
|||
|---|---|---|---|---|---|
| 0 | Weak (1+) | Moderate (2+) | Strong (3+) | ||
| Cancer | 154 | 1 (0.65%) | 24 (16%) | 56 (36%) | 73 (47%) |
| Adjacent BPH* | 96 | 31 (32%) | 18 (19%) | 40 (42%) | 7 (7%) |
| PIN† | 16 | 1 (6%) | 3 (19%) | 6 (37.5%) | 6 (37.5%) |
BPH, benign prostatic hyperplasia
PIN, prostate intraepithelial neoplasia
Specificity of anti-PSAP immuno-reactivity was demonstrated by deleting the primary antibody or replacing it with a non-immune serum (Figure 2A). We observed a diffuse and homogeneous cytoplasmic staining pattern in BPH and normal glandular structures (Figure 2B). Stroma showed focal weak cytoplasmic staining intensity. Malignant cells in well-differentiated tumors with Gleason pattern 2 showed strong nuclear staining (approximately 90% of nuclei) (Figure 2C). This unique staining pattern was very similar to an embryonic prostate at 5 months of gestational age (Figure 1C) and was not observed in any of the high grade tumors (e.g., dominant Gleason pattern ≥3) (Figure 2D–F). Malignant acinar cells in Gleason 3 to 5 tumors showed marked, heterogeneous granular cytoplasmic staining with increased staining intensity towards luminal surface. In addition, there was a mild focal cytoplasmic staining in stroma (Figure 2D–F). Figure 2G presents a typical tumor region with an adjacent BPH area and infiltrating stromal cells. It shows different patterns and intensity of staining from mildly diffuse cytoplasmic staining and intra-luminal prostatic secretions staining in BPH to intense granular cytoplasmic staining in tumor tissues with peri-luminar enhancement. Figure 2H shows a Gleason 9 (4+5) tumor with marked diffuse granular cytoplasmic staining in PCa cells with enhanced peri-nuclear staining in scattered cells. In addition, there is mild focal cytoplasmic staining in the stroma and endothelial cells in vessels.
Figure 2. PSAP expression in normal and malignant prostate tissues.

Negative control (A), benign prostatic tissue (B) stained in the absence of the primary antibody. Benign prostate hyperplasia showing diffuse and homogeneous cytoplasmic staining in glandular structures. Prostate adenocarcinoma Gleason’s grade 2 shows strong nuclear staining of PSAP in approximately 90% of nuclei (C); this pattern is not observed in higher grade tumors. There is diffuse, uniform cytoplasmic staining in all of the malignant acinar cells. Stroma shows rare scattered nuclear staining. Prostate adenocarcinoma Gleason’s grade 3 (D), grade 4 (E), and grade 5 (F); malignant acinar cells shows marked heterogeneous granular cytoplasmic staining. The staining intensity increases towards the lumen of the acinar cells. There is mild focal cytoplasmic staining in the stroma. In scattered cells there is enhanced perinuclear staining. Panel G shows different patterns and intensity of staining from mild diffuse cytoplasmic staining as well as intra-lumen prostatic secretions staining in benign prostatic hyperplasia to intense granular cytoplasmic staining in adenocarcinoma with peri-luminar enhancement. Prostatic adenocarcinoma Gleason grade 4+5 (H): Malignant acinar cells show marked diffuse granular cytoplasmic staining. In scattered cells there is enhanced peri-nuclear staining. Arrows in panel C depict strong nuclear staining. White arrow in Panel F depicts perinuclear enhancement. Black arrows depict perinuclear enhancement and white arrows depict endothelial cells cytoplasmic PSAP staining. There is mild focal cytoplasmic staining in the stroma (S) and endothelial cells (E) in vessels. Original magnifications, × 200 (A–D, F, H); ×100 (E, G). BPH, benign prostatic hyperplasia; CA, cancer.
We also evaluated PSAP expression in high-grade prostate intraepithelial neoplasia (PIN) and tumors with detectable perineural invasion (PNI). As shown in Figure 3A, diffuse granular cytoplasmic staining with an enhancement towards the luminar surface was detected in high-grade PIN. Contrary to all tumors, stromal cells did not express PSAP in PINs. Figure 3B depicts an area of perineural invasion (PNI) with tumor cells infiltrating around the nerves and show diffuse cytoplasmic staining. While neural structures are negative for staining, the background stroma shows mild focal cytoplasmic staining. We also found infiltrating cells of hematopoietic origin in the stromal compartment. Macrophages in the stroma as well as glandular lumens show heterogeneously strong cytoplasmic staining (Figure 3C). Although we detected cytoplasmic staining in polymorphonuclear cells, the lymphocytes and plasma cells were negative for PSAP staining (data not shown). In general, corpora amylacea and intra-luminal prostatic secretions show intense staining (Figure 3D), and crystalloids were negative (data not shown). PSAP was also absent in basal epithelial cells.
Figure 3. PSAP expression in various tissue constituents of malignant prostate.
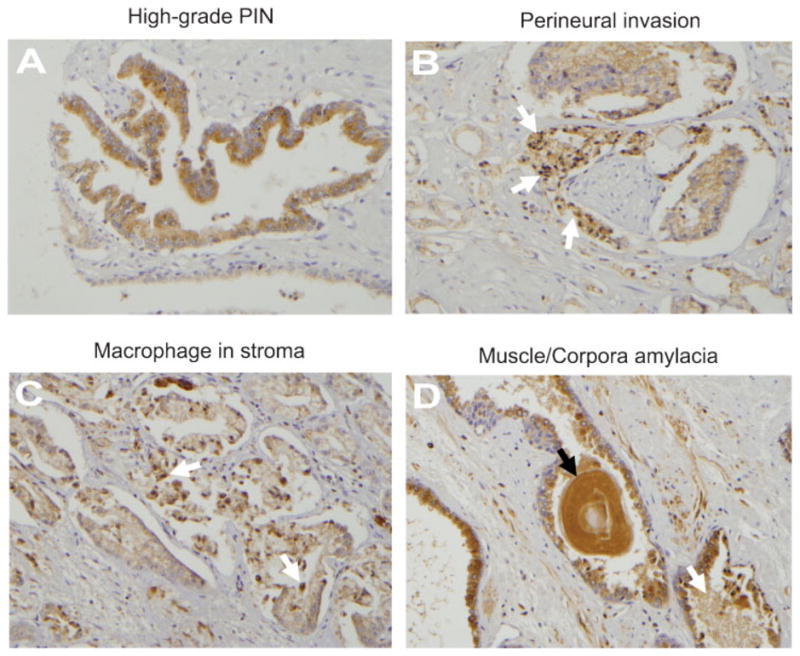
A: High grade PIN; showing diffuse granular cytoplasmic staining with enhancement towards the lumen of the acinar cells cytoplasm. B: Perineural invasion (arrows) in a Gleason’s grade 4 tumor; malignant cells wrapping around the nerve show diffuse cytoplasmic staining. Neural structures are negative for staining. The background stroma shows mild focal staining. C: Macrophage infiltration (arrows) in the stroma of a Gleason’s grade 3 tumor. All infiltrating macrophages in the stroma, as well as glandular lumen, show dense heterogeneous cytoplasmic staining. Arrows depict intra-luminal macrophages. D: Corpora amylacea (black arrow) and intra-luminal prostatic secretions (white arrow) in a Gleason grade 3 tumor show intense staining. Original magnification, × 200.
Univariate Analysis of the Association of PSAP Expression with Clinicohistopathological Parameters in TMAs
We assessed the potential association of the intensity of PSAP expression in malignant tumors with stage, preoperative serum PSA, Gleason sum, dominant Gleason pattern, age, SVI, tumor location (lobar and zonal), tumor vasculature, prostate volume, tumor size, PSAP immunostaining in PIN, or in adjacent BPH areas. Using Cochran-Mantel-Haenszel statistics (ANOVA row mean scores), we found that the average PSAP staining score in malignant tumors differs significantly by clinical stage II or III (p = 0.0415), by dominant Gleason pattern 3 or 4 (p = 0.0119), and by SVI status (p = 0.0091) (Table 3). Weak to moderate PSAP expression was detected in 46% of stage II and 61% of stage III tumors and strong PSAP staining was detected in 54% of stage II and in 39% of stage III tumors. With respect to dominant Gleason pattern in TMA cores, weak to moderate PSAP expression was present in 41% of Gleason 3 and in 61% of Gleason 4 cases and strong staining was observed in 59% of Gleason 3 and in 39% of Gleason 4 tumors. In addition, strong PSAP expression was observed in 24% of cases (6 out of 25) with a positive history of SVI and in 52% of those without SVI (Table III). We found no association between PSAP expression in the tumors and reported Gleason sum (according to the source of TMA) (p = 0.2411), age (p = 0.6716), PSA (p = 0.6286), LN status (p = 0.5470), PIN (p = 0.2552), lobar distribution of tumor (p = 0.3936), zonal distribution of the tumor (p = 0.0789), tumor vasculature (p = 0.2298), tumor size (p = 0.4380), tumor volume (p = 0.6069), and PSAP staining in the adjacent BPH compartment of the tumor cores (p = 0.4671). Considering our study limitations (insufficient number of cases with stage I and IV tumors, well-differentiated (Gleason 1 and 2) and poorly differentiated (Gleason 5) tumors, these data suggest that moderate to strong tissue expression of PSAP is inversely correlated to clinical stage, SVI, and dominant Gleason pattern.
TABLE III.
Univariate Analysis of PSAP Expression in TMA Cohorts
| Variable | Analyzable Cases | PSAP expression
|
P-Value* | ||
|---|---|---|---|---|---|
| Weak (1+) | Moderate (2+) | Strong (3+) | |||
| Stage | |||||
| II | 89 | 11 (12%) | 30 (34%) | 48 (54%) | |
| III | 61 | 14 (23%) | 23 (38%) | 24 (39%) | |
| Total | 150 | 0.0415 | |||
| Age | |||||
| 40–49 | 7 | 0 | 3 (43%) | 4 (57%) | |
| 50–59 | 44 | 7 (16%) | 17 (39%) | 20 (46%) | |
| 60–69 | 95 | 17 (18%) | 34 (36%) | 44 (46%) | |
| 70–79 | 8 | 1 (12.5%) | 2 (25%) | 5 (63%) | |
| Total | 154 | 0.6716 | |||
| Gleason Sum | |||||
| ≤ 7 | 70 | 11 (17.7%) | 19 (27%) | 40 (57%) | |
| 8 | 23 | 2 (8.7%) | 12 (52%) | 9 (39%) | |
| 9–10 | 61 | 12 (20%) | 25 (41%) | 24 (39%) | |
| Total | 154 | 0.2411 | |||
| Dominant Gleason | |||||
| 3 | 71 | 7 (10%) | 22 (31%) | 42 (59%) | |
| 4 | 70 | 14 (20%) | 29 (41%) | 27 (39%) | |
| Total | 141 | 0.0119 | |||
| SVI † | |||||
| No | 129 | 18 (14%) | 44 (34%) | 67 (52%) | |
| Yes | 25 | 7 (28%) | 12 (48%) | 6 (24%) | |
| Total | 154 | 0.0091 | |||
The association between intensity of PSAP staining and different parameters was evaluated using the Cochran-Mantel-Haenszel test.
SVI, seminal vesicle invasion.
Multivariate Analysis of PSAP Expression in TMAs
After adjusting for serum-PSA levels, we detected an association between PSAP expression and dominant Gleason patterns 3 and 4 (p = 0.0144; Table IV). This association was statistically significant for serum-PSA < 4.0 ng/ml only (p = 0.0264). Strong PSAP-staining was detected in 57% of moderately differentiated (Gleason 3) tumors and in only 3% of poorly differentiated (Gleason 4) tumors. In addition, we also discovered a statistically significant association between PSAP staining intensity and cases with no evidence of SVI (p = 0.009) in PSA groups of ≤4 (p = 0.0113) and 4.1–10 ng/ml (p = 0.0062). Strong PSAP-immunostaining was absent in tumors with SVI for PSA levels up to 10 ng/ml. Within PSA groups of ≤4.0 ng/ml and 4.1–10 ng/ml, 45% and 58% of cases without SVI showed strong PSAP expression, respectively. As with age-adjusted groups, PCa patients between 60–69 years of age, showed a significant association between PSAP expression and tumors with dominant Gleason patterns 3 and 4 (p = 0.0184). In this age group, for Gleason 3 tumors, weak to moderate PSAP expression was detected in 37% of patients and strong expression was detected in 63% of cases. On the contrary, for less differentiated Gleason 4 tumors, weak to moderate PSAP expression was found in 63% of patients and strong staining was observed in 37% of cases.
TABLE IV.
Multivariate Analysis of PSAP Expression in TMA Cohorts
| Adjusted Variable | # | PSAP Expression
|
P-value* | |||
|---|---|---|---|---|---|---|
| Variable of interest | Weak | Moderate | Strong | |||
| PSA Grouping | Dominant Gleason | |||||
| ≤ 4.0 ng/ml | 37 | G3 | 1 (5%) | 8 (38%) | 12 (57%) | 0.0264 |
| G4 | 2 (13%) | 11 (69%) | 3 (19%) | |||
| 4.1–10 ng/ml | 50 | G3 | 4 (13%) | 6 (20%) | 20 (67%) | 0.0885 |
| G4 | 5 (25%) | 7 (35%) | 8 (40%) | |||
| ≥10.1 ng/ml | 52 | G3 | 2 (11%) | 7 (39%) | 9 (50%) | 0.5726 |
| G4 | 7 (21%) | 11 (32%) | 16 (47%) | |||
| Total | 139 | 0.0144* | ||||
| PSA Grouping | SVI | |||||
| ≤4.0 ng/ml | 39 | Neg | 2 (6%) | 16 (49%) | 15 (45%) | 0.0113 |
| Pos | 2 (33%) | 4 (67%) | 0 (0%) | |||
| 4.1–10 ng/ml | 55 | Neg | 8 (16%) | 13 (26%) | 29 (58%) | 0.0062 |
| Pos | 3 (60%) | 2 (40%) | 0 (0%) | |||
| ≥10.1 ng/ml | 58 | Neg | 18(18%) | 14 (32%) | 22 (50%) | 0.884 |
| Pos | 2 (14%) | 6 (43%) | 6 (43%) | |||
| Total | 152 | 0.009* | ||||
| Age Grouping | Dominant Gleason | |||||
| 50–59 | 43 | G3 | 3 (13%) | 8 (35%) | 12 (52%) | 0.2825 |
| G4 | 4 (20%) | 9 (45%) | 7 (35%) | |||
| 60–69 | 86 | G3 | 4 (9%) | 12 (28%) | 27 (63%) | 0.0184 |
| G4 | 9 (21%) | 18 (42%) | 16 (37%) | |||
| Total | 129 | 0.0109* | ||||
P-value for the adjusted overall association, other P-values reflect statistical significance at each level of PSA- or age-adjusted groups according to the Cochran-Mantel-Haenszel test.
SVI, seminal vesicle invasion
Development of the PSAP Immuno-qunatification Assay
Compared with the other commercially available antibodies that were tested, the selected capture and detection antibodies used in our study showed the highest sensitivity with the lowest background. We selected 0.5 μg/ml for the capture antibody and 1 μg/ml HRP-conjugated anti-PSAP antibody for the detection antibody in all assays. We chose the indicated incubation time, coating buffer, serum volume, and diluent buffer based on independent experiments that provided optimal detection sensitivity with a minimum nonspecific signal and background. The linear standard curve proved to be the best fit model within the detection concentration range (0.625–20 ng/ml) of standard PSAP. Cross-reactivity of capture and detection antibodies with other soluble saposin derivatives of PSAP that co-exist with PSAP was also determined by western blotting of individual saposins or their inclusion into ELISA assay. Our data show that among four saposin molecules, only saposin C and D could be detected by capture antibody, but not with detection antibody in our sandwich ELISA assay (data not shown). In addition, adding individual saposins to standard PSAP at different low or high concentrations did not affect or altere the expected standard curve or test samples.
Performance Characteristics of PSAP Immunoassay
The inter-assay, intra-assay, and total coefficients of variation were shown to be 5.6, 3.23, and 4.22% or less, respectively. The recovery of PSAP in a positive control serum sample was 91% (range, 86.52–95.48%).
Distribution of Serum-PSAP Levels in Age-adjusted Healthy Male Population
The serum PSAP concentration in 89 normal, male subjects was determined in three different age-adjusted groups which included <13 (n = 16), 20–32 (n = 15), and 40–80 (n = 58) year old individuals. Mean and median PSAP levels among the three age groups were significantly different (p < 0.0001). Pairwise comparison was made by least squares and Tukey procedure as shown on Table V and Figure 5. In the normal male population (n = 89), the lowest serum-PSAP level was detected at age <13 y/o; yet, it peaked for ages 20–32 y/o and then, decreased to the levels between the first two age groups for men above 40 years old.
TABLE V.
Serum PSAP Levels in Age-Adjusted Normal Male Population
| Age group | <13 | 20–32 | 40–79 | p-value* |
|---|---|---|---|---|
| N = | 16 | 15 | 58 | |
| Mean (age) ± SD | 8.13 ± 3.64 | 23.6 ± 6.70 | 64.25 ± 11.57 | |
| Mean PSAP ±SE (95% CI) | 20.5 ± 2.05 (16.1, 24.8) | 120.2 ± 6.34 (106.5, 133.8) | 76.0 ± 2.20 (71.6, 80.4) | < 0.0001 |
| Median PSAP (Min, Max) | 20.9 (6.5, 32.0) | 122.0 (80.0, 148.0) | 73.0 (46.1, 123.0) | < 0.0001 |
Pair-wise comparison of mean PSAP by age groups was performed by Tukey procedure.
Unequal variances were taken into account using the mixed models approach.
Figure 5.

Boxplot of serum PSAP levels in an age-adjusted normal male population. Measurements were log-transformed before statistical analysis by a one-way ANOVA with Tukey multiple comparison tests. Mean serum PSAP levels (horizontal lines) by age groups differ significantly.
Serum-PSAP in Normal Adult Males and in Patients with Primary or Metastatic Castrate-Resistant Prostate Cancer
Descriptive details of the entire study cohort in terms of age and PSA levels for normal individuals and patients with primary or metastatic castrate-resistant PCa (mCRPCa) is shown in Table 6. Mean PSAP levels were different but not significant among normal adults in any age groups. Serum PSA levels were significantly different among normal study subjects, patients with primary and mCRPCa (p < 0.001). Compared with the normal group, serum-PSAP levels significantly decreased in patients with primary PCa (n = 81), but increased in those with mCRPCa (n = 29) (Table VI). Regardless of age, PSAP levels were significantly different between healthy adult males (age > 40 years old) and patients with tumor stage pT2, pT3, or metastatic/castrate-resistant PCa patients (P < 0.0001) and between tumor stage pT2 or pT3 and metastatic/castrate-resistant PCa (Table VII; Figure 6).
TABLE VI.
Descriptives of the Study Cohort Used for Serum-PSAP Quantification
| Case | N= | AGE (year) | PSA (ng/ml) |
|---|---|---|---|
|
| |||
| Mean ± SD | Mean ± SD * | ||
| Median (min,max) | Median (min,max) | ||
| Normal | 44 | 59.3 ± 10.37 | 0.7 ± 0.56 |
| 60.5 (40.0, 79.0) | 0.4 (0.3, 2.7) | ||
| Primary PCa | 81 | 60.4 ± 7.83 | 8.0 ± 6.61 |
| 60.0 (44.0, 76.0) | 6.61 (1.5, 29.8) | ||
| pT2 | 58 | 62.1 ± 7.00 | 5.9 ± 3.27 |
| 62.0 (46.0, 76.0) | 5.3 (1.5, 13.1) | ||
| pT3 | 23 | 55.8 ± 8.16 | 13.7 ± 9.20 |
| 53.0 (44.0, 76.0) | 11.7 (2.8, 29.8) | ||
| Metastatic CRPCa† | 29 | 66.0 ± 9.39 | 503.7 ± 76.64 |
| 68.0 (47.0, 78.0) | 202.9 (32.6, 3863.5) | ||
Mean serum-PSA levels were significantly different (P < 0.001) between normal individuals and patients with primary PCa or metastatic castrate-resistant PCa.
CRPCa, Castrate-resistant prostate cancer
TABLE VII.
Mean Serum-PSAP Values in Age-Adjusted Study Subjects with Normal or Malignant Prostate
| Age | Normal | Primary PCa
|
Metastatic CRPCa* | P-value† | |
|---|---|---|---|---|---|
| pT2 | pT3 | ||||
| 40–49 (n=16) | 72.0 ± 6.64 (n=9) | 74.0 ± 30.18 (n=1) | 45.2 ± 10.74 (n=4) | 81.3 ± 20.52 (n=2) | 0.2403 |
| 50–59 (n=47) | 77.7 ± 3.48 (n=11) | 48.2 ± 6.74 (n=27) | 27.3 ± 4.48 (n=10) | 88.7 ± 11.85 (n=6) | 0.0001 |
| 60–69 (n=60) | 70.6 ± 2.80 (n=17) | 34.7 ± 3.37 (n=27) | 33.7 ± 5.42 (n=8) | 107.0 ± 7.54 (n=8) | 0.0001 |
| 70–79 (n=31) | 87.5 ± 8.94 (n=7) | 51.4 ± 7.62 (n=10) | 79.0 ± 15.33 (n=1) | 114.9 ± 8.15 (n=13) | 0.0003 |
| N | 44 | 58 | 23 | 29 | |
| Mean ± SE | 75.4 ± 16.4 | 43.0 ± 24.64 | 34.9 ± 18.82 | 105.0 ± 28.43 | |
| Median (Min, Max) | 73.4 (46.1, 123.0) | 32.0 (7.8, 99.0) | 25.2 (13.2, 79.0) | 101.7 (55.4–154.6) | |
CRPCa, Castrate-resistant prostate cancer
P-value corresponds to the slice test for each age group after finding the non-significant interaction (p=0.1434); mean PSAP levels differ among normal individuals and PCa patients in all age group except for the youngest age group (p=0l.2403). Malultiple comparisons were performed using ANOVA and Tukey-Kramer procedure to maintain an overall significance of 0.05.
Figure 6.

Boxplot of serum PSAP levels in normal individuals and patients with primary or mCRPCa. All serum measurements were log-transformed before statistical analysis by a one-way ANOVA with Tukey multiple comparisons test. Mean serum PSAP levels are indicated by horizontal lines.
Using multivariate analysis, after adjusting for age, there was no significant difference for PSAP levels among all study subjects at the youngest age group (40–49 years) (p = 0.9614; Table 8). However, serum PSAP levels were significantly different for the age group 50–59 years among normal cases and pT2 (p = 0.0422) or pT3 (p = 0.0001) stage tumors, between normals and metastatic-c (p = 0.0009), and between pT3 and metastatic castrate-resistant tumors (p = 0.0047). For the age group 60–69 years, PSAP levels in normal individuals were significantly different from those with primary PCa (pT2 and pT3) and mCRPCa, and between stage T2 or T3 and mCRPCa, but not between pT2 and T3 stage tumors (p = 0.999). In the oldest age group (70–79 years), the only significant statistical difference existed between primary PCa with pT2 stage and mCRPCa patients (p = 0.007) (Table VIII).
TABLE VIII.
Age-Adjusted Multi-level Comparison of Serum PSAP Levels in Normal Individuals and Patients with Primary or Metastatic CRPCa*
| Age group † | Tumor Type | Normal | Primary PCa
|
|
|---|---|---|---|---|
| pT2 | pT3 | |||
| P-value | P- value | P-value | ||
| 40–49 | Primary PCa | |||
| pT2 | 0.9999 | |||
| pT3 | 0.7332 | 0.9998 | ||
| Metastatic CRPCa | 0.9999 | 0.9999 | 0.9614 | |
| 50–59 | Primary PCa | |||
| pT2 | 0.0422 | |||
| pT3 | 0.0001 | 0.4490 | ||
| Metastatic CRPCa | 0.0009 | 0.2531 | 0.0047 | |
| 60–69 | Primary PCa | |||
| pT2 | 0.0001 | |||
| pT3 | 0.0003 | 0.999 | ||
| Metastatic CRPCa | 0.0102 | 0.0001 | 0.0001 | |
| 70–79 | Primary PCa | |||
| pT2 | 0.2138 | |||
| pT3 | 0.9999 | 0.9509 | ||
| Metastatic CRPCa | 0.6501 | 0.0007 | 0.7675 | |
CRPCa, Castrate-resistant PCa; Comparison of mean serum-PSAP levels was performed by the Tukey procedure at each age group after two-way ANOVA with non-signficant interaction.
Comparison of mean serum-PSAP levels were carried out separately for each age group; normal individuals versus primary PCa pT2 or pT3 and metastatic CRPCa.
DISCUSSION
The results of this study show that PSAP is expressed during early embryogenesis events of the prostate gland. The expression of PSAP changes from a homogeneous cytoplasmic appearance to a predominantly nuclear staining in well-differentiated Gleason 2 tumors, and to heterogeneous cytoplasmic in moderate to poorly differentiated tumors. In addition, among all different clinicohistopathological variables, there was a significant and inverse association between PSAP expression and clinical stage II and III, dominant Gleason grade 3 and 4, or SVI. These results proved to be valid for pre-operative PSA levels up to 10 ng/ml and for the age group between 60 to 69 years old patients. Our analysis on serum samples demonstrated that regardless of age and compared with normal individuals, serum-PSAP levels significantly decreased in patients with primary organ-confined PCa, but increased in those with metastatic or castrate-resistant disease.
Our observation of a high serum-PSAP level in metastatic or castrate-resistant PCa is in agreement with our previous data that demonstrated that exclusively all AI- or metastatic-PCa cell lines express very high levels of PSAP when compared to normal prostate epithelial cells, androgen-sensitive, or less aggressive tumors in several PCa progression models (e.g., LNCaP-C4-2B, PC3-PC3M, p69-M12-M2182) [23]. PSAP overexpression by metastatic PCa cells may be due to genomic amplification of PSAP, as demonstrated by our group in AI-PCa cell lines (e.g., PC-3, DU-145, and MDA-PCa 2b), LuCaP xenografts, and in punch biopsy samples of lymph node-metastases of the PCa [12]. Independently, comparative analysis of non-metastatic primary breast cancer and lymph node metastases showed that PSAP was significantly increased in lymph node metastasis [25]. It is noteworthy that high PSAP expression levels were also detected in 182 out of 223 estrogen receptor-positive primary breast cancer patients who had recurrent metastatic disease and were treated with tamoxifen as a first-line therapy [26]. In the same study, Cox univariate and multivariate analyses correlated the high PSAP expression levels in these patients with shorter progression-free survival [26]. The potential of PSAP as a biomarker of chemo-resistant PCa remains to be investigated.
For the first time, we measured serum-PSAP in the age-adjusted, normal male population. Our data showed that serum-PSAP levels are lowest during prepubescent years, peaks at the most active reproductive adult age group, and decreases to a relatively stable range in the mid- to upper-age group. In agreement with our in vitro data that demonstrated PSAP as an androgen-regulated gene [27–29], our current results strongly support a positive relationship between male hormones and PSAP. Although our study is limited by the number of samples analyzed, it indicates that tissue and serum PSAP levels inversely correlated with clinical or pathological stage (pT2 and pT3). It is not clear whether the high serum-PSAP level in advanced PCa is the direct result of overproduction of PSAP by metastatic PCa cells or it is secondary to androgen-ablation therapy or other chemotherapeutic interventions. Almost all of metastatic and/or castrate-resistant PCa cases in our serum analysis were under treatment with a variety of hormonal therapy regimens and chemotherapy agents.
Our IHC data indicate the presence of moderate to strong PSAP expression in BPH tissue, and during prostate aging, from early adulthood to higher age groups. Primary PCa at tissue and serum levels show decreased amounts of PSAP expression. Previous studies by our group and others have demonstrated PSAP as an androgen or estrogen-regulated gene in estrogen receptor positive breast cancer cells and AR-positive PCa cells [28–32]. It is plausible that during the early stages of prostate carcinogenesis, while androgen levels are normal, excess production of PSAP by proliferating PCa cells in primary tumors might trigger a negative neuroendocrine feedback loop operated by a hypothalamic-pituitary-gonadal (HPG) axis which eventually suppresses PSAP expression levels by AR-expressing PCa cells. In addition, PSAP is expressed by lactating breast cells [33,34]. The highest amount of PSAP appears a few days postpartum, decreases at the transitional milk stage, and then increases again towards the mature milk (at lactating stage) during the entire breast feeding period. Suckling of postpartum nipples triggers sensory impulses on specific hypothalamic neurons leading to hypothalamic secretion of prolactin-releasing factor which, in turn, increases anterior pituitary gland secretion of prolactin which increases milk synthesis by mammary glands [33,35]. PSAP is highly enriched in human milk. Upon termination of breast feeding and cessation of nipple-suckling (tactile stimulation), milk-PSAP will disappear in just few days [33].
Following therapeutic interventions in advanced stages of PCa, chemical or surgical castration substantially decreases androgen levels and consequently induces apoptogenic stresses on androgen-dependent or –independent tumor cells that will eventually trigger cell survival and anti-apoptotic response mechanisms including the overexpression of PSAP. Indeed, we and other investigators have reported a potent cell survival function and anti-apoptotic role for PSAP in several normal and malignant cells [20,36,37]. Therefore, PSAP overexpression might simply reflect a survival response, that is secondary to therapeutic interventions (e.g., androgen-deprivation therapy, chemotherapy, radiotherapy) in patients with metastatic and / or castrate-resistant PCa. Alternatively, PSAP may play different roles in the early stages of prostate cancer and during its progression toward metastatic or castrate-resistant state. The underlying mechanisms for its involvement in primary tumors may be distinct from metastatic tumors and function through different signaling pathways.
One important novel observation in our study is the unique nuclear expression of PSAP in more than 90% of PCa cells in the two available well-differentiated Gleason grade 2 tumors (in TMA cohort) that was similar to the embryonic prostate tissue at 5 months of gestational age. PSAP is a cytoplasmic protein and does not have a nuclear localization signal sequence; however, we can not exclude the possibility that it may be chaperoned to the nucleus by other interacting proteins or transcription factors. Indeed, it has been demonstrated that via protein-protein interactions PSAP associates with other cytoplasmic proteins [31,38]. The nuclear presence of PSAP in undifferentiated embryonic prostates and its re-appearance in PCa cells (i.e., de-differentiated epithelial cells) is suggestive of its involvement in early prostate carcinogenesis. An aberrant nuclear localization of PSAP might be triggered by other carcinogenic events and via active protein-protein interaction mechanisms. Furthermore, our data indicate an inverse association between PSAP expression and a dominant Gleason pattern reflecting the cellular differentiation status within each tumor.
PSAP is also expressed in the stromal compartment during the embryonic phase of prostate growth and development as well as in malignant tumors, intraluminal macrophages, and in areas of perineural invasion. We observed that positively stained stromal cells appeared mostly close to positively stained foci of tumor cells. Such a close proximity of tumor and stromal cells in the tumor microenvironment might indicate a potential paracrine regulatory function for PSAP in the tumor microenvironment.
We have recently demonstrated that transient and stable down-modulation of PSAP significantly decreases the metastatic PCa cell adhesion to basement membrane proteins, migration, and invasion. However, PSAP overexpression or silencing in several PCa cell lines did not affect cell proliferation or the size or number of colonies in in vitro colonogenic assays. In addition, PSAP overexpression in normal prostate epithelial cells did not affect cell growth or confer any transforming ability or tumorigenic potential (Koochekpour, et al, unpublished data). These observations exclude an oncogenic potential or tumor-suppressive function for PSAP. Based on these data, we believe that PSAP might have intermediate roles during PCa formation and its transition towards metastatic or castrate-resistant state rather than a causative role in early carcinogenic events.
In summary, the results of this study strongly support a role for PSAP in the growth and development of the human prostate gland during early embryogenesis events as well as malignant de-differentiation of prostate epithelial cells. In addition, serum-PSAP levels appear to be age-dependent and to correlate directly with gonadal maturation in normal males. Furthermore, PSAP expression in patients with primary PCa may be under a feedback regulatory loop operated by hormones in HPG-axis. However, elevated levels of serum-PSAP in patients with advanced or mCRPCa might represent as anti-apoptotic and cell-survival response subsequent to therapeutic interventions. To determine the kinetic changes in PSAP expression levels through the natural history of PCa and through hormonal and chemotherapeutic treatments, additional tissue and serum studies using organ-confined, locally advanced, metastatic hormone-naïve and metastatic castrate-resistant cases are needed. From a translational point of view, PSAP has the potential to be used as a prognostic tissue and serum biomarker for discriminating low volume low grade clinically insignificant PCa from more aggressive and higher stage tumors. Other potential applications include using serum levels to monitor the response to hormonal ablation and possibly as a therapeutic target for PCa.
Figure 4.

PSAP calibration curves. Stock solutions of purified rhPSAP, capture antibody, HRP-conjugated detection antibody, and control sera from healthy adult males were used for PSAP sandwich ELISA assay. Individual lines represent 6 independent standard curves. Each data point in the individual calibration curve represents the mean of three determinations.
Acknowledgments
This study was supported by National Institutes of Health/National Center for Research Resources (NIH/NCRR; 2P20 RR021970; to A. Ochoa/S.K), R21CA120625 (to S.K.), R21CA143589 (to S.K.), P20MD004817 (Dennis. B, Estrada. J/S.K.), RO1MD005824 (to S.K.), and LSUHSC and Tulane University Clinical and Translational Research Education and Commercialization Project (CTRECP-070; to S.K.). Additional support was provided by PO1 CA85859 and the Northwest Prostate Cancer SPORE (to R.L. V.) and by PO1 CA98912 and RO1CA122602 (to H.E. Z, L.W.C). We specially thank Dr. Scott E. Delacroix (Department of Urology, LSUHSC-NO) for critical reviewing and helpful comments on the manuscript. We acknowledge the contribution of other members of Dr. Koochekpour’s laboratory (Dr. Sunipa Majumdar, Dr. Mohamed E. Abdraboh, and Dhatayini Subramani), Dr. B. Jill Williams (Department of Urology, Louisiana State University Health Sciences Center, Shreveport, LA), and Drs Guodang Zhu and Shao He (First Affiliated Hospital of Medical School, Xi’an Jiaotong University, Xi’an, China), and Dr. Qi X (Department of Genetics, University of Cincinnati, Ohio). We thank Ms. Jonna Ellis for editorial assistance. The content is solely the responsibility of the authors and does not necessarily represent the official views of the National Institutes of Health or National Cancer Institute.
References
- 1.Wegiel B, Evans S, Hellsten R, Otterbein LE, Bjartell A, Persson JL. Molecular pathways in the progression of hormone-independent and metastatic prostate cancer. Curr Cancer Drug Targets. 2010;10:392–401. doi: 10.2174/156800910791208562. [DOI] [PubMed] [Google Scholar]
- 2.Isaacs JT. The biology of hormone refractory prostate cancer. Why does it develop? Urol Clin North Am. 1999;26:263–273. doi: 10.1016/s0094-0143(05)70066-5. [DOI] [PubMed] [Google Scholar]
- 3.Lin Y, Wang F. FGF signalling in prostate development, tissue homoeostasis and tumorigenesis. Biosci Rep. 2010;30:285–291. doi: 10.1042/BSR20100020. [DOI] [PubMed] [Google Scholar]
- 4.Adorini L, Penna G, Fibbi B, Maggi M. Vitamin D receptor agonists target static, dynamic, and inflammatory components of benign prostatic hyperplasia. Ann N Y Acad Sci. 2010;1193:146–152. doi: 10.1111/j.1749-6632.2009.05299.x. [DOI] [PubMed] [Google Scholar]
- 5.Culig Z, Bartsch G, Hobisch A. Interleukin-6 regulates androgen receptor activity and prostate cancer cell growth. Mol Cell Endocrinol. 2002;197:231–238. doi: 10.1016/s0303-7207(02)00263-0. [DOI] [PubMed] [Google Scholar]
- 6.Culig Z, Hobisch A, Cronauer MV, Raymayr C, Trapman J, Hittmair A, Bartsch G, Klocker H. Androgen receptor activation in prostatic tumor cell lines by insulin-like growth factor-I, keratinocyte growth factor, and epidermal growth factor. Cancer Res. 1994;54:5474–5478. [PubMed] [Google Scholar]
- 7.Mackinnon AC, Yan BC, Joseph LJ, Al-Ahmadie HA. Molecular biology underlying the clinical heterogeneity of prostate cancer: an update. Arch Pathol Lab Med. 2009;133:1033–1040. doi: 10.5858/133.7.1033. [DOI] [PubMed] [Google Scholar]
- 8.Ramirez ML, Keane TE, Evans CP. Managing prostate cancer: the role of hormone therapy. Can J Urol. 2007;1:10–18. [PubMed] [Google Scholar]
- 9.Fitzpatrick JM. Is hormone ablation still the right choice for advanced prostate cancer? BJU Int. 2007;100 (Suppl 2):36–39. doi: 10.1111/j.1464-410X.2007.06952.x. [DOI] [PubMed] [Google Scholar]
- 10.Molina A, Belldegrun A. Novel Therapeutic Strategies for Castration Resistant Prostate Cancer: Inhibition of Persistent Androgen Production and Androgen Receptor Mediated Signaling. J Urol. 2011 Jan 14; doi: 10.1016/j.juro.2010.10.042. [Epub ahead of print] [DOI] [PubMed] [Google Scholar]
- 11.van Leeuwen PJ, Connolly D, Tammela TL, Auvinen A, Kranse R, Roobol MJ, Schroder FH, Gavin A. Balancing the harms and benefits of early detection of prostate cancer. Cancer. 2010;116:4857–4865. doi: 10.1002/cncr.25474. [DOI] [PubMed] [Google Scholar]
- 12.Koochekpour S, Zhuang YJ, Beroukhim R, Hsieh CL, Hofer MD, Zhau HE, Hiraiwa M, Pattan DY, Ware JL, Luftig RB, Sandhoff K, Sawyers CL, Pienta KJ, Rubin MA, Vessella RL, Sellers WR, Sartor O. Amplification and overexpression of prosaposin in prostate cancer. Genes Chromosomes Cancer. 2005;44:351–364. doi: 10.1002/gcc.20249. [DOI] [PubMed] [Google Scholar]
- 13.Schuette CG, Pierstorff B, Huettler S, Sandhoff K. Sphingolipid activator proteins: proteins with complex functions in lipid degradation and skin biogenesis. Glycobiol. 2001;11:81R–90R. doi: 10.1093/glycob/11.6.81r. [DOI] [PubMed] [Google Scholar]
- 14.Kishimoto Y, Hiraiwa M, O’Brien JS. Saposins. Structure, function, distribution and molecular genetics. J Lipid Res. 1992;33:1255–1267. [PubMed] [Google Scholar]
- 15.Koochekpour S. PSAP (Prosaposin (variant Gaucher disease and variant metachromatic leukodystrophy)) Atlas Genet Cytogenet Oncol Haematol. 2006 http://AtlasGeneticsOncology.org/Genes/PSAPID42980ch10q22.html.
- 16.Morales CR, Zhao Q, El-Alfy M, Suzuki K. Targeted disruption of the mouse prosaposin gene affects the development of the prostate gland and other male reproductive organs. J Androl. 2000;21:765–775. [PubMed] [Google Scholar]
- 17.Elleder M, Jerabkova M, Befekadu A, Hřebíček M, Berná L, Ledvinová J, Hůlková H, Rosewich H, Schymik N, Paton BC, Harzer K. Prosaposin deficiency, a rale diagnosed, rapidly progressing, neonatal neuroviscearal lipid storage disease. Report of a further patient. Neuropediatrics. 2005;36:171–180. doi: 10.1055/s-2005-865608. [DOI] [PubMed] [Google Scholar]
- 18.Hulková M, Cervenková M, Ledvinová J, Tochácková M, Hrebícek M, Poupetová H, Befekadu A, Berná L, Paton BC, Harzer K, Böör A, Smíd F, Elleder M. A novel mutation in the coding region of the prosaposin gene leads to a complete deficiency of prosaposin and saposins, and is associated with a complex sphingolipidosis dominated lactosylceramide accumulation. Hum Mol Genet. 2001;9:927–940. doi: 10.1093/hmg/10.9.927. [DOI] [PubMed] [Google Scholar]
- 19.Tylki-Szymańska A, Czartoryska B, Vanier MT, Poorthuis BJ, Groener JA, Ługowska A, Millat G, Vaccaro AM, Jurkiewicz E. Non-neuronopathic Gaucher disease due to saposin C deficiency. Clin Genet. 2007;72:538–542. doi: 10.1111/j.1399-0004.2007.00899.x. [DOI] [PubMed] [Google Scholar]
- 20.Lee TJ, Sartor O, Luftig RB, Koochekpour S. Saposin C promotes survival and prevents apoptosis via PI3K/Akt-dependent pathway in prostate cancer cells. Mol Cancer. 2004;17;3:31. doi: 10.1186/1476-4598-3-31. [DOI] [PMC free article] [PubMed] [Google Scholar]
- 21.Koochekpour S, Sartor O, Hiraiwa M, Lee TJ, Rayford W, Remmel N, Sandhoff K, Minokadeh A, Patten DY. Saposin C stimulates growth and invasion, activates p42/44 and SAPK/JNK signaling pathways of MAPK and upregulates uPA/uPAR expression in prostate cancer and stromal cells. Asian J Androl. 2005;7:147–158. doi: 10.1111/j.1745-7262.2005.00037.x. [DOI] [PubMed] [Google Scholar]
- 22.Koochekpour S, Sartor O, Lee TJ, Zieske A, Patten DY, Hiraiwa M, Sandhoff K, Remmel N, Minokadeh A. Prosaptide TX14A stimulates growth, migration, and invasion and activates the Raf-MEK-ERK-RSK-Elk-1 signaling pathway in prostate cancer cells. Prostate. 2004;61:114–123. doi: 10.1002/pros.20082. [DOI] [PubMed] [Google Scholar]
- 23.Hu S, Delorme N, Liu Z, Liu T, Velasco-Gonzalez C, Garai J, Pullikuth A, Koochekpour S. Prosaposin down-modulation decreases metastatic prostate cancer cell adhesion, migration, and invasion. Mol Cancer. 2010;9:30. doi: 10.1186/1476-4598-9-30. [DOI] [PMC free article] [PubMed] [Google Scholar]
- 24.Qi X, Leonova T, Grabowski GA. Functional human saposins expressed in Escherichia coli. Evidence for binding and activation properties of saposins C with acid beta-glucosidase. J Biol Chem. 1994;269:16746–16753. [PubMed] [Google Scholar]
- 25.Meijer D, van Agthoven T, Bosma PT, Nooter K, Dorssers LC. Functional screen for genes responsible for tamoxifen resistance in human breast cancer cells. Mol Cancer Res. 2006;4:379–386. doi: 10.1158/1541-7786.MCR-05-0156. [DOI] [PubMed] [Google Scholar]
- 26.Meijer D, Jansen MP, Look MP, Ruigrok-Ritstier K, van Staveren IL, Sieuwerts AM, van Agthoven T, Foekens JA, Dorssers LC, Berns EM. TSC22D1 and PSAP predict clinical outcome of tamoxifen treatment in patients with recurrent breast cancer. Breast Cancer Res Treat. 2009;113:253–260. doi: 10.1007/s10549-008-9934-3. [DOI] [PubMed] [Google Scholar]
- 27.Koochekpour S, Lee TJ, Wang R, Culig Z, Delorme N, Caffey S, Marrero L, Aguirre J. Prosaposin upregulates AR and PSA expression and activity in prostate cancer cells (LNCaP) Prostate. 2007;67:178–189. doi: 10.1002/pros.20513. [DOI] [PubMed] [Google Scholar]
- 28.Koochekpour S, Lee TJ, Sun Y, Hu S, Grabowski GA, Liu Z, Garay J. Prosaposin is an AR-target gene and its neurotrophic domain upregulates AR expression and activity in prostate stromal cells. J Cell Biochem. 2008;104:2272–2285. doi: 10.1002/jcb.21786. [DOI] [PubMed] [Google Scholar]
- 29.Koochekpour S, Lee TJ, Wang R, Sun Y, Delorme N, Hiraiwa M, Grabowski GA, Culig Z, Minokadeh A. Prosaposin is a novel androgen-regulated gene in prostate cancer cell line LNCaP. J Cell Biochem. 2007;10:631–641. doi: 10.1002/jcb.21207. [DOI] [PubMed] [Google Scholar]
- 30.Campana WM, O’Brien JS, Hiraiwa M, Patton S. Secretion of prosaposin, a multifunctional protein, by breast cancer cells. Biochim Biophys Acta. 1999;1427:392–400. doi: 10.1016/s0304-4165(99)00036-7. [DOI] [PubMed] [Google Scholar]
- 31.Ding Y, Wang X, Xu A, Xu X, Tian K, Young CY, Yuan H. Associations of saposin C, Src, and androgen receptor upregulate the expression and function of androgen receptor in human prostate cancer cells. J Cell Biochem. 2010 doi: 10.1002/jcb.22977. [DOI] [PubMed] [Google Scholar]
- 32.Ding Y, Yuan HQ, Kong F, Hu XY, Ren K, Cai J, Wang XL, Young CY. Ectopic expression of neurotrophic peptide derived from saposin C increases proliferation and upregulates androgen receptor expression and transcriptional activity in human prostate cancer cells. Asian J Androl. 2007;9:601–609. doi: 10.1111/j.1745-7262.2007.00328.x. [DOI] [PubMed] [Google Scholar]
- 33.Patton S, Carson GS, Hiraiwa M, O’Brien JS, Sano A. Prosaposin, a neurotrophic factor: presence and properties in milk. J Dairy Sci. 1997;80:264–272. doi: 10.3168/jds.S0022-0302(97)75934-4. [DOI] [PubMed] [Google Scholar]
- 34.Kondoh K, Hineno T, Sano A, Kakimoto Y. Isolation and characterization of prosaposin from human milk. Biochem Biophys Res Commun. 1991;181:286–292. doi: 10.1016/s0006-291x(05)81415-9. [DOI] [PubMed] [Google Scholar]
- 35.Guyton AC, Hall JE. The Pituitary Hormones and Their Control by the Hypothalamus. In: Guyton AC, Hall JE, editors. Textbook of Medical Physiology. New York: Saunders; 2000. pp. 846–857. [Google Scholar]
- 36.Sun L, Wang S, Hu C, Zhang X. Regulation of cell proliferation and apoptosis through fibrocystin-prosaposin interaction. Arch Biochem Biophys. 2010;502:130–136. doi: 10.1016/j.abb.2010.08.007. [DOI] [PubMed] [Google Scholar]
- 37.Li N, Sarojini H, An J, Wang E. Prosaposin in the secretome of marrow stroma-derived neural progenitor cells protects neural cells from apoptotic death. J Neurochem. 2010;112:1527–1538. doi: 10.1111/j.1471-4159.2009.06565.x. [DOI] [PubMed] [Google Scholar]
- 38.Clarkson RW, Boland MP, Kritikou EA, Lee JM, Freeman TC, Tiffen PG, Watson CJ. The genes induced by signal transducer and activators of transcription (STAT)3 and STAT5 in mammary epithelial cells define the roles of these STATs in mammary development. Mol Endocrinol. 2006;20:675–685. doi: 10.1210/me.2005-0392. [DOI] [PubMed] [Google Scholar]