Abstract
The potassium chloride co-transporter (KCC) is a member of the electroneutral cation chloride family of cotransporters found in multiple tissues that are involved in transepithelial ion transport and regulation of intracellular ion content and cell volume. We have shown previously that three of the four KCC genes -- KCC1, KCC3, and KCC4 -- are expressed in red blood cells (RBC) (Exp.Hem. 33:624, 2005). Functionally, the KCC mediates volume reduction of reticulocytes that establishes the higher cellular hemoglobin concentration (CHC) of mature RBC. KCC activity is higher in reticulocytes and diminishes with age. KCC activity in RBC containing sickle hemoglobin (SS RBC) is elevated compared to normal (AA RBC) in part due to reticulocytosis in SS blood. However, we have demonstrated that SS reticulocytes have abnormal regulation of KCC activity leading to increased CHC upon activation of KCC compared to AA reticulocytes (Blood 104:2954, 2004; Blood 109:1734, 2007). These findings implicate KCC as a factor in the dehydration of SS RBC, which leads to elevated Hb S concentration and enhances Hb S polymerization and hemolysis. Because KCC activity correlates with cell age, standard flux measurements on blood samples with different numbers of reticulocytes or young non-reticulocytes are not comparable. The Advia automated cell counter measures cell volume (MCV) and cellular hemoglobin concentration (CHC) in reticulocytes, an age-defined population of cells, and thus circumvents the problem of variable reticulocyte counts among SS and AA blood samples. In this study, reticulocyte CHC measurements on fresh blood demonstrated a clear difference between AA and SS cells, reflecting in vivo dehydration of SS reticulocytes, although there was significant inter-individual variation, and the CHC distributions of the two groups overlapped. After KCC activation in vitro by cell swelling using the nystatin method, the initial changes in reticulocyte MCV and CHC with time were used to estimate flux rates mediated by KCC, assuming that changes were associated with isotonic KCl movements. After 20-30 minutes a final steady state MCV/CHC (set point) was achieved and maintained, reflecting inactivation of the transporter. CHC set points were 26.5-29 g/dl in SS reticulocytes compared to 25-26.5 g/dl in AA reticulocytes, reflecting abnormal regulation in SS cells. These results were reproducible in the same individual over time. KCC flux derived from CHC ranged from 5-10.3 mmolK/kgHb/min in SS reticulocytes, compared to 2.9-7.2 mmolK/kgHb/min in AA reticulocytes. Such measures of KCC activity in red cell populations controlled for cell age will facilitate further studies correlating KCC activity with phenotypic or genetic variability in sickle cell disease.
INTRODUCTION
The potassium chloride co-transporter (KCC) is a member of the electroneutral cation chloride family of cotransporters that are found in multiple tissues and are involved in transepithelial ion transport and regulation of intracellular ion content and cell volume. There are four independent KCC genes: KCC1 is ubiquitously expressed, but exhibits relatively low activity. KCC2 is expressed exclusively in neuronal cells and is constitutively active. KCC3 is expressed in multiple tissues including brain, kidney and liver. KCC4 is also expressed widely, with high levels in heart and kidney [1].
Our laboratory has shown that KCC1, KCC3, and KCC4 are all expressed in red blood cells [2]. Functionally, the KCl cotransporter is thought to be involved in RBC maturation, by mediating the volume reduction that establishes the higher cellular hemoglobin concentration (CHC) of mature red cells compared to reticulocytes. KCC activity is high in reticulocytes and diminishes with age [3, 4].
KCC activity is higher in RBC containing sickle hemoglobin (SS RBC) compared to normal (AA) RBC although some of this elevation may be explained by the increased number of reticulocytes in SS blood. However, our laboratory has demonstrated that SS reticulocytes have abnormal regulation of KCC activity leading to increased CHC upon activation of KCC compared to AA reticulocytes [5, 6]. These findings implicate KCC as a factor in the dehydration of SS RBC, which is manifest as an increased number of dense cells with high CHC. Since hemoglobin S polymerization is exquisitely sensitive to HbS concentration [7], KCC dysfunction is linked to sickle cell disease pathophysiology. Accordingly, polymorphisms in KCC genes might affect KCC expression or regulation, thereby contributing to phenotypic variation in SS RBC dehydration and/or sickle cell pathology.
Because activity diminishes with RBC maturation, exploration of KCC regulation and the impact of KCC polymorphisms requires an accurate measure of KCC activity that is controlled for cell age. This is not possible with standard cation flux measurements in blood samples which may contain variable numbers of reticulocytes or young non-reticulocytes.
This study took advantage of the Advia automated cell counter which measures mean corpuscular volume (MCV) and CHC in reticulocyte populations. By tracking changes in MCV and CHC with time, and assuming that the volume changes were associated with isotonic KCl movements, we were able to estimate flux rates mediated by KCC. This approach provides a measure of KCC activity in an age-defined population of cells (reticulocytes) and circumvents the problem of variable reticulocyte counts in SS and AA blood samples. In addition, the methodology permits assessment of the CHC at which KCC is inactivated (the CHC set point), a parameter that relates to the volume regulatory function of the transporter. We propose that these measurements will provide a reliable assessment of the functional activity of KCC, a KCC phenotype, which will permit direct comparisons among SS and AA individuals independent of reticulocytosis and facilitate phenotype-genotype associations.
METHODS
Blood Samples
With informed consent, heparinized blood samples were obtained from volunteers who had not received a blood transfusion within 3 months under a protocol approved by the Institutional Review Board of Cincinnati Children's Hospital Medical Center. Blood samples were centrifuged at 1000g for 5 mins in 15ml tubes to obtain packed red blood cells. Reticulocyte CHC and MCV were determined on a cell by cell basis via the Advia 120 automated cell counter by flow cytometry.
Chemicals and Media
Chemicals were obtained from Sigma/Aldrich and USB, unless otherwise noted. HEPES-buffered saline (HBS) contained 140 mM NaCl (pH 7.4 at 37°C with NaOH), 0.2 mM MgCl2, 0.1mM EGTA (ethyleneglycotetraacetic acid), 20mmM HEPES and 5 mM KCl. Nystatin treatment medium contained 140 mM KCl, 10 mM NaCl, 20 mM HEPES (titrated to a pH of 7.4 at 37o C with NaOH) and 10 mM glucose.
Nystatin Treatment and Cell Volume Reduction Incubation
Red cell samples were washed twice with isotonic HBS. An aliquot of each sample was then reserved on ice as a control. The rest of the sample was treated with nystatin to swell the cells to a CHC of <25 g/dl by incubating the cells for 20 minutes in nystatin treatment medium with 22.5μg/ml of nystatin and 0.02M sucrose. After the incubation, the samples were washed seven times with nystatin treatment medium 1mg/ml of BSA (bovine serum albumin) to remove the nystatin. The samples were then placed in a water bath at 37°C. Aliquots of the nystatin treated cells were taken at specific time points and placed in iced HBS (to stop the activity of the transporter). The CHCM (mean CHC) and MCV of the individual mature red cells and reticulocytes in the treated samples and control sample taken over the time course were then measured via Advia 120 automated cell analyzer.
Advia 120 Measurements
RBC suspensions were maintained on ice until analyzed. Pilot studies indicated that MCV and CHCM values for RBC and reticulocytes were stable up to 24 hours on ice. Standard clinical settings for the Advia 12 Automated Analyzer were used. Distribution histograms for cell volume (CV) and cell hemoglobin (CH) for mature RBC and reticulocytes were obtained, along with mean values (MCV) and (CHCM); subscripts indicate values for reticulocytes (MCVr, CHCMr).
RESULTS
SS RBC and reticulocytes exhibit elevated CHC compared to AA cells
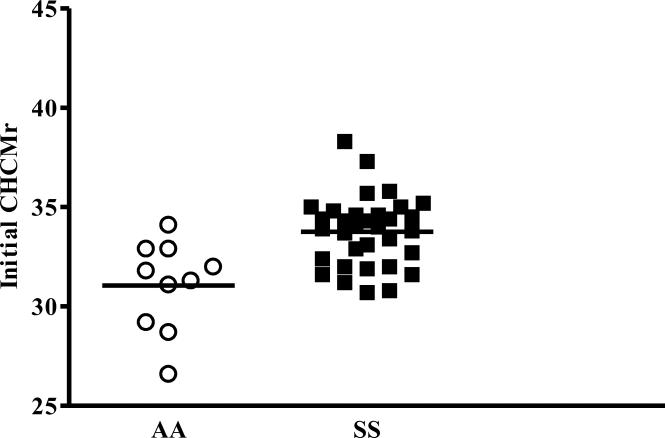
Advia CHCMr values obtained from fresh blood samples from 9 AA and 18 SS subjects, demonstrate a clear population difference between AA and SS reticulocytes and considerable inter-individual variability in CHCMr in vivo.
Time course of reticulocyte cell volume and hemoglobin concentration after cell swelling
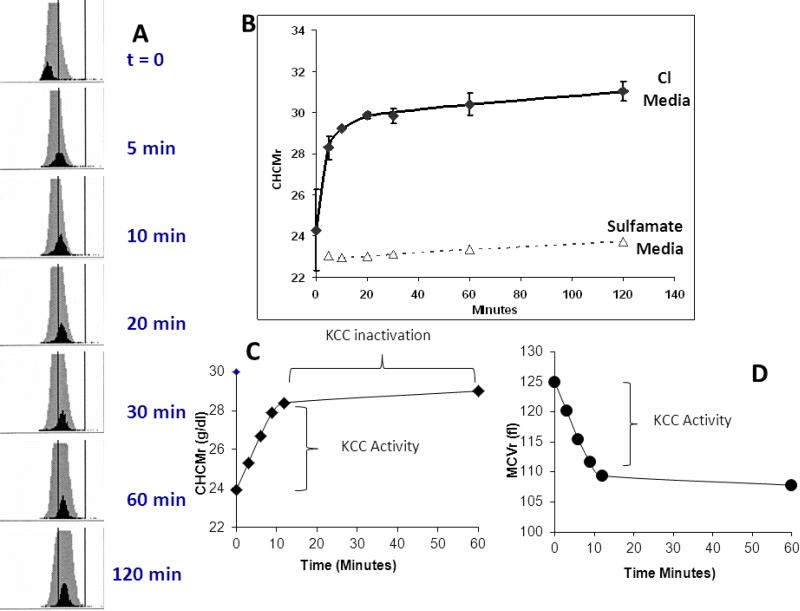
Fig 2A shows Advia CHC histograms for a representative experiment using SS RBC, with mature RBC depicted in grey and reticulocytes in black. Cells were initially swollen with nystatin to give low CHC values and then incubated in isotonic saline and pH 7.4. Note rapid increase in CHCMr, as plotted versus time in Fig. 2B. Stable CHCMr when Cl was replaced with sulfamate indicates the Cl dependence of the process and is consistent with its mediation by KCC. Other studies have shown cellular hemoglobin concentration changes to be inhibited by the KCC inhibitor DIOA [6]. Thus, the initial changes in CHCMr reflect KCC activity as illustrated in Fig. 2C for a single experiment, whereas the final CHCMr achieved reflects the system set point, and is a function of the inactivation of the transporter. Fig. 2D depicts the changes in reticulocyte cell volume in the same experiment, which mirror changes in CHCMr as expected. We favor the use of CHCMr to track the activity of KCC, because there is evidence to suggest that CHCM is in fact the parameter that is ‘sensed’ by the regulatory kinase/phosphatase system [8].
Figure 2.
Changes in CHCM with time after swelling of RBC. See text for details.
CHCMr Set Points after KCC activation
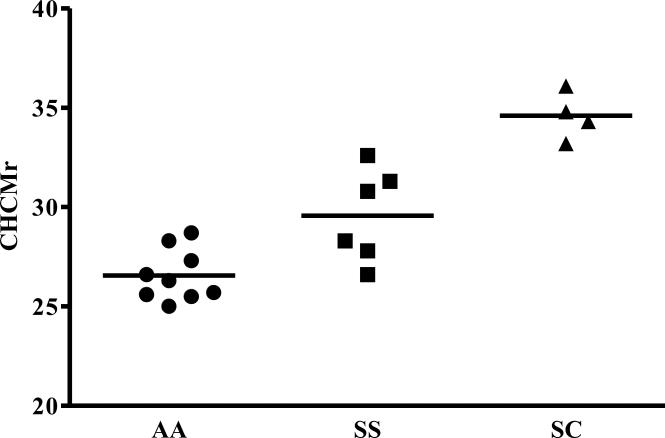
Figure 3 shows CHCMr set points for a series of AA, SS, and SC samples. Although the average SS CHCMr set point is statistically increased over that of AA reticulocytes, there is clearly considerable inter-individual variability in this parameter, with overlap of the distributions. Interestingly, SC reticulocytes have the highest CHCMr set points, reflecting the powerful stimulation of Hb C on KCC and the role of KCC in the pathophysiology of this compound heterozygous state.
Figure 3.
Steady state CHCMr after KCC mediated volume reduction induced by cell swelling
Calculation of KCC fluxes from changes in reticulocyte MCV and CHC requires two assumptions
1. That changes in MCV and CHC are the product of KCC activity, validated by Fig. 2B; 2. That the ion movements associated with changes in MCV and CHCM represent isotonic KCl of approximately 150mM. Although in severely dehydrated cells, the activity coefficient of intracellular hemoglobin may cause hypertonic ion movements [9], the assumption is reasonable in the swollen cells in which these measurements are made.
The change in cell volume over a given time is given by:
| Eq. 1 |
For a given volume change mediated by the movement of isotonic KCl, the amount of K transported per cell is calculated by:
| Eq. 2 |
The flux per cell can be converted to flux per gram Hb using the cellular Hb content (pg Hb/cell) measured by the Advia for each experiment as reticulocyte CH:
| Eq. 3 |
Appropriate unit conversions yield familiar flux units of , Since it can be shown that KCC flux can also be derived from CHCMr
| Eq. 4 |
Thus, KCC fluxes can be calculated from changes in either reticulocyte parameters MCVr or CHCMr using data readily available from Advia 120 analysis of whole blood samples.
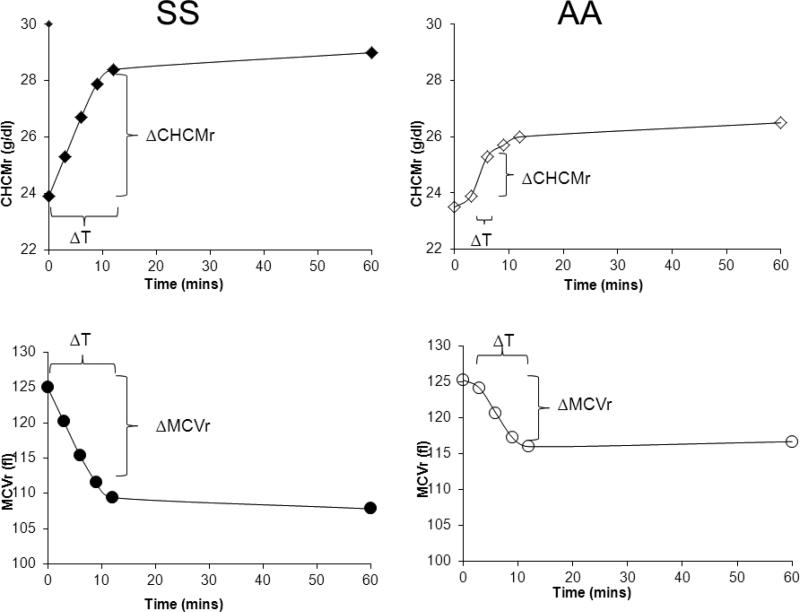
Figure 4 shows representative experiments with SS and AA samples illustrating the changes in CHCM or MCV used to calculate fluxes. Samples were taken at 3, 6, 9, and 12 minutes, stopping the volume regulation process by dilution of suspensions into large volumes of iced media. Generally, initial time points showed the greatest change in MCV or CHCM, and these changes were used to calculate the flux; many SS samples showed constant rates of change over the first three time points. A number of AA and several SS samples exhibited a lag time in activation of the flux, as illustrated in the AA sample in Fig. 4; in these cases, the flux was calculated using the second and third time points. Such a delay in activation of KCC fluxes has been well described in kinetic studies, and reflects the time required for signaling pathways to transduce the volume signal [10, 11].
Figure 4.
Time course of changes in CHCMr and MCVr after cell swelling used to calculate reticulocyte KCC fluxes.
Variation in KCC fluxes among individuals
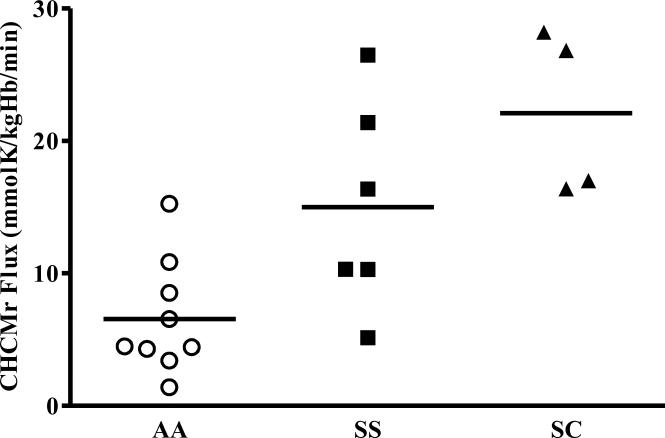
Figure 5 shows reticulocyte swelling-induced KCC fluxes calculated from experiments performed with 7 AA, 5 SS and 4 SC blood samples. Most striking is the 10-fold variation of KCC fluxes among individuals. SS and SC reticulocytes have the highest flux rates, but there is considerable overlap between AA and SS samples, as there was in CHCMr measurements in vivo. Fluxes derived from CHCMr correlated well with those calculated from MCVr in the same individual (R= 0.905, data not shown).
Figure 5.
KCC Fluxes calculated from change in CHCMr
DISCUSSION
The dependence of KCC activity on cell age, coupled with the reticulocytosis associated with sickle cell disease and other disorders, imposes barriers to defining the pathological regulation of the transporter, to assessing the effects of pharmacological inhibitors or other treatments, and to comparing the transport phenotype among individuals. To overcome these impediments we have developed assays of KCC function derived from changes in reticulocyte volume and hemoglobin concentration.
Changes in reticulocyte volume (MCVr) and hemoglobin concentration (CHCMr) upon activation of KCC by cell swelling are analyzed directly by the Advia 120 cell analyzer and can be used to calculate an initial KCC flux rate in the reticulocyte population. Fluxes measured from the two parameters correlated well within a given sample. In addition, the rapid achievement by a new steady state after cell swelling permits the assessment of the CHCMr at which the system is inactivated, reflecting the volume set point of KCC.
Both KCC fluxes and CHCM set points were increased in SS reticulocytes compared to AA reticulocytes, consistent with previous studies showing high flux activity and abnormal regulation of KCC in SS cells [5, 6]. In addition, there was considerable inter-individual variability in these KCC parameters in both SS and AA subjects. Furthermore, although there were some SS subjects with exaggerated KCC function, others fell into the range of normal values, suggesting that KCC activity and regulation in some SS individuals may be more pathological than in others. Such variation may account for some of the phenotypic variability among sickle cell patients, and may in turn reside in genetic variability of the KCC transporters or their regulators.
Additional studies are required to determine the robustness of these measures of KCC function. Repeat same-day measures on the same sample yielded almost identical results (not shown), reflecting a high degree of precision. Studies are underway to determine the reproducibility of the measurements in the same individuals over time, an indication of temporal stability.
In summary, we have shown that changes in reticulocyte CHCM and MCV via Advia 120 technology can be used to calculate KCC-mediated fluxes in an age-defined population of erythrocytes. Conventional flux measurements are encumbered by the dependence of flux activity on cell age and the presence of variable numbers of young cells, especially in pathological blood samples, precluding their utility in comparisons of different individuals or clinical states. The Advia-derived KCC flux measurements described here overcome that obstacle, and will be useful in comparing the effects of KCC on different disease states, assessing the effects of therapeutic interventions, and exploring genotype-phenotype correlations.
Figure 1.
Initial CHCMr was measured on fresh whole blood samples. See text for details.
Footnotes
Publisher's Disclaimer: This is a PDF file of an unedited manuscript that has been accepted for publication. As a service to our customers we are providing this early version of the manuscript. The manuscript will undergo copyediting, typesetting, and review of the resulting proof before it is published in its final citable form. Please note that during the production process errors may be discovered which could affect the content, and all legal disclaimers that apply to the journal pertain.
AUTHOR CONTRIBUTIONS
Maa-Ohui Quarmyne performed experiments, analyzed data and wrote the paper. Mary Risinger performed experiments and edited the paper. Andrew Linkugel and Anna Frazier performed experiments. Clinton Joiner designed the experiments, analyzed data and edited the paper.
DECLARATIONS
Nothing to declare.
References
- 1.Gamba G. Molecular physiology and pathophysiology of electroneutral cationchloride cotransporters. Physiol Rev. 2005;85(2):423–93. doi: 10.1152/physrev.00011.2004. [DOI] [PubMed] [Google Scholar]
- 2.Crable SC, et al. Multiple isoforms of the KC1 cotransporter are expressed in sickle and normal erythroid cells. Exp Hematol. 2005;33(6):624–31. doi: 10.1016/j.exphem.2005.02.006. [DOI] [PubMed] [Google Scholar]
- 3.Canessa M, et al. Volume-stimulated, Cl(-)-dependent K+ efflux is highly expressed in young human red cells containing normal hemoglobin or HbS. J Membr Biol. 1987;97(2):97–105. doi: 10.1007/BF01869416. [DOI] [PubMed] [Google Scholar]
- 4.Bize I, Taher S, Brugnara C. Regulation of K-Cl cotransport during reticulocyte maturation and erythrocyte aging in normal and sickle erythrocytes. Am J Physiol Cell Physiol. 2003;285(1):C31–8. doi: 10.1152/ajpcell.00447.2002. [DOI] [PubMed] [Google Scholar]
- 5.Joiner CH. KCl cotransport mediates abnormal sulfhydryl-dependent volume regulation in sickle reticulocytes. Blood. 2004;104(9):2954–2960. doi: 10.1182/blood-2004-01-0112. [DOI] [PubMed] [Google Scholar]
- 6.Joiner CH, et al. Urea stimulation of KCl cotransport induces abnormal volume reduction in sickle reticulocytes. Blood. 2007;109(4):1728–1735. doi: 10.1182/blood-2006-04-018630. [DOI] [PMC free article] [PubMed] [Google Scholar]
- 7.Eaton WA, Hofrichter J. Sickle cell hemoglobin polymerization. Adv Protein Chem. 1990;40:63–279. doi: 10.1016/s0065-3233(08)60287-9. [DOI] [PubMed] [Google Scholar]
- 8.Colclasure GC, Parker JC. Cytosolic protein concentration is the primary volume signal for swelling-induced [K-Cl] cotransport in dog red cells. J Gen Physiol. 1992;100(1):1–10. doi: 10.1085/jgp.100.1.1. [DOI] [PMC free article] [PubMed] [Google Scholar]
- 9.Freeman CJ, et al. K-permeabilized human red cells lose an alkaline, hypertonic fluid containing excess K over diffusible anions. J Membr Biol. 1987;96(3):235–41. doi: 10.1007/BF01869305. [DOI] [PubMed] [Google Scholar]
- 10.Canessa M, et al. Rate of activation and deactivation of K:Cl cotransport by changes in cell volume in hemoglobin SS, CC and AA red cells. J Membr Biol. 1994;142(3):349–62. doi: 10.1007/BF00233441. [DOI] [PubMed] [Google Scholar]
- 11.Jennings ML. Volume-sensitive K(+)/Cl(-) cotransport in rabbit erythrocytes. Analysis of the rate-limiting activation and inactivation events. J Gen Physiol. 1999;114(6):743–58. doi: 10.1085/jgp.114.6.743. [DOI] [PMC free article] [PubMed] [Google Scholar]


