

Abstract
Niemann–Pick disease type C (NPC) is a lysosomal storage disorder characterized by liver disease and progressive neurodegeneration. Deficiency of either NPC1 or NPC2 leads to the accumulation of cholesterol and glycosphingolipids in late endosomes and early lysosomes. In order to identify pathological mechanisms underlying NPC and uncover potential biomarkers, we characterized liver gene expression changes in an Npc1 mouse model at six ages spanning the pathological progression of the disease. We identified altered gene expression at all ages, including changes in asymptomatic, 1-week-old mice. Biological pathways showing early altered gene expression included: lipid metabolism, cytochrome P450 enzymes involved in arachidonic acid and drug metabolism, inflammation and immune responses, mitogen-activated protein kinase and G-protein signaling, cell cycle regulation, cell adhesion and cytoskeleton remodeling. In contrast, apoptosis and oxidative stress appeared to be late pathological processes. To identify potential biomarkers that could facilitate monitoring of disease progression, we focused on a subset of 103 differentially expressed genes that encode secreted proteins. Further analysis identified two secreted proteins with increased serum levels in NPC1 patients: galectin-3 (LGALS3), a pro-inflammatory molecule, and cathepsin D (CTSD), a lysosomal aspartic protease. Elevated serum levels of both proteins correlated with neurological disease severity and appeared to be specific for NPC1. Expression of Lgals3 and Ctsd was normalized following treatment with 2-hydroxypropyl-β-cyclodextrin, a therapy that reduces pathological findings and significantly increases Npc1−/− survival. Both LGALS3 and CTSD have the potential to aid in diagnosis and serve as biomarkers to monitor efficacy in therapeutic trials.
INTRODUCTION
Niemann–Pick disease type C (NPC) is a lethal, autosomal recessive, neurovisceral disorder characterized by intracellular accumulation of unesterified cholesterol and glycosphingolipids in late endosomal/early lysosomal compartments (1–3). NPC has a wide clinical spectrum with a variable age of onset. The earliest clinical findings are often related to liver disease, usually cholestasis with prolonged neonatal jaundice and hepatosplenomegaly. Although cholestasis resolves in many of the patients, some of them develop chronic liver disease and can die of liver failure (4,5). Neurological features are progressive and include ambulatory impairment, ataxia, dementia, dysarthria, dysphagia, seizures and supranuclear vertical gaze palsy (3). The incidence has been estimated at 1/120 000–150 000 in western Europe (3). NPC can be caused by mutation of either the NPC1 or NPC2 gene. Ninety-five percent of NPC cases are due to mutations in the NPC1 gene (18q11, OMIM #257220), which encodes a large, 142 kDa, transmembrane protein localized in the late endosomal/early lysosomal compartment and which functions in intracellular cholesterol transport and homeostasis (6–8). The remaining NPC cases are due to mutations in the NPC2 gene (14q24.3, OMIM #607625), which encodes a small, 16 kDa, intraluminal protein that binds cholesterol (9,10). Recent work suggests a functional interaction between NPC1 and NPC2 in effluxing unesterified cholesterol from endolysosomes. NPC2 is thought to transfer cholesterol to NPC1, which is then hypothesized to transport cholesterol through the glycocalyx to the limiting membrane of late endosomes/early lysosomes (11–13).
The BALB/cNctr-Npc1m1N/J (Npc1−/−), also referred to as Npcnih, mouse strain carries a spontaneous mutation of Npc1 and lacks functional NPC1 protein. This mouse model replicates many aspects of both hepatic and neurological disease observed in NPC1 patients. Characteristic features include hepatomegaly, unesterified cholesterol accumulation in the liver (with foam cells) and increased plasma alanine aminotransferase (ALT) and aspartate aminotransferase (AST) liver enzymes from 5 to 6 weeks of age (14–17). Initial neurological symptoms appear around 6 weeks of age and consist primarily of progressive tremors and ataxia, reflecting the progressive loss of Purkinje cells in the cerebellum. Death occurs around 12 weeks of age (14,18,19).
Despite intensive work, the precise mechanisms responsible for both brain and liver dysfunction are not fully delineated. Recently, cholesterol oxidation products, known as oxysterols, have been reported to be potentially sensitive and specific biomarkers for NPC1 disease (20,21). Identification of additional biomarkers reflecting multiple aspects of the NPC1 pathological cascade will be of potential value in establishing a diagnosis and investigating candidate therapeutic interventions. We have focused on the liver disease, investigating alterations in gene expression and signaling pathways across the lifespan of the mutant Npc1−/− mice to identify pathophysiological mechanisms contributing to the progression of NPC1 disease.
RESULTS
Identification and validation of differentially expressed genes
Differentially expressed genes (DEGs) in liver tissue from control (Npc1+/+) and mutant (Npc1−/−) female mice were identified using microarray analysis. In order to characterize the temporal progression of gene expression changes, the microarray analysis was performed on cDNA isolated from Npc1+/+ and Npc1−/− mice that were 1, 3, 5, 7, 9 and 11 weeks of age. Principal component analysis (PCA) identified three distinct expression groups: (i) 1-week-old control and mutant mice, (ii) 3- to 11-week-old Npc1−/− mice, and (iii) 3- to 11-week-old control mice (Fig. 1). This delineation of specific groups demonstrates that differential gene expression in Npc1 mutant mice occurs by 3 weeks of age, prior to the onset of overt symptoms.
Figure 1.
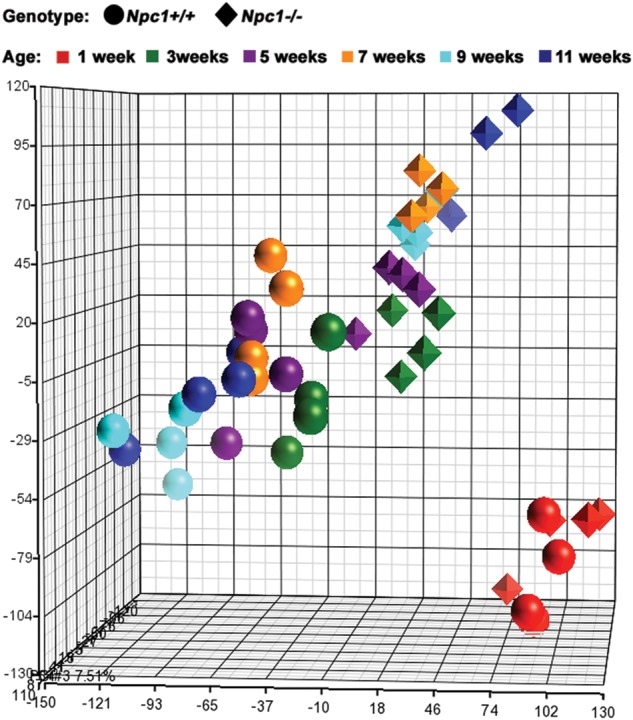
Principal component analysis (PCA). Using PCA, we were able to characterize the expression pattern for both Npc1+/+ and Npc1−/− mice at all six ages (1, 3, 5, 7, 9 and 11 weeks). Control (Npc1+/+) mice figure as circles, mutant (Npc1−/−) as diamonds. Color indicates age: 1-week-old samples in red, 3-week-old in green, 5-week-old in violet, 7-week-old in orange, 9-week-old in light blue and 11-week-old in dark blue. PCA clearly separates control and mutant mice by 3 weeks of age, and in general, age groups progressively diverge from each other.
Criteria used to identify DEGs in Npc1 control and mutant liver tissue at each age included both fold-change (FC ≤ −1.3 or FC ≥ 1.3) and an uncorrected P-value (P ≤ 0.05). In general, the total number of DEGs, including the subset of genes showing increased expression in the mutant tissue, increased with age. For most ages, a higher proportion of DEGs showed increased expression in the mutant tissue (ranging from 49 to 65%, Table 1). The slight decrease in the number of upregulated genes observed in tissue from 11-week-old animals (3145 and 2973 DEGs at 9 and 11 weeks of age, respectively) may be related to the terminal stage of the disease. A subset of 5327 DEGs with altered expression at two or more ages was used for hierarchical clustering analysis (Fig. 2). The majority of these genes (91%; 4850/5327) showed concordant deregulation of expression over the time course, and for many of these genes the FC increased with disease progression (Fig. 2). The hierarchical clustering analysis identified the same three major groups as observed with the PCA (1-week-old mutants and controls, 3- to 11-week-old mutants and 3- to 11-week-old controls; Fig. 2). However, hierarchical clustering showed that 5- to 11-week-old Npc1−/− samples partitioned into distinct clusters by age. In contrast, only a single control group was identified after 5 weeks of age (Fig. 2). This observation likely reflects the progressive pathology in Npc1 tissue. In contrast to the PCA (Fig. 1), hierarchical clustering also distinguished control from mutant tissue at 1 week of age (Fig. 2). This supports the conclusion that pathological changes occur early and significantly prior to the onset of symptoms in Npc1 mutant mice.
Table 1.
Number of DEGs and significantly modified pathways between Npc1−/− and control mice at each age
| Age | Number of genes (P-value ≤ 0.05 and |FC|≥1.3)a | Number of significant pathway maps (FDR step-up value ≤0.05 in GeneGo)b |
|---|---|---|
| 1 week | 1319 (753; 57%) | 9 (59%) |
| 3 weeks | 2618 (1461; 56%) | 10 (69%) |
| 5 weeks | 2487 (1626; 65%) | 71 (90%) |
| 7 weeks | 3507 (2162; 62%) | 117 (87%) |
| 9 weeks | 5783 (3145; 54%) | 157 (77%) |
| 11 weeks | 6035 (2973; 49%) | 119 (59%) |
| Total | 11 290 | 222 |
aNumber and percentage of upregulated genes are given in parentheses.
bPercentage of pathways containing >75% of upregulated genes is given in parentheses.
Figure 2.
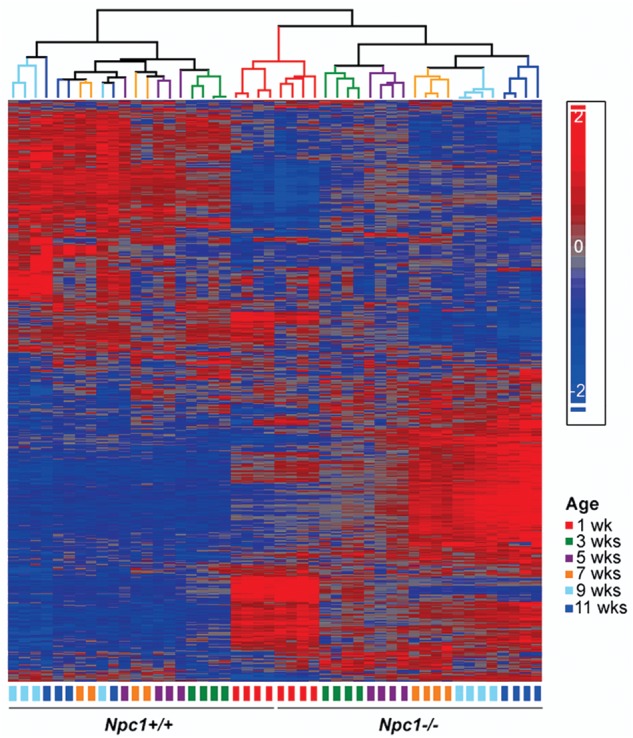
Heat map analysis. The depicted heat map was generated using 5327 genes that demonstrated differential expression (P-value ≤ 0.05 and │FC│≥1.3) for at least two ages, in liver tissue between Npc1+/+ and Npc1−/− mice. Intensity of expression of each gene was standardized between −2 (in blue) and 2 (red). Hierarchical clustering showed that gene expression patterns differed significantly between control and mutant tissue even by 1 week of age. Also, in contrast to control animals where the gene expression pattern appeared to mature and stabilize by 5 weeks of age, gene expression patterns in the mutant animals continued to evolve, separating all the mutant samples by groups of same age.
To validate the expression array analysis, we performed quantitative real-time PCR (qPCR) on 18 genes representing different functional categories (cholesterol transport and metabolism, cell adhesion, extracellular matrix remodeling, developmental signaling, oxidative stress and immune response). We confirmed concordantly altered expression of all 18 genes (Fig. 3). Although it encodes a null allele with respect to protein function, mutant transcripts of Npc1 are present in reduced but detectable amount (22). As expected, expression of Npc1 was decreased ∼2-fold in mutant mice compared with controls. The Hhip (Hedgehog-interacting protein) gene also showed decreased expression in the mutant mice. Sixteen genes, Ctss (cathepsin S), Cyba (cytochrome B245 alpha subunit), Cybb (cytochrome B245 beta subunit), Itgax (integrin alpha x), Itgb2 (integrin beta 2), Mmp12 (matrix metalloproteinase 12), Gpnmb (glycoprotein nmb), Lpl (lipoprotein lipase), Syngr1 (synaptogyrin 1), Hexa (hexosaminidase A), Rragd (Ras-related GTP binding protein D), Lyz2 (lysozyme 2), Cyp51 (cytochrome P450 family 51), Idi1 (idopentenyl-diphosphate delta isomerase), Sqle (squalene epoxidase) and Abcg1 (ATP-binding cassette subfamily G member 1) showed increased expression in Npc1 mutant mice compared with control littermates. When comparing all time points for all 18 genes, the expression array and qPCR data differed only for 4 out of 108 (3.7%) samples (7-week time point for the Cyp51 gene, 1-week time point for the Hexa gene, 9-week time point for the Hhip gene and 9-week time point for the Idi1 gene). For these four data points, one of the two methods, either expression array or real-time PCR, did not identify a significant change in gene expression between control and mutant mice.
Figure 3.

Validation of expression array results. In order to validate the results obtained by array analysis, we used qPCR to determine the expression pattern of 18 genes in different functional categories at all six time points. Both the qPCR (left) and expression array (right) are shown for Npc1+/+ (white columns) and Npc1−/− (black columns). The mean and the standard error are shown for each group (n = 4). (A–E) Genes involved in cholesterol homeostasis. (F and G) Genes involved in lipid homeostasis. (H–J) Genes involved in cell adhesion and extracellular matrix remodeling. (K–M) Genes involved in immune response and inflammation. (N and O) Genes involved in developmental signaling. (P and Q) Genes involved in oxidative stress. (R) Gene involved in synaptic plasticity. To account for unequal variances in small-sample-size groups, an ANOVA test with a Games–Howell post hoc correction was performed to determine the significance of the difference in means between control and mutant mice at each age: *P-value ≤ 0.05; **P-value ≤ 0.001.
In order to further validate our expression array data, we analyzed the expression of genes previously reported to have altered expression in NPC1 disease. As expected, Npc2 and Plin3 genes (perilipin 3 or mannose-6-phosphate receptor-binding protein 1, M6prbp1) were upregulated in mutant tissue in our microarray study, with an FC of 1.3 to 1.75 for Npc2, and 1.6-fold to 2.1 for Plin3 (23–25). We also compared our results with the DEG lists from four previous microarray studies conducted analyzing either human NPC1 fibroblasts or Npc1 mouse cerebella and liver tissue (Supplementary Material, Table S1) (25–28). In order to compare our gene lists with the microarray data on human cells, we converted the human gene symbols into their mouse homologs, using the Ensembl Biomart tool. About 65% of the human genes had an identified murine homolog. Forty percent of the DEGs published in the two studies using human fibroblasts (393 out of 1010, and 18 out of 45) were also identified in this study, and about half of these genes had a deregulation of expression in the same direction (222 out of 393, and 8 out of 18). Half of the genes with an altered expression in the mouse 3-week-old cerebella study (75 out of 154) were also deregulated in our liver data, with the majority (56 out of 75, 75%) being altered in the same direction. The most recent study examined gene expression in 7-week-old cerebellum and liver from the Npc1 mouse model (28). About 30% of the DEGs published in this study were common with our gene list (410 out of 1325 for the cerebellum study, and 137 out of 473 for the liver study). The majority of genes with altered expression in the 7-week-old livers (103 out of 137, 75%) showed a deregulation of expression in the same direction as we observed in this current study. Considering the extensive biological and technical differences (species, cell/tissue types, diet, RNA extraction, labeling and array platforms) that were used in the different studies, overall comparison of the DEG lists from these four studies with our data generally showed a reasonable concordance.
Pathway analysis
To gain insight into pathological processes, the DEG data were used to identify pathways with significantly altered gene expression. MetaCore from GeneGo, Inc., was used to identify pathway maps containing genes with a modified expression (Supplementary Material, Table S2). These pathways were considered significantly altered when the false-discovery rate (FDR) P-value was <0.05. Typically, this was found only if five or more genes in the pathway demonstrated altered expression. Significantly altered pathways were identified as early as 1 week of age, and the number of significantly altered pathways increased with age (Table 1). Early on in the disease process, a limited number of pathways showed significant alterations, with nine and ten pathways identified at 1 and 3 weeks, respectively. In comparison, from 5 to 11 weeks, the number of identified pathways ranged from 71 to 157 (Table 1, Supplementary Material, Table S2, Fig. 4).
Figure 4.
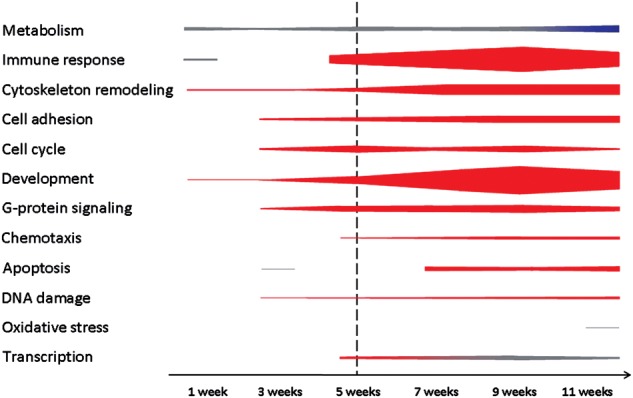
GeneGo pathway map analysis. Schematic representation of categories of functional pathway maps showing significant differential gene expression when comparing Npc1+/+ and Npc1−/− liver tissue at indicated ages. Thickness of bars increases with the number of significant pathways identified (FDR step-up value ≤0.05). Red and blue colors indicate pathways with most (≥75%) genes being upregulated or downregulated, respectively. Gray indicates mixed DEGs. The vertical dashed line is provided as a reference to the onset of overt symptoms. The list of functional gene pathways that comprise this figure is provided in Supplementary Material, Table S2.
Only a single pathway, the role of IL-8 in angiogenesis, was identified as significantly deregulated at all ages. There is no IL-8 homolog in the mouse; however, the mouse does have two homologous ‘IL-8’ receptors, Cxcr1/Il8ra and Cxcr2/Il8rb. Altered expression of 37 genes (24 with increased and 13 with decreased expression; Supplementary Material, Table S3) contributed to the identification of this pathway. However, further evaluation of these data does not support a conclusion that an alteration of signaling through Cxcr1/Cxcr2 receptors contributes to the pathology in NPC1. First, this pathway includes genes involved in the regulation of cholesterol homeostasis (Srebf1, Srebf2 and Hmcgr) which are expected to be altered due to impaired intracellular cholesterol transport in NPC1. Second, we did not observe altered expression of genes specifically related to Cxcr1/Cxcr2 signaling, with the exception of Cxcr1 itself whose expression was only upregulated in the terminal 11-week-old tissue (FC 1.5).
Pathological processes occurring earlier in disease progression are more likely to be directly related to the primary genetic defect, and thus are potential targets for therapeutic intervention. Nine functional pathways demonstrated altered gene expression at 1 week of age. Five of these nine pathways were involved in metabolic processes, including three associated with cholesterol synthesis and regulation of lipid metabolism. Consistent with the known dysregulation of cholesterol synthesis in NPC1 cells (16,29–31), among the 88 genes encoding enzymes participating in cholesterol biosynthesis, 16 out of 17 DEGs showed increased expression by 1 week of age (Hmgcs1, Hmgcr, Mvk, Pmvk, Mvd, Idi1, Fdps, Fdft1, Sqle, Lss, Cyp51, Tm7sf2 or Dhcr14, Sc4mol, Nsdhl, Sc5d and Dhcr7; Supplementary Material, Table S3). Only Acat1, which is not directly involved in sterol synthesis, showed decreased expression. Significant alterations, again consistent with prior data, were found in the regulation of lipid metabolism by liver X receptor, nuclear transcription factor Y and sterol regulatory element-binding protein (SREBP) (Srebp2, Cyp51, Fasn, upregulated; Srebp1 and Nfyb, downregulated) (31,32), and by peroxisome proliferator-activated receptor (Acsl4, Fabp3, Cpt1b upregulated; Acaa1b, Ehhadh, Acadm, Slc25a20, Hadhb downregulated) (Supplementary Material, Table S3) (27). Other metabolic pathways with altered expression at 1 week of age include butanoate metabolism (Acacb, Acss1, Hmgcs1, upregulated; Acadm, Acat1, Hadhb, Dbt, Bdh1, Ehhadh, downregulated; Supplementary Material, Table S3) and linoleic acid metabolism (Fads1, upregulated; Cyp2c37, Cyp2c38, Cyp2c39, Cyp2c40, Cyp2c44, Cyp2c50, Cyp2c54, Cyp2c70, Cyp2e1, Cyp2j5, Cyp2j9, downregulated; Supplementary Material, Table S3). This last pathway is of particular interest since it was identified due to decreased expression of cytochrome P450 genes encoding enzymes involved in the metabolism of endogenous metabolites, xenobiotics and drugs (33). The zinc finger protein 202 (ZNF202) pathway was identified as having significantly altered expression at 3 weeks and all subsequent time points (seven genes upregulated, seven downregulated; Supplementary Material, Tables S2 and S3). Differential expression of ZNF202 itself was not observed. ZNF202 is a transcriptional repressor of genes involved in cholesterol and HDL metabolism (33). Thus, the identification of this pathway was likely secondary to altered cholesterol homeostasis.
Two pathways associated with immune response and inflammation were identified when the 1-week data were analyzed. These were the alternative complement (C2 and Clu, upregulated; Itgam, Cfh, C8a, C8g, downregulated) and the interleukin-1 (IL-1) signaling pathways (Jun, Map3k1, Rps27a, upregulated; Il1b, Il1rap, Serpine1, downregulated). Although these two pathways were identified in liver tissue from 1-week-old animals, dysregulation of immune and inflammatory pathways in general was a late finding (Fig. 4). Specifically, between 11 and 37 immune/inflammatory pathways showed dysregulation in the 5- to 11-week tissue, with a majority of upregulated genes (462 out of 677, 68%) in the mutant tissue. Tnfα (tumor necrosis factor alpha), which was previously reported as upregulated in NPC1, did not show a differential expression in this study (15,34). However, the genes encoding Tnfα receptors, Tnfrsf1α (Tnf receptor superfamily member 1 alpha) and Tnfsr1β (Tnf receptor superfamily member 1 beta), were upregulated at 5 weeks of age, and between 7 and 11 weeks of age, respectively. Increased expression of genes corresponding to five chemotaxis pathways was observed starting at 5 weeks of age (due to the relatively large number of DEGs; please see Supplementary Material, Table S3). These included leukocyte chemotaxis (34 upregulated, 12 downregulated genes), CCR4-induced leukocyte adhesion (18 upregulated, 4 downregulated genes), inhibitory action of lipoxins on IL-8- and leukotriene B4-induced neutrophil migration (45 upregulated, 5 downregulated genes), lipoxin inhibitory action on fMLP-induced neutrophil chemotaxis (29 upregulated, 6 downregulated genes) and CXCR4 signaling pathway (14 upregulated, 3 downregulated genes). Identification of these pathways likely reflects an ongoing inflammatory process in the liver tissue.
The pathway analysis suggested altered expression of genes involved in cell cycle regulation (15 pathways) starting at 3 weeks of age. This included increased expression of cyclins (Ccna2, Ccnb1, Ccnb2, Ccnd1, Ccnd2, Ccne1) and cyclin-dependent kinases (Cdk1, Cdk4, Cdk6). In addition, genes indicative of an alteration in ATM/ATR regulation of both G1/S and G2/S checkpoints showed similar altered expression starting at 3 weeks of age (Supplementary Material, Tables S2 and S3). These data suggest increased cell proliferation in the Npc1 liver.
A significant number of pathways associated with developmental signaling showed altered gene expression starting at 5 weeks of age. These included ubiquitously expressed, intracellular components of mitogen-activated protein kinase (MAPK) signaling, as well as non-canonical transforming growth factor beta (Tgfβ) signaling pathways linked to epithelial-to-mesenchymal transition (EMT), with the upregulation of the genes encoding the ligand Tgfb and its receptors Tgfbr1 and Tgfbr2. Our data also suggested that there was an early disturbance of small GTPase function in NPC1. By 3 weeks of age, disturbances were present in the Ras family small GTP-binding protein H-Ras (Hras) (10 upregulated, 5 downregulated genes), Ras-related C3 botulinum toxin substrate 1 (Rac1) (16 upregulated, 2 downregulated genes) and the related Ras viral oncogene homolog (Rras) pathway (7 upregulated, 5 downregulated genes) (Supplementary Material, Table S3). This dysregulation of G-protein signaling pathways was progressive, with 11 additional pathways identified, including alterations of Ras homolog gene family member A (RhoA) (17 upregulated, 8 downregulated genes) and cell division cycle 42 (Cdc42) (13 upregulated, 4 downregulated genes) (Supplementary Material, Table S3).
Altered expression of genes associated with an endoplasmic reticulum stress response was first observed at 3 weeks of age (17 upregulated, 15 downregulated genes) (Supplementary Material, Table S3). ER stress can be associated with oxidative stress and apoptosis, two pathological processes that have been postulated to play a significant role in the NPC1 pathological cascade (15,25,35–37). However, gene expression differences associated with apoptosis and oxidative stress were a relatively late finding. Significant expression changes related to apoptosis and oxidative stress were identified only after 7 and 11 weeks, respectively. This observation suggests that therapeutic interventions targeting oxidative stress or apoptosis may be of limited efficacy with respect to treatment of hepatic disease.
Genes with differential expression at all evaluated ages
In addition to the pathway analysis to identify genes that are likely involved in NPC1 pathology, we also identified a subset of 150 genes that were differentially expressed at all six ages (Supplementary Material, Table S4). Thirteen (8.7%) of these 150 DEGs are involved in cholesterol or lipid homeostasis. As discussed above, the dysregulation of cholesterol homeostatic genes is expected. Two transcription factors, Jun and Spi-c, demonstrated consistent increased expression. Jun is one of the transcription factors activated by MAPK signaling, and has a broad spectrum of target genes, regulating cell proliferation or apoptosis, as well as immune and stress responses (38). Increased expression of Jun in Npc1−/− mice may be related to early inflammatory events, potentially via the deregulation of IL-1 signaling, which is a known regulator of MAPK pathway (39). Conversely, Spi-c, a PU.1-related transcription factor, is a highly specific transcription factor, only expressed in B-cells and splenic red pulp macrophages (RPM). It was suggested to be involved in red pulp macrophage differentiation required for red blood cell recycling and iron homeostasis (40), and may contribute to B-cell differentiation (41). Its unexpected expression in Npc1−/− liver might indicate ectopic presence of RPM in liver tissue, or alternatively reflect an abnormally high expression of this transcription factor in Npc1 mutant Kupffer cells or hepatic immune cells.
Interestingly, increased expression of aldolase A (Aldoa) transcript was observed in Npc1 mutant liver tissue (Supplementary Material, Table S3). Aldolases encode enzymes involved in glycolysis and gluconeogenesis, and are differentially expressed during development. Aldoa expression is high in fetal liver and decreases rapidly after birth, whereas expression of aldolase B (Aldob) increases after birth (42,43). In Npc1 mutant liver tissue, Aldoa expression did not decrease and Aldob expression did not increase as expected. Altered expression of aldolase isoenzymes in Npc1−/− mice could reflect an abnormal maturation of the liver, and might contribute to the neonatal liver disease observed in NPC1 patients.
Nine cytochrome P450 genes showed consistently decreased expression at all ages. The expression of this family of enzymes is mostly induced after birth, during the acquisition of the drug-metabolizing function of the liver (44,45). In addition to the CYP genes, expression of the hematopoietic prostaglandin D synthase gene (Hpgds), which encodes the key enzyme in the synthesis of prostaglandins (46), was also consistently increased. Arachidonic acid and prostaglandin E2 syntheses have recently been shown to be increased in NPC1 cells (47). In addition to delayed hepatic development, the early downregulation of expression of numerous cytochromes of the Cyp2c subfamily, and the upregulation of expression of a few enzymes in the prostaglandin synthesis cascade, could be involved in the increased inflammation observed in NPC1 disease (48–50). Cytochrome P450 downregulation is also a significant pharmacogenetic finding, since impaired P450 activity may result in altered drug metabolism by NPC1 patients.
Identification of serum biomarkers
Because of the clinical heterogeneity of NPC1 patients and lack of defined clinical outcome measures, quantitative biomarkers would be a useful tool in the development of therapeutic interventions. To identify potential serum-based biomarkers, we cross-referenced our list of DEGs with human or mouse proteins either present in the Secreted Protein database (http://spd.cbi.pku.edu.cn/, July 06 release, last accessed on May 23, 2012) (51) or categorized as a secreted protein in the UniProt database (http://www.uniprot.org/, last accessed on May 23, 2012). We identified 961 DEGs that met these criteria. When the analysis was restricted to genes that were differentially expressed at ≥4 time points, 103 genes remained (Supplementary Material, Table S5). Literature review was used to confirm that all of these genes correspond to secreted proteins. Since we were interested in identifying biomarkers that could be correlated with disease progression, we further selected genes showing a progressive dysregulation with age. As a proof-of-principle, we chose to evaluate serum protein expression of three candidate biomarkers: lectin galactoside-binding-soluble 3 protein (galectin-3, LGALS3), plasminogen activator urokinase-type (PLAU) and cathepsin D (CTSD). PLAU and CTSD had been associated with Alzheimer disease (52–56), and secreted LGALS3 acts as a chemoattractant, and could potentially be involved in liver fibrosis (57–59).
We measured serum concentrations of PLAU, CTSD and LGALS3 in control and NPC1 subjects by ELISA. For an initial pilot study, we compared serum from six age-matched controls and NPC1 patients. We observed markedly different levels between controls and patients for LGALS3 and CTSD, but not for PLAU (Supplementary Material, Fig. S1B). Thus, we proceeded to quantify LGALS3 and CTSD protein levels in serum from 30 individual NPC1 and 16 age-appropriate control subjects. Serum levels of both LGALS3 and CTSD were found to be significantly increased in NPC1 patients compared with age-appropriate controls (Figs 5B and 6B). Mean serum LGALS3 levels were 6.0 ± 2.9 ng/ml (range: 2.2–12.7) and 20.3 ± 23.0 ng/ml (range: 3.8–128.8) for controls and NPC1 patients, respectively (P-value ≤ 0.005). Mean serum CTSD levels were 19.9 ± 7.8 ng/ml (range: 5.6–35.1) and 106.7 ± 65.7 ng/ml (range: 15.3–314) for controls and NPC1 patients, respectively (P-value ≤ 0.0001). Given the very large range observed for both LGALS3 and CTSD, we performed Grubb's test to identify outliers. The patient with the highest CTSD value and the two patients with the highest LGALS3 values were identified as outliers with 95% confidence, and were therefore not included in subsequent analyses. LGALS3 and CTSD concentrations were correlated (r = 0.387, P-value ≤ 0.05) with each other (Supplementary Material, Fig. S3).
Figure 5.

LGALS3 as a potential biomarker in NPC1. (A) The microarray analysis showed that expression of Lgals3 was significantly increased in liver tissue from Npc1−/− (black columns) compared with Npc1+/+ (white columns), and that this dysregulated expression was progressive (mean and standard deviation, n = 4; *P-value ≤ 0.05; **P-value ≤ 0.0001). (B) The serum concentration of LGALS3 was increased in NPC1 subjects (n = 30) compared with age-appropriate controls (n = 16). In order to get an idea of potential specificity, we measured serum concentration of LGAL3 in subjects with four other lysosomal storage disorders (INCL, n = 3; GD, n = 5; GM-1 gangliosidosis, n = 9; and GM-2 gangliosidosis, n = 1). Mean and standard deviation are shown for each group. The dashed horizontal represents the 90% sensitivity cut-off (9.7 ng/ml) as determined by ROC analysis. (C) ROC analysis for LGALS3 (area under curve: 0.95; cut-off value of 13.1 ng/ml: specificity of 100%, sensitivity of 57%; cut-off value of 9.7 ng/ml: sensitivity increased to 90%, specificity of 94%). (D and E) LGALS3 levels did not correlate with serum levels of either 7-ketocholesterol (D) or 3β,5α,6β-cholestane-triol (E). (F) Correlation of LGALS3 with serum transaminase levels. (G) Serum LGALS3 levels showed a significant positive correlation (r = 0.47, P-value < 0.005) with increasing disease severity (severity rank from least to most severe cases, 1–39). (H) Effect of miglustat and HP-β-CD treatment on Lgals3 expression in the liver of Npc1 mice. Mice were chronically treated with either miglustat, HP-β-CD or a combination of both drugs from 1-week-old to their sacrifice at 9 weeks of age (see Materials and Methods for details). The mean and the standard deviation are shown for each group; n = 4 for all groups, except the two indicated with ‘#’ (n = 2). *P-value ≤ 0.05; **P-value ≤ 0.005; ***P-value ≤ 0.0001 (unpaired t-test).
Figure 6.

CTSD as a potential biomarker in NPC1. (A) The microarray analysis showed that expression of Ctsd was significantly increased in liver tissue from Npc1−/− (black columns) compared with Npc1+/+ (white columns), and that this dysregulated expression was progressive (mean and standard deviation, n = 4; *P-value ≤ 0.05; **P-value ≤ 0.0001). (B) The serum concentration of CTSD was increased in NPC1 subjects (n = 30) compared with age-appropriate controls (n = 16). In order to get an idea of potential specificity, we measured serum concentration of CTSD in subjects with four other lysosomal storage disorders (INCL, n = 3; GD, n = 5; GM-1 gangliosidosis, n = 9; and GM-2 gangliosidosis, n = 1). The mean and the standard deviation are shown for each group. The dashed horizontal line represents the 90% sensitivity cut-off (36.5 ng/ml) as determined by ROC analysis. (C) ROC analysis for CTSD (area under curve: 0.95; cut-off value of 36.5 ng/ml: specificity of 100%, sensitivity of 90%). (D and E) Correlation of CTSD with serum levels of either 7-ketocholesterol (D) or 3β,5α,6β-cholestane-triol (E). (F) Correlation of CTSD with serum transaminase levels. (G) Serum CTSD levels showed a significant positive correlation (r = 0.44, P-value < 0.007) with increasing disease severity (severity rank from least to most severe cases, 1–39). (H) Effect of miglustat and HP-β-CD treatment on Ctsd expression in the liver of Npc1 mice. Mice were chronically treated with either miglustat, HP-β-CD or a combination of both drugs from 1-week-old to their sacrifice at 9 weeks of age (see Materials and Methods for details). The mean and the standard deviation are shown for each group; n = 4 for all groups, except the two indicated with ‘#’ (n = 2). *P-value ≤ 0.05; ***P-value ≤ 0.0001 (unpaired t-test).
To evaluate the specificity of elevated serum levels of LGALS3 and CTSD for NPC1, we determined their concentrations in sera of patients with other lysosomal storage diseases (infantile neuronal ceroid lipofuscinosis or INCL, Gaucher disease or GD, GM1 gangliosidosis or GM2 gangliosidosis) (Figs 5B and 6B). Three patients, one affected with GD and two with GM1, had elevated levels of LGALS3, and intermediate levels of CTSD. Mean concentrations of LGALS3 and CTSD of patients affected with LSDs were elevated compared with the mean concentration of the control group, but lower than NPC1 patients' mean levels.
To assess the ability of LGALS3 and CTSD serum concentrations to discriminate NPC1 patients from controls, we performed receiver operating characteristic (ROC) analysis. The area under the curve was 0.95 for both LGALS3 and CTSD (Figs 5C and 6C). For LGALS3, a cut-off value of 13.1 ng/ml would yield a specificity of 100% but a sensitivity of only 57%. By decreasing the cut-off value to 9.7 ng/ml, sensitivity is increased to 90%, but specificity decreases to 94% (Fig. 5C). For CTSD, a cut-off value of 36.5 ng/ml yields a sensitivity of 90% and a specificity of 100% (Fig. 6C).
We also evaluated whether the serum elevations of LGALS3 and CTSD could be secondary to liver disease in NPC1 patients. Liver function tests frequently show mild abnormalities in NPC1 patients; thus, we determined whether LGALS3 and CTSD serum levels correlated with serum measures of liver disease. A weak correlation was observed between AST levels and both LGALS3 (r = 0.37, P-value ≤ 0.05) and CTSD (r = 0.40, P-value ≤ 0.05) serum levels, but not between ALT and LGALS3 or CTSD concentrations (Figs 5F and 6F). Total bilirubin levels were also weakly correlated to CTSD serum concentrations (r = 0.39, P-value ≤ 0.05), but not to LGALS3 concentrations (r = −0.02, P-value = 0.92) (Supplementary Material, Fig. S4A and B).
Given the phenotypic heterogeneity observed in NPC1, we were interested in determining whether serum CTSD and LGALS3 concentrations correlated with NPC1 disease status. Neurodegeneration is particularly severe in most NPC patients, and it was evaluated using a severity scale (60). A significant correlation was found between LGALS3 (r = 0.47, P-value ≤ 0.005) and CTSD (r = 0.44, P-value ≤ 0.007) serum levels and increased neurological disease severity (Figs 5G and 6G).
Recently, plasma levels of the cholesterol oxidation products 7-ketocholesterol and 3β,5α,6β-cholestane-triol were shown to be specifically elevated in NPC1 patients (20,21). To determine whether CTSD and LGALS3 provided independent information with respect to NPC1 pathology, we correlated serum LGALS3 and CTSD levels with concordant plasma 7-ketocholesterol and 3β,5α,6β-cholestane-triol levels. LGALS3 did not significantly correlate with either oxysterol (Fig. 5D and E). CTSD levels were slightly correlated with 7-ketocholesterol concentrations (r = 0.382, P-value ≤ 0.05), but not with 3β,5α,6β-cholestane-triol (Fig. 6D and E).
Miglustat is an iminosugar that inhibits the synthesis of glycosphingolipids and has been shown to have some efficacy in NPC1 patients in both case reports and a randomized clinical trial (61–64). Currently, miglustat has not been approved by the FDA for the treatment of NPC1 patients, but is used off-label by a significant number of NPC1 subjects, including over half (60%) of the NPC1 subjects included in this study. We investigated whether miglustat therapy had any effect on LGALS3 or CTSD concentrations. No significant differences in serum levels of either LGALS3 or CTSD were observed when comparing miglustat-treated or -untreated patients (Supplementary Material, Fig. S2A–C). Since individual responses could be masked by the large degree of interpatient variation, we compared serum LGALS3 and CTSD concentrations in six NPC1 patients for whom we had serial serum samples prior to and after initiation of off-label miglustat use. Miglustat therapy did not have a significant effect on serum levels of either LGALS3 or CTSD (Supplementary Material, Fig. S2B–D).
The patient data set evaluating miglustat therapy is limited; hence, we evaluated the potential usefulness of LGALS3 and CTSD to monitor therapeutic interventions in the Npc1 mouse model. In this experiment, we compared mice treated with miglustat, 2-hydroxypropyl-β-cyclodextrin (HP-β-CD) or a combination of both of these drugs with untreated mice. HP-β-CD is a heptameric cyclic sugar that has previously been shown to significantly decrease neuropathology and prolong lifespan in both mouse and cat models of NPC1 (29–31,65–68). By RT-PCR analysis, consistent with the microarray data, expression of both galectin-3 and CTSD was increased in liver tissue from 9-week-old untreated Npc1−/− mice compared with control littermates (Figs 5H and 6H). Miglustat treatment had a modest effect on the level of expression of both genes in Npc1−/− mice (P-value ≤ 0.05 and 0.005 for Ctsd and Lgals3, respectively). In contrast, the treatment of Npc1 mutant mice with HP-β-CD significantly corrected Lgals3 and Ctsd expressions (P-value ≤ 0.0001), restoring a level of expression similar to that observed in controls (Figs 5H and 6H).
DISCUSSION
NPC1 disease is a lethal neurodegenerative disorder that also includes hepatic manifestations. In order to gain insight into novel pathological processes and the relative timing of pathological processes and to identify potential biomarkers, we characterized liver gene expression changes in the Npc1 mouse model during disease progression. Array results were validated using qPCR. To our knowledge, this is the only microarray expression study which focused on liver tissue and evaluated a time course over the lifespan of Npc1−/− mice.
In comparison with age-matched control mice, we identified DEGs as early as 1 week of age, and hierarchical clustering could distinguish control and mutant liver expression patterns by 1 week of age. Since DEGs identified at pre-symptomatic time points are more likely to be proximally related to the initial pathological disturbances in NPC1 disease rather than general secondary effects, we focused our initial analysis on these changes. Early modifications identified by functional pathways analysis included the deregulation of metabolic pathways, especially related to cholesterol and lipid metabolism, as well as pathways involved in immune response and inflammation, particularly IL-1 signaling and the complement pathways, and cell cycle regulation. An increased number of pathways, specifically immune response- and inflammation-related pathways and development signaling pathways, become dysregulated after 5 weeks of age when the animals start to demonstrate overt symptoms. TGFβ signaling, one of the main regulators of EMT during fibrosis, was upregulated in Npc1−/− mice, starting at 5 weeks of age (69,70). Hepatic fibrosis, although not commonly a critical clinical issue, can occur in NPC1 patients (4), and has been reported in 8-week-old Npc1−/− mice fed with both regular (28) or high-fat diet (19), in an antisense-induced Npc1 model (71) and in the feline model (72). Alteration in TGFβ signaling might then be related to the liver injury observed in NPC1 disease, and to the numerous modifications in cell adhesion and cytoskeleton remodeling pathways we identified in Npc1−/− mice.
Identification of biological pathways with altered expression can potentially guide the selection of potential therapeutic interventions. Both increased apoptosis (35,37,71) and oxidative stress (25,36) have been reported in NPC1 disease. The treatment of Npc1 mutant mice with imatinib, an inhibitor of c-Abl kinase and p73 proapoptotic pathway, has been reported to be beneficial (73). However, our data suggest that expression of genes related to apoptosis primarily occurs at 7 weeks and later, which suggests that the inhibition of apoptosis may be of limited efficacy. This is supported by the finding that imatinib has limited impact on the lifespan of Npc1−/− mice: lifespan of Npc1 mutant mice increased by only 12% when imatinib therapy was initiated at 1 week of age, and did not have a significant effect on lifespan when treatment was initiated at 4 weeks of age (73). These data also suggest that gene expression changes related to increased oxidative stress are primarily found late in the disease process. This is consistent with our prior work that showed increased levels of plasma oxysterols in the Npc1 mutant mice primarily after 8 weeks of age (20), and consistent with the limited efficacy of antioxidant therapies tested in Npc1 model (74,75).
Liver disease in NPC1 can be severe, but transient, during the neonatal period (4). Although minor elevations of transaminases persist, it is not clear why the liver disease ‘resolves’ as an acute clinical problem in the majority of cases. The data from this study suggest that there may be a delay in the maturation of gene expression patterns that could contribute to impaired neonatal liver dysfunction. Decreased expression of cytochrome P450 enzymes could lead to impaired metabolism of endogenous metabolites and drugs. Similarly, there appears to be a delayed maturation of the normal aldolases A and B expression pattern. Aldob efficiently catalyzes the metabolism of fructose-1 phosphate in addition to fructose 1,6 diphosphate. Interestingly, fructose-1 phosphate aldolase deficiency has been reported in Tay–Sachs disease (76). Although these hypotheses need to be experimentally tested, one could consider the potential therapeutic efficacy of the induction of P450 enzymes or the restriction of fructose intake in NPC1 patients with significant liver disease. Delayed maturation of a normal liver expression pattern may explain the transient nature of liver dysfunction frequently observed in NPC1 patients.
We identified and established potential usefulness of LGALS3 and CTSD as biomarkers for NPC1. LGALS3 or galectin-3 is ubiquitously expressed, and binds carbohydrates through its C-terminal region (77). As an intracellular protein, it can be found in both the cytoplasm and nucleus, and as an extracellular protein it can be present on the cell surface or the extracellular matrix. Its functions are numerous and are highly dependent on its localization and the presence of other proteins. In the nucleus, it has been shown to play a role in RNA splicing (78), through binding to ribonucleoprotein complexes, and in transcriptional regulation, through binding to transcription factors/regulators (77). Cytoplasmic galectin-3 has been shown to regulate cell proliferation, differentiation, survival and death, via interaction with the K-Ras and Akt pathways. LGALS3 has also been reported to play a role in the regulation of apoptosis (77). Extracellular galectin-3 has both autocrine and paracrine activities, mediating cell adhesion, cell activation and acting as a chemoattractant in both acute and chronic inflammation. Increased galectin-3 expression in the Npc1−/− mouse liver, along with its elevated serum levels in NPC1 patients, is likely to be related to an inflammatory process. Macrophages are the main type of cells secreting galectin-3 (57), and activation of Kupffer cells or inflammatory cell recruitment to the liver is the likely source of galectin-3 in patient serum. Alternatively, Lgals3 has also been implicated in fibrotic diseases, and hepatocytes have been shown to express galectin-3 in association with liver fibrosis (58,59). Thus, hepatocytes could be another cellular source of secreted galectin-3 during late phases of the disease.
CTSD is a lysosomal aspartic protease, produced as a pre-pro-protein. Pre-pro-CTSD undergoes processing in both the endoplasmic reticulum and lysosomes to produce an active 48 kDa form (79). Pro-CTSD, the secreted, catalytically inactive form, has been shown to act as an autocrine growth factor in various types of cancer (79). Active CTSD is thought to be a nonspecific protease in lysosomes. Interestingly, in Alzheimer disease, CTSD is abundantly present in both senile plaques and neurofibrillary tangles (54,80,81), is elevated in cerebrospinal fluid (55) and is involved in the processing of amyloid precursor protein (56), apolipoprotein E (81) and Tau protein (82). CTSD has previously been implicated in NPC1 pathology. Amritraj et al. (83) evaluated the role of both cathepsin B and D in Npc1 mouse brain and U18666A-treated cortical neurons. This group showed increased levels of both cytosolic CTSB and CTSD in cerebellar neurons relative to hippocampal neurons. Cerebellar neurons are preferentially affected in NPC1 disease, suggesting a role of cathepsins in neuronal pathology. The presence of catalytically active Ctsd in the cytosol of NPC1 cells, as a result of lysosomal permeabilization, could participate in apoptosis. The enzymatic function of CTSD has recently been shown to persist at more neutral pH, and could be responsible for ceramide-induced apoptosis via the processing of BH3-interacting domain death agonist protein, a proapoptotic Bcl-2 family member, and cytochrome c release from mitochondria (84). Wang et al. (85) demonstrated increased lipidation of endogenously synthesized ApoA-I in Npc1 mutant hepatocytes consistent with increased Abca1 activity. This group had previously reported that Ctsd posttranscriptionally regulates Abca1 (86). Consistent with this prior observation, they reported increased Ctsd expression in Npc1 hepatocytes (85). In addition to NPC1 disease, CTSD had been shown to be upregulated in other LSDs, especially in brain homogenates of mouse models for GD, GM1 and GM2 gangliosidosis (87). Although intracellular upregulation of CTSD seems to be common to LSDs, we showed much higher CTSD levels in NPC1 patient serum when compared with other LSDs patient serum, suggesting that increased secretion of this enzyme could be a distinctive characteristic of NPC1 disease.
Biomarkers are tools that can be used to monitor disease progression or therapeutic interventions. In this context, multiple biomarkers corresponding to different aspects of the pathological cascade are needed. The progressive upregulation of expression of Lgals3 and Ctsd in mice and the correlation of their serum concentrations with disease severity in NPC1 patients suggest that these two markers could be indicators of disease progression. Miglustat treatment showed only limited effect on the expression of both genes in the liver of the mouse model, and no differences were observed between off-label miglustat-treated and -untreated NPC1 patients. In contrast, HP-β-CD, a cyclic oligosaccharide that has been shown to be efficacious in treating both NPC1 mice and cats (29,30,66–68), significantly decreases the aberrant expression of both Lgals3 and Ctsd in Npc1 mutant mice. These data suggest that these two serum-based biomarkers will be useful tools in the evaluation of the potential therapeutic efficacy of HP-β-CD in NPC1 patients.
In conclusion, our gene expression profiling identified numerous DEGs and multiple pathways related to various pathological aspects of NPC1 disease, several of these have not been noted prior to this work. The genes or pathways with an early dysregulation are of particular interest, as they might constitute interesting targets for therapeutic interventions. This study also identified two novel serum biomarkers that can potentially be used to monitor disease progression and to facilitate the evaluation of efficacy of potential therapeutic interventions.
MATERIALS AND METHODS
Animal breeding, treatment and tissue collection
All animal work conformed to National Institutes of Health guidelines and was approved by the Eunice Kennedy Shriver National Institute of Child Health and Human Development Institutional Animal Care and Use Committee and the Einstein College of Medicine Institutional Animal Care and Use Committee. Heterozygous Npc1+/− mice were intercrossed to obtain control (Npc1+/+) and mutant (Npc1−/−) littermates. Pups were weaned 3 weeks after birth and subsequently had free access to water and normal mouse chow. PCR genotyping was performed using tail DNA (88). Female pups were sacrificed at 1, 3, 5, 7, 9 and 11 weeks of age. Only female mice were used to avoid increasing variability due to potential gender effects on gene expression. Livers were collected from both mutant and control animals, and immediately frozen on dry ice. Four livers were collected corresponding to each age and genotype, for a total of 48 samples.
Npc1+/+ and Npc1−/− mice were enrolled in a specific treatment regime: untreated, HP-β-CD-treated, miglustat-treated or combination-treated (HP-β-CD + miglustat). Starting at P7 and every other day thereafter, some mice were injected subcutaneously (SC) with 20% HP-β-CD (4000 mg/kg; 0.143 m; H107, Sigma Aldrich, St Louis, MO, USA). Additionally, some mice were injected intraperitoneally (IP) every day starting at P10 until P23 with either saline (control; 0.9% normal saline; 104 6816, Fisher Scientific, Waltham, MA, USA) or miglustat (dissolved in saline; 300 mg/kg; a gift from Oxford GlycoSciences, Abingdon, UK/Celltech UK, Slough, Berkshire, UK). Following weaning at P23, all mice were housed individually in cages and fed powdered chow (Lab Diet 5058, PMI Nutrition International, LLC, Brentwood, MO, USA) to which miglustat was added daily (1200 mg/kg) according to assigned treatment. Treated Npc1−/− and Npc1+/+ littermates were sacrificed at ∼9 weeks old, with age-matched untreated animals for comparison. Mice were deeply anesthetized with an IP injection of sodium pentobarbital (150 mg/kg), and when insensate, were transcardially perfused with 0.9% saline solution. Following perfusion, a craniotomy was performed and the liver was removed, immediately frozen in liquid nitrogen and then stored at −80°C.
RNA extraction
Total RNA was extracted from the liver tissue, using TRIzol reagent (Invitrogen), followed by purification with Qiagen RNeasy Mini Columns (Qiagen). For gene expression profiling, the quality and the quantity of RNA were assessed using both a Bioanalyzer (Agilent, Inc.) and NanoDrop (Thermo Scientific, Inc.).
Microarray hybridization and data analysis
Microarray experiments were performed using standard Affymetrix protocols (Affymetrix, Inc.). Briefly, 200 ng of total RNA was reverse-transcribed to obtain labeled cDNA as recommended by the manufacturer. The hybridization cocktail containing the fragmented and labeled cDNAs was hybridized to Affymetrix Mouse GeneChip 1.0 ST chips, and the chips were washed and stained using standard protocols for the Affymetrix Fluidics Station. Probe arrays were stained with the streptavidin phycoerythrin solution (Molecular Probes) and enhanced using an antibody solution containing 0.5 mg/ml of biotinylated anti-streptavidin (Vector Laboratories). Arrays were scanned using the Affymetrix Gene Chip Scanner 3000, and gene expression intensities were calculated using the Affymetrix GeneChip Command Console software. Affymetrix .CEL files were normalized using the RMA (robust multi-array analysis) algorithm within the Partek Genomics Suite software, version 6.5 (Partek, Inc.). Analysis of variance (ANOVA) and linear contrasts were used to identify DEGs, using a larger set of samples, including additional controls. Lists of genes differentially expressed between Npc1−/− and control mice were generated at each time point, using a combination of thresholds for both uncorrected P-value and FC (P-value ≤ 0.05, and FC ≤ −1.3 or ≥1.3). This gene selection method combining P-value and FC cutoff was previously demonstrated to result in higher concordance degree of DEGs between different platforms, when compared with genes selected only on P-value ranking (89–91). Pathway and GO-enrichment analysis was carried out using the Partek® software (copyright: Partek, Inc., St Louis, MO, USA) and the MetaCore software (from GeneGo, Inc.). All microarray data used in this study are available through the National Center for Biotechnology Information's Gene Expression Omnibus (series accession number GSE33467). An Excel table with the result of the ANOVA for the whole genome is also available as a downloadable file (Supplementary Material).
Comparison with other microarray studies
Four other microarray studies using either cerebellum or the liver from the murine mouse model or human fibroblasts have been published (25–28). Gene symbols in the two human gene lists were converted to their murine orthologs, using the Ensembl Biomart tool (http://www.ensembl.org/biomart/martview, last accessed on May 24, 2012). Gene symbol lists were then compared with our gene list in Excel, to identify common genes with altered expression.
Real-time PCR
Total RNA (10 μg), from the same set of livers used for the microarray analysis, was reverse-transcribed into cDNA, using a high-capacity cDNA archive kit, according to the manufacturer's instructions (Applied Biosystems). The following TaqMan assays were used to assess the expression level of a few genes with an altered expression in the microarray data (Applied Biosystems): Npc1 (Mm00435283), Abcg1 (Mm01348250), Sqle (Mm00436772), Idi1 (Mm00836417), Cyp51 (Mm00490968), Lpl (Mm00434770), Hexa (Mm00599877), Mmp12 (Mm00500554), Hhip (Mm00469580), Rragd (Mm00546741), Gpnmb (Mm00504347), Itgax (Mm00498698), Itgb2 (Mm00434513), Ctss (Mm01255859), Cyba (Mm00514478), Cybb (Mm01287743), Lyz2 (Mm01612741), Syngr1 (Mm00447433), Ctsd (Mm00515586), Lgals3 (Mm00802901). Gapdh was used as reference (TaqMan Rodent GAPDH control reagents, Applied Biosystems). All the different gene assays were first validated using serial dilutions of a control cDNA to check their efficiency rates in qPCR compared with Gapdh.
qPCR was performed in 384-well plates with an Applied Biosystems 7900 real-time PCR system. Each sample was analyzed in triplicate, using 50 ng of total cDNA for each reaction. The relative quantification of gene expression was performed with the comparative cycle number measured with the threshold method (CT) (92), using the 1-week-old control samples as reference for quantification, and was plotted with the mean and the standard error of the mean (SEM) for each age- and genotype-group. An ANOVA with a Games–Howell correction was performed to assess the significance of the difference of means between control and mutant samples at each age.
Patients
This study was approved by the Eunice Kennedy Shriver National Institute of Child Health and Human Development Institutional Review Board. Informed consent and, when appropriate, assent were obtained. Serum samples were obtained from 16 male and 14 female NPC1 patients participating in a Natural History trial (06-CH-0186) and 16 control individuals of similar age and gender distribution. Mean age of patients and controls were 7.9 ± 5.8 years old and 9.1 ± 4.2 years old, respectively (P-value = 0.3720). Phenotypic severity was determined using the severity scale developed by Yanjanin et al. (60), which ranged from 0 to 40. The 4-month-old female with a severity score of 0 has an unusual, severe liver presentation, with no neurological signs, and was therefore excluded from the statistical analyses. Eighteen (60%) of the patients were being treated off-label with miglustat, an inhibitor of glycosphingolipid synthesis. Serum samples from patients affected with GD, INCL and both GM1 and GM2 gangliosidosis were obtained from other ongoing NIH trials.
Enzyme-linked immunosorbant assays
Serum levels of CTSD (EMD Millipore) and galectin-3 (LGALS3, R&D systems) were measured in triplicate by ELISA, following manufacturers' instructions. Standards were prepared following manufacturers' instructions. A standard curve was generated by linear regression and polynomial regression for LGALS3 and CTSD, respectively. For LGALS3, a 1:3 dilution was performed for both control and patient serum with the calibrator diluent provided by the manufacturer. For CTSD, serum was not diluted for controls, but diluted 1:2 for patients with the sample diluent reagent provided by the manufacturer. Serum from some NPC1 patients with high CTSD levels (>50 ng/ml) had to be diluted up to 20-fold in order to be within the linear range of the assay.
SUPPLEMENTARY MATERIAL
FUNDING
The authors received support from the Ara Parseghian Medical Research Foundation (N.Y. and D.S.O.), Dana's Angels Research Trust (D.S.O. and S.U.W.), the Therapeutics for Rare and Neglected Diseases program, the NIH (grant number NS053677 to S.U.W.), the intramural research program of the Eunice Kennedy Shriver National Institute of Child Health and Human Development, the intramural research program of the National Human Genome Research Institute, a Bench to Bedside award from the Office of Rare Diseases and the National Institutes of Health Clinical Research Center.
Supplementary Material
ACKNOWLEDGEMENTS
The authors would like to thank Ellen Sidransky, Anil Mukherjee and Cindy Tifft for the generous gift of serum samples from their LSD patients; Ray Mullen for helpful technical assistance; Abdel Elkhalhoun and the NHGRI microarray core facility for microarray experiments; Niraj Trivedi and the NHGRI bioinformatics core for help with the microarray analysis; and Laura Baxter for critical reading of the manuscript. The authors would like to acknowledge the contribution of the caretakers, the patients and their families who participated in this study.
Conflict of interest statement. None declared.
REFERENCES
- 1.Zervas M., Dobrenis K., Walkley S.U. Neurons in Niemann-Pick disease type C accumulate gangliosides as well as unesterified cholesterol and undergo dendritic and axonal alterations. J. Neuropathol. Exp. Neurol. 2001;60:49–64. doi: 10.1093/jnen/60.1.49. [DOI] [PubMed] [Google Scholar]
- 2.Pentchev P.G., Comly M.E., Kruth H.S., Tokoro T., Butler J., Sokol J., Filling-Katz M., Quirk J.M., Marshall D.C., Patel S., et al. Group C Niemann-Pick disease: faulty regulation of low-density lipoprotein uptake and cholesterol storage in cultured fibroblasts. FASEB J. 1987;1:40–45. doi: 10.1096/fasebj.1.1.3609608. [DOI] [PubMed] [Google Scholar]
- 3.Vanier M.T., Millat G. Niemann-Pick disease type C. Clin. Genet. 2003;64:269–281. doi: 10.1034/j.1399-0004.2003.00147.x. [DOI] [PubMed] [Google Scholar]
- 4.Kelly D.A., Portmann B., Mowat A.P., Sherlock S., Lake B.D. Niemann-Pick disease type C: diagnosis and outcome in children, with particular reference to liver disease. J. Pediatr. 1993;123:242–247. doi: 10.1016/s0022-3476(05)81695-6. [DOI] [PubMed] [Google Scholar]
- 5.Yerushalmi B., Sokol R.J., Narkewicz M.R., Smith D., Ashmead J.W., Wenger D.A. Niemann-Pick disease type C in neonatal cholestasis at a North American Center. J. Pediatr. Gastroenterol. Nutr. 2002;35:44–50. doi: 10.1097/00005176-200207000-00011. [DOI] [PubMed] [Google Scholar]
- 6.Carstea E.D., Morris J.A., Coleman K.G., Loftus S.K., Zhang D., Cummings C., Gu J., Rosenfeld M.A., Pavan W.J., Krizman D.B., et al. Niemann-Pick C1 disease gene: homology to mediators of cholesterol homeostasis. Science. 1997;277:228–231. doi: 10.1126/science.277.5323.228. [DOI] [PubMed] [Google Scholar]
- 7.Ory D.S. The Niemann-Pick disease genes; regulators of cellular cholesterol homeostasis. Trends Cardiovasc. Med. 2004;14:66–72. doi: 10.1016/j.tcm.2003.12.003. [DOI] [PubMed] [Google Scholar]
- 8.Greer W.L., Riddell D.C., Gillan T.L., Girouard G.S., Sparrow S.M., Byers D.M., Dobson M.J., Neumann P.E. The Nova Scotia (type D) form of Niemann-Pick disease is caused by a G3097–>T transversion in NPC1. Am. J. Hum. Genet. 1998;63:52–54. doi: 10.1086/301931. [DOI] [PMC free article] [PubMed] [Google Scholar]
- 9.Naureckiene S., Sleat D.E., Lackland H., Fensom A., Vanier M.T., Wattiaux R., Jadot M., Lobel P. Identification of HE1 as the second gene of Niemann-Pick C disease. Science. 2000;290:2298–2301. doi: 10.1126/science.290.5500.2298. [DOI] [PubMed] [Google Scholar]
- 10.Friedland N., Liou H.L., Lobel P., Stock A.M. Structure of a cholesterol-binding protein deficient in Niemann-Pick type C2 disease. Proc. Natl Acad. Sci. USA. 2003;100:2512–2517. doi: 10.1073/pnas.0437840100. [DOI] [PMC free article] [PubMed] [Google Scholar]
- 11.Kwon H.J., Abi-Mosleh L., Wang M.L., Deisenhofer J., Goldstein J.L., Brown M.S., Infante R.E. Structure of N-terminal domain of NPC1 reveals distinct subdomains for binding and transfer of cholesterol. Cell. 2009;137:1213–1224. doi: 10.1016/j.cell.2009.03.049. [DOI] [PMC free article] [PubMed] [Google Scholar]
- 12.Sleat D.E., Wiseman J.A., El-Banna M., Price S.M., Verot L., Shen M.M., Tint G.S., Vanier M.T., Walkley S.U., Lobel P. Genetic evidence for nonredundant functional cooperativity between NPC1 and NPC2 in lipid transport. Proc. Natl Acad. Sci. USA. 2004;101:5886–5891. doi: 10.1073/pnas.0308456101. [DOI] [PMC free article] [PubMed] [Google Scholar]
- 13.Infante R.E., Wang M.L., Radhakrishnan A., Kwon H.J., Brown M.S., Goldstein J.L. NPC2 facilitates bidirectional transfer of cholesterol between NPC1 and lipid bilayers, a step in cholesterol egress from lysosomes. Proc. Natl Acad. Sci. USA. 2008;105:15287–15292. doi: 10.1073/pnas.0807328105. [DOI] [PMC free article] [PubMed] [Google Scholar]
- 14.Morris M.D., Bhuvaneswaran C., Shio H., Fowler S. Lysosome lipid storage disorder in NCTR-BALB/c mice. I. Description of the disease and genetics. Am. J. Pathol. 1982;108:140–149. [PMC free article] [PubMed] [Google Scholar]
- 15.Beltroy E.P., Liu B., Dietschy J.M., Turley S.D. Lysosomal unesterified cholesterol content correlates with liver cell death in murine Niemann-Pick type C disease. J. Lipid Res. 2007;48:869–881. doi: 10.1194/jlr.M600488-JLR200. [DOI] [PubMed] [Google Scholar]
- 16.Beltroy E.P., Richardson J.A., Horton J.D., Turley S.D., Dietschy J.M. Cholesterol accumulation and liver cell death in mice with Niemann-Pick type C disease. Hepatology. 2005;42:886–893. doi: 10.1002/hep.20868. [DOI] [PubMed] [Google Scholar]
- 17.Garver W.S., Jelinek D., Oyarzo J.N., Flynn J., Zuckerman M., Krishnan K., Chung B.H., Heidenreich R.A. Characterization of liver disease and lipid metabolism in the Niemann-Pick C1 mouse. J. Cell. Biochem. 2007;101:498–516. doi: 10.1002/jcb.21200. [DOI] [PubMed] [Google Scholar]
- 18.Loftus S.K., Erickson R.P., Walkley S.U., Bryant M.A., Incao A., Heidenreich R.A., Pavan W.J. Rescue of neurodegeneration in Niemann-Pick C mice by a prion-promoter-driven Npc1 cDNA transgene. Hum. Mol. Genet. 2002;11:3107–3114. doi: 10.1093/hmg/11.24.3107. [DOI] [PubMed] [Google Scholar]
- 19.Erickson R.P., Bhattacharyya A., Hunter R.J., Heidenreich R.A., Cherrington N.J. Liver disease with altered bile acid transport in Niemann-Pick C mice on a high-fat, 1% cholesterol diet. Am. J. Physiol. Gastrointest. Liver Physiol. 2005;289:G300–G307. doi: 10.1152/ajpgi.00568.2004. [DOI] [PubMed] [Google Scholar]
- 20.Porter F.D., Scherrer D.E., Lanier M.H., Langmade S.J., Molugu V., Gale S.E., Olzeski D., Sidhu R., Dietzen D.J., Fu R., et al. Cholesterol oxidation products are sensitive and specific blood-based biomarkers for Niemann-Pick C1 disease. Sci. Transl. Med. 2010;2:56ra81. doi: 10.1126/scitranslmed.3001417. [DOI] [PMC free article] [PubMed] [Google Scholar]
- 21.Jiang X., Sidhu R., Porter F.D., Yanjanin N.M., Speak A.O., Te Vruchte D.T., Platt F.M., Fujiwara H., Scherrer D.E., Zhang J., et al. A sensitive and specific LC-MS/MS method for rapid diagnosis of Niemann-Pick C1 disease from human plasma. J. Lipid Res. 2011;52:1435–1445. doi: 10.1194/jlr.D015735. [DOI] [PMC free article] [PubMed] [Google Scholar]
- 22.Elrick M.J., Pacheco C.D., Yu T., Dadgar N., Shakkottai V.G., Ware C., Paulson H.L., Lieberman A.P. Conditional Niemann-Pick C mice demonstrate cell autonomous Purkinje cell neurodegeneration. Hum. Mol. Genet. 2010;19:837–847. doi: 10.1093/hmg/ddp552. [DOI] [PMC free article] [PubMed] [Google Scholar]
- 23.Klein A., Amigo L., Retamal M.J., Morales M.G., Miquel J.F., Rigotti A., Zanlungo S. NPC2 is expressed in human and murine liver and secreted into bile: potential implications for body cholesterol homeostasis. Hepatology. 2006;43:126–133. doi: 10.1002/hep.20985. [DOI] [PubMed] [Google Scholar]
- 24.Blom T.S., Linder M.D., Snow K., Pihko H., Hess M.W., Jokitalo E., Veckman V., Syvanen A.C., Ikonen E. Defective endocytic trafficking of NPC1 and NPC2 underlying infantile Niemann-Pick type C disease. Hum. Mol. Genet. 2003;12:257–272. doi: 10.1093/hmg/ddg025. [DOI] [PubMed] [Google Scholar]
- 25.Reddy J.V., Ganley I.G., Pfeffer S.R. Clues to neuro-degeneration in Niemann-Pick type C disease from global gene expression profiling. PLoS ONE. 2006;1:e19. doi: 10.1371/journal.pone.0000019. [DOI] [PMC free article] [PubMed] [Google Scholar]
- 26.Liao G., Wen Z., Irizarry K., Huang Y., Mitsouras K., Darmani M., Leon T., Shi L., Bi X. Abnormal gene expression in cerebellum of Npc1-/- mice during postnatal development. Brain Res. 2010;1325:128–140. doi: 10.1016/j.brainres.2010.02.019. [DOI] [PMC free article] [PubMed] [Google Scholar]
- 27.De Windt A., Rai M., Kytomaki L., Thelen K.M., Lutjohann D., Bernier L., Davignon J., Soini J., Pandolfo M., Laaksonen R. Gene set enrichment analyses revealed several affected pathways in Niemann-pick disease type C fibroblasts. DNA Cell Biol. 2007;26:665–671. doi: 10.1089/dna.2006.0570. [DOI] [PubMed] [Google Scholar]
- 28.Vazquez M.C., Del Pozo T., Robledo F.A., Carrasco G., Pavez L., Olivares F., Gonzalez M., Zanlungo S. Alteration of gene expression profile in Niemann-Pick type C mice correlates with tissue damage and oxidative stress. PLoS ONE. 2011;6:e28777. doi: 10.1371/journal.pone.0028777. [DOI] [PMC free article] [PubMed] [Google Scholar]
- 29.Ramirez C.M., Liu B., Taylor A.M., Repa J.J., Burns D.K., Weinberg A.G., Turley S.D., Dietschy J.M. Weekly cyclodextrin administration normalizes cholesterol metabolism in nearly every organ of the Niemann-Pick type C1 mouse and markedly prolongs life. Pediatr. Res. 2010;68:309–315. doi: 10.1203/PDR.0b013e3181ee4dd2. [DOI] [PMC free article] [PubMed] [Google Scholar]
- 30.Liu B., Ramirez C.M., Miller A.M., Repa J.J., Turley S.D., Dietschy J.M. Cyclodextrin overcomes the transport defect in nearly every organ of NPC1 mice leading to excretion of sequestered cholesterol as bile acid. J. Lipid Res. 2010;51:933–944. doi: 10.1194/jlr.M000257. [DOI] [PMC free article] [PubMed] [Google Scholar]
- 31.Liu B., Turley S.D., Burns D.K., Miller A.M., Repa J.J., Dietschy J.M. Reversal of defective lysosomal transport in NPC disease ameliorates liver dysfunction and neurodegeneration in the npc1-/- mouse. Proc. Natl Acad. Sci. USA. 2009;106:2377–2382. doi: 10.1073/pnas.0810895106. [DOI] [PMC free article] [PubMed] [Google Scholar]
- 32.Repa J.J., Li H., Frank-Cannon T.C., Valasek M.A., Turley S.D., Tansey M.G., Dietschy J.M. Liver X receptor activation enhances cholesterol loss from the brain, decreases neuroinflammation, and increases survival of the NPC1 mouse. J. Neurosci. 2007;27:14470–14480. doi: 10.1523/JNEUROSCI.4823-07.2007. [DOI] [PMC free article] [PubMed] [Google Scholar]
- 33.Chen Y., Goldstein J.A. The transcriptional regulation of the human CYP2C genes. Curr. Drug Metab. 2009;10:567–578. doi: 10.2174/138920009789375397. [DOI] [PMC free article] [PubMed] [Google Scholar]
- 34.Wu Y.P., Mizukami H., Matsuda J., Saito Y., Proia R.L., Suzuki K. Apoptosis accompanied by up-regulation of TNF-alpha death pathway genes in the brain of Niemann-Pick type C disease. Mol. Genet. Metab. 2005;84:9–17. doi: 10.1016/j.ymgme.2004.08.017. [DOI] [PubMed] [Google Scholar]
- 35.Klein A., Maldonado C., Vargas L.M., Gonzalez M., Robledo F., Perez de Arce K., Munoz F.J., Hetz C., Alvarez A.R., Zanlungo S. Oxidative stress activates the c-Abl/p73 proapoptotic pathway in Niemann-Pick type C neurons. Neurobiol. Dis. 2011;41:209–218. doi: 10.1016/j.nbd.2010.09.008. [DOI] [PubMed] [Google Scholar]
- 36.Fu R., Yanjanin N.M., Bianconi S., Pavan W.J., Porter F.D. Oxidative stress in Niemann-Pick disease, type C. Mol. Genet. Metab. 2010;101:214–218. doi: 10.1016/j.ymgme.2010.06.018. [DOI] [PMC free article] [PubMed] [Google Scholar]
- 37.Rimkunas V.M., Graham M.J., Crooke R.M., Liscum L. TNF-{alpha} plays a role in hepatocyte apoptosis in Niemann-Pick type C liver disease. J. Lipid Res. 2009;50:327–333. doi: 10.1194/jlr.M800415-JLR200. [DOI] [PMC free article] [PubMed] [Google Scholar]
- 38.Schaeffer H.J., Weber M.J. Mitogen-activated protein kinases: specific messages from ubiquitous messengers. Mol. Cell. Biol. 1999;19:2435–2444. doi: 10.1128/mcb.19.4.2435. [DOI] [PMC free article] [PubMed] [Google Scholar]
- 39.Weston C.R., Davis R.J. The JNK signal transduction pathway. Curr. Opin. Cell Biol. 2007;19:142–149. doi: 10.1016/j.ceb.2007.02.001. [DOI] [PubMed] [Google Scholar]
- 40.Kohyama M., Ise W., Edelson B.T., Wilker P.R., Hildner K., Mejia C., Frazier W.A., Murphy T.L., Murphy K.M. Role for Spi-C in the development of red pulp macrophages and splenic iron homeostasis. Nature. 2009;457:318–321. doi: 10.1038/nature07472. [DOI] [PMC free article] [PubMed] [Google Scholar]
- 41.Schweitzer B.L., Huang K.J., Kamath M.B., Emelyanov A.V., Birshtein B.K., DeKoter R.P. Spi-C has opposing effects to PU.1 on gene expression in progenitor B cells. J. Immunol. 2006;177:2195–2207. doi: 10.4049/jimmunol.177.4.2195. [DOI] [PubMed] [Google Scholar]
- 42.Numazaki M., Tsutsumi K., Tsutsumi R., Ishikawa K. Expression of aldolase isozyme mRNAs in fetal rat liver. Eur. J. Biochem. 1984;142:165–170. doi: 10.1111/j.1432-1033.1984.tb08265.x. [DOI] [PubMed] [Google Scholar]
- 43.Reid S., Masters C. On the ontogeny of aldolase isozymes and their interactions with cellular structure. Mech. Ageing Dev. 1985;30:299–317. doi: 10.1016/0047-6374(85)90119-8. [DOI] [PubMed] [Google Scholar]
- 44.Hines R.N. Ontogeny of human hepatic cytochromes P450. J. Biochem. Mol. Toxicol. 2007;21:169–175. doi: 10.1002/jbt.20179. [DOI] [PubMed] [Google Scholar]
- 45.Hart S.N., Cui Y., Klaassen C.D., Zhong X.B. Three patterns of cytochrome P450 gene expression during liver maturation in mice. Drug Metab. Dispos. 2009;37:116–121. doi: 10.1124/dmd.108.023812. [DOI] [PMC free article] [PubMed] [Google Scholar]
- 46.Herlong J.L., Scott T.R. Positioning prostanoids of the D and J series in the immunopathogenic scheme. Immunol. Lett. 2006;102:121–131. doi: 10.1016/j.imlet.2005.10.004. [DOI] [PubMed] [Google Scholar]
- 47.Nakamura H., Yasufuku K., Makiyama T., Matsumoto I., Fujino H., Murayama T. Arachidonic acid metabolism via cytosolic phospholipase A(2) alpha induces cytotoxicity in Niemann-Pick disease type C cells. J. Cell. Physiol. 2011;227:2847–2855. doi: 10.1002/jcp.23025. [DOI] [PubMed] [Google Scholar]
- 48.Huwiler A., Pfeilschifter J. Lipids as targets for novel anti-inflammatory therapies. Pharmacol. Ther. 2009;124:96–112. doi: 10.1016/j.pharmthera.2009.06.008. [DOI] [PubMed] [Google Scholar]
- 49.Kaspera R., Totah R.A. Epoxyeicosatrienoic acids: formation, metabolism and potential role in tissue physiology and pathophysiology. Expert Opin. Drug Metab. Toxicol. 2009;5:757–771. doi: 10.1517/17425250902932923. [DOI] [PubMed] [Google Scholar]
- 50.Node K., Huo Y., Ruan X., Yang B., Spiecker M., Ley K., Zeldin D.C., Liao J.K. Anti-inflammatory properties of cytochrome P450 epoxygenase-derived eicosanoids. Science. 1999;285:1276–1279. doi: 10.1126/science.285.5431.1276. [DOI] [PMC free article] [PubMed] [Google Scholar]
- 51.Chen Y., Zhang Y., Yin Y., Gao G., Li S., Jiang Y., Gu X., Luo J. SPD—a web-based secreted protein database. Nucleic Acids Res. 2005;33:D169–D173. doi: 10.1093/nar/gki093. [DOI] [PMC free article] [PubMed] [Google Scholar]
- 52.Ertekin-Taner N., Ronald J., Feuk L., Prince J., Tucker M., Younkin L., Hella M., Jain S., Hackett A., Scanlin L., et al. Elevated amyloid beta protein (Abeta42) and late onset Alzheimer's disease are associated with single nucleotide polymorphisms in the urokinase-type plasminogen activator gene. Hum. Mol. Genet. 2005;14:447–460. doi: 10.1093/hmg/ddi041. [DOI] [PubMed] [Google Scholar]
- 53.Finckh U., van Hadeln K., Muller-Thomsen T., Alberici A., Binetti G., Hock C., Nitsch R.M., Stoppe G., Reiss J., Gal A. Association of late-onset Alzheimer disease with a genotype of PLAU, the gene encoding urokinase-type plasminogen activator on chromosome 10q22.2. Neurogenetics. 2003;4:213–217. doi: 10.1007/s10048-003-0157-9. [DOI] [PubMed] [Google Scholar]
- 54.Cataldo A.M., Nixon R.A. Enzymatically active lysosomal proteases are associated with amyloid deposits in Alzheimer brain. Proc. Natl Acad. Sci. USA. 1990;87:3861–3865. doi: 10.1073/pnas.87.10.3861. [DOI] [PMC free article] [PubMed] [Google Scholar]
- 55.Schwagerl A.L., Mohan P.S., Cataldo A.M., Vonsattel J.P., Kowall N.W., Nixon R.A. Elevated levels of the endosomal-lysosomal proteinase cathepsin D in cerebrospinal fluid in Alzheimer disease. J. Neurochem. 1995;64:443–446. doi: 10.1046/j.1471-4159.1995.64010443.x. [DOI] [PubMed] [Google Scholar]
- 56.Ladror U.S., Snyder S.W., Wang G.T., Holzman T.F., Krafft G.A. Cleavage at the amino and carboxyl termini of Alzheimer's amyloid-beta by cathepsin D. J. Biol. Chem. 1994;269:18422–18428. [PubMed] [Google Scholar]
- 57.Liu F.T., Hsu D.K., Zuberi R.I., Kuwabara I., Chi E.Y., Henderson W.R., Jr. Expression and function of galectin-3, a beta-galactoside-binding lectin, in human monocytes and macrophages. Am. J. Pathol. 1995;147:1016–1028. [PMC free article] [PubMed] [Google Scholar]
- 58.Hsu D.K., Dowling C.A., Jeng K.C., Chen J.T., Yang R.Y., Liu F.T. Galectin-3 expression is induced in cirrhotic liver and hepatocellular carcinoma. Int. J. Cancer. 1999;81:519–526. doi: 10.1002/(sici)1097-0215(19990517)81:4<519::aid-ijc3>3.0.co;2-0. [DOI] [PubMed] [Google Scholar]
- 59.Henderson N.C., Sethi T. The regulation of inflammation by galectin-3. Immunol. Rev. 2009;230:160–171. doi: 10.1111/j.1600-065X.2009.00794.x. [DOI] [PubMed] [Google Scholar]
- 60.Yanjanin N.M., Velez J.I., Gropman A., King K., Bianconi S.E., Conley S.K., Brewer C.C., Solomon B., Pavan W.J., Arcos-Burgos M., et al. Linear clinical progression, independent of age of onset, in Niemann-Pick disease, type C. Am. J. Med. Genet. B Neuropsychiatr. Genet. 2010;153B:132–140. doi: 10.1002/ajmg.b.30969. [DOI] [PMC free article] [PubMed] [Google Scholar]
- 61.Patterson M.C., Vecchio D., Jacklin E., Abel L., Chadha-Boreham H., Luzy C., Giorgino R., Wraith J.E. Long-term miglustat therapy in children with Niemann-Pick disease type C. J. Child Neurol. 2010;25:300–305. doi: 10.1177/0883073809344222. [DOI] [PubMed] [Google Scholar]
- 62.Patterson M.C., Vecchio D., Prady H., Abel L., Wraith J.E. Miglustat for treatment of Niemann-Pick C disease: a randomised controlled study. Lancet Neurol. 2007;6:765–772. doi: 10.1016/S1474-4422(07)70194-1. [DOI] [PubMed] [Google Scholar]
- 63.Pineda M., Wraith J.E., Mengel E., Sedel F., Hwu W.L., Rohrbach M., Bembi B., Walterfang M., Korenke G.C., Marquardt T., et al. Miglustat in patients with Niemann-Pick disease Type C (NP-C): a multicenter observational retrospective cohort study. Mol. Genet. Metab. 2009;98:243–249. doi: 10.1016/j.ymgme.2009.07.003. [DOI] [PubMed] [Google Scholar]
- 64.Wraith J.E., Vecchio D., Jacklin E., Abel L., Chadha-Boreham H., Luzy C., Giorgino R., Patterson M.C. Miglustat in adult and juvenile patients with Niemann-Pick disease type C: long-term data from a clinical trial. Mol. Genet. Metab. 2010;99:351–357. doi: 10.1016/j.ymgme.2009.12.006. [DOI] [PubMed] [Google Scholar]
- 65.Liu B., Li H., Repa J.J., Turley S.D., Dietschy J.M. Genetic variations and treatments that affect the lifespan of the NPC1 mouse. J. Lipid Res. 2008;49:663–669. doi: 10.1194/jlr.M700525-JLR200. [DOI] [PubMed] [Google Scholar]
- 66.Davidson C.D., Ali N.F., Micsenyi M.C., Stephney G., Renault S., Dobrenis K., Ory D.S., Vanier M.T., Walkley S.U. Chronic cyclodextrin treatment of murine Niemann-Pick C disease ameliorates neuronal cholesterol and glycosphingolipid storage and disease progression. PLoS ONE. 2009;4:e6951. doi: 10.1371/journal.pone.0006951. [DOI] [PMC free article] [PubMed] [Google Scholar]
- 67.Aqul A., Liu B., Ramirez C.M., Pieper A.A., Estill S.J., Burns D.K., Repa J.J., Turley S.D., Dietschy J.M. Unesterified cholesterol accumulation in late endosomes/lysosomes causes neurodegeneration and is prevented by driving cholesterol export from this compartment. J. Neurosci. 2011;31:9404–9413. doi: 10.1523/JNEUROSCI.1317-11.2011. [DOI] [PMC free article] [PubMed] [Google Scholar]
- 68.Ward S., O'Donnell P., Fernandez S., Vite C.H. 2-hydroxypropyl-beta-cyclodextrin raises hearing threshold in normal cats and in cats with Niemann-Pick type C disease. Pediatr. Res. 2010;68:52–56. doi: 10.1203/PDR.0b013e3181df4623. [DOI] [PMC free article] [PubMed] [Google Scholar]
- 69.Wynn T.A. Cellular and molecular mechanisms of fibrosis. J. Pathol. 2008;214:199–210. doi: 10.1002/path.2277. [DOI] [PMC free article] [PubMed] [Google Scholar]
- 70.Lee J.M., Dedhar S., Kalluri R., Thompson E.W. The epithelial-mesenchymal transition: new insights in signaling, development, and disease. J. Cell Biol. 2006;172:973–981. doi: 10.1083/jcb.200601018. [DOI] [PMC free article] [PubMed] [Google Scholar]
- 71.Rimkunas V.M., Graham M.J., Crooke R.M., Liscum L. In vivo antisense oligonucleotide reduction of NPC1 expression as a novel mouse model for Niemann Pick type C- associated liver disease. Hepatology. 2008;47:1504–1512. doi: 10.1002/hep.22327. [DOI] [PMC free article] [PubMed] [Google Scholar]
- 72.Somers K.L., Brown D.E., Fulton R., Schultheiss P.C., Hamar D., Smith M.O., Allison R., Connally H.E., Just C., Mitchell T.W., et al. Effects of dietary cholesterol restriction in a feline model of Niemann-Pick type C disease. J. Inherit. Metab. Dis. 2001;24:427–436. doi: 10.1023/a:1010588112003. [DOI] [PubMed] [Google Scholar]
- 73.Alvarez A.R., Klein A., Castro J., Cancino G.I., Amigo J., Mosqueira M., Vargas L.M., Yevenes L.F., Bronfman F.C., Zanlungo S. Imatinib therapy blocks cerebellar apoptosis and improves neurological symptoms in a mouse model of Niemann-Pick type C disease. FASEB J. 2008;22:3617–3627. doi: 10.1096/fj.07-102715. [DOI] [PubMed] [Google Scholar]
- 74.Smith D., Wallom K.L., Williams I.M., Jeyakumar M., Platt F.M. Beneficial effects of anti-inflammatory therapy in a mouse model of Niemann-Pick disease type C1. Neurobiol. Dis. 2009;36:242–251. doi: 10.1016/j.nbd.2009.07.010. [DOI] [PubMed] [Google Scholar]
- 75.Bascunan-Castillo E.C., Erickson R.P., Howison C.M., Hunter R.J., Heidenreich R.H., Hicks C., Trouard T.P., Gillies R.J. Tamoxifen and vitamin E treatments delay symptoms in the mouse model of Niemann-Pick C. J. Appl. Genet. 2004;45:461–467. [PubMed] [Google Scholar]
- 76.Volk B.W., Aronson S.M., Saifer A. Fructose-1 phosphate aldolase deficiency in Tay-Sachs disease. Am. J. Med. 1964;36:481–484. doi: 10.1016/0002-9343(64)90097-x. [DOI] [PubMed] [Google Scholar]
- 77.Dumic J., Dabelic S., Flogel M. Galectin-3: an open-ended story. Biochim. Biophys. Acta. 2006;1760:616–635. doi: 10.1016/j.bbagen.2005.12.020. [DOI] [PubMed] [Google Scholar]
- 78.Patterson R.J., Wang W., Wang J.L. Understanding the biochemical activities of galectin-1 and galectin-3 in the nucleus. Glycoconj. J. 2004;19:499–506. doi: 10.1023/B:GLYC.0000014079.87862.c7. [DOI] [PubMed] [Google Scholar]
- 79.Benes P., Vetvicka V., Fusek M. Cathepsin D—many functions of one aspartic protease. Crit. Rev. Oncol. Hematol. 2008;68:12–28. doi: 10.1016/j.critrevonc.2008.02.008. [DOI] [PMC free article] [PubMed] [Google Scholar]
- 80.Cataldo A.M., Thayer C.Y., Bird E.D., Wheelock T.R., Nixon R.A. Lysosomal proteinase antigens are prominently localized within senile plaques of Alzheimer's disease: evidence for a neuronal origin. Brain Res. 1990;513:181–192. doi: 10.1016/0006-8993(90)90456-l. [DOI] [PubMed] [Google Scholar]
- 81.Zhou W., Scott S.A., Shelton S.B., Crutcher K.A. Cathepsin D-mediated proteolysis of apolipoprotein E: possible role in Alzheimer's disease. Neuroscience. 2006;143:689–701. doi: 10.1016/j.neuroscience.2006.08.019. [DOI] [PubMed] [Google Scholar]
- 82.Kenessey A., Nacharaju P., Ko L.W., Yen S.H. Degradation of tau by lysosomal enzyme cathepsin D: implication for Alzheimer neurofibrillary degeneration. J. Neurochem. 1997;69:2026–2038. doi: 10.1046/j.1471-4159.1997.69052026.x. [DOI] [PubMed] [Google Scholar]
- 83.Amritraj A., Peake K., Kodam A., Salio C., Merighi A., Vance J.E., Kar S. Increased activity and altered subcellular distribution of lysosomal enzymes determine neuronal vulnerability in Niemann-Pick type C1-deficient mice. Am. J. Pathol. 2009;175:2540–2556. doi: 10.2353/ajpath.2009.081096. [DOI] [PMC free article] [PubMed] [Google Scholar]
- 84.Heinrich M., Neumeyer J., Jakob M., Hallas C., Tchikov V., Winoto-Morbach S., Wickel M., Schneider-Brachert W., Trauzold A., Hethke A., et al. Cathepsin D links TNF-induced acid sphingomyelinase to Bid-mediated caspase-9 and -3 activation. Cell Death Differ. 2004;11:550–563. doi: 10.1038/sj.cdd.4401382. [DOI] [PubMed] [Google Scholar]
- 85.Wang M.D., Franklin V., Sundaram M., Kiss R.S., Ho K., Gallant M., Marcel Y.L. Differential regulation of ATP binding cassette protein A1 expression and ApoA-I lipidation by Niemann-Pick type C1 in murine hepatocytes and macrophages. J. Biol. Chem. 2007;282:22525–22533. doi: 10.1074/jbc.M700326200. [DOI] [PubMed] [Google Scholar]
- 86.Haidar B., Kiss R.S., Sarov-Blat L., Brunet R., Harder C., McPherson R., Marcel Y.L. Cathepsin D, a lysosomal protease, regulates ABCA1-mediated lipid efflux. J. Biol. Chem. 2006;281:39971–39981. doi: 10.1074/jbc.M605095200. [DOI] [PubMed] [Google Scholar]
- 87.Vitner E.B., Dekel H., Zigdon H., Shachar T., Farfel-Becker T., Eilam R., Karlsson S., Futerman A.H. Altered expression and distribution of cathepsins in neuronopathic forms of Gaucher disease and in other sphingolipidoses. Hum. Mol. Genet. 2010;19:3583–3590. doi: 10.1093/hmg/ddq273. [DOI] [PubMed] [Google Scholar]
- 88.Loftus S.K., Morris J.A., Carstea E.D., Gu J.Z., Cummings C., Brown A., Ellison J., Ohno K., Rosenfeld M.A., Tagle D.A., et al. Murine model of Niemann-Pick C disease: mutation in a cholesterol homeostasis gene. Science. 1997;277:232–235. doi: 10.1126/science.277.5323.232. [DOI] [PubMed] [Google Scholar]
- 89.Guo L., Lobenhofer E.K., Wang C., Shippy R., Harris S.C., Zhang L., Mei N., Chen T., Herman D., Goodsaid F.M., et al. Rat toxicogenomic study reveals analytical consistency across microarray platforms. Nat. Biotechnol. 2006;24:1162–1169. doi: 10.1038/nbt1238. [DOI] [PubMed] [Google Scholar]
- 90.Shi L., Jones W.D., Jensen R.V., Harris S.C., Perkins R.G., Goodsaid F.M., Guo L., Croner L.J., Boysen C., Fang H., et al. The balance of reproducibility, sensitivity, and specificity of lists of differentially expressed genes in microarray studies. BMC Bioinformatics. 2008;9(Suppl. 9):S10. doi: 10.1186/1471-2105-9-S9-S10. [DOI] [PMC free article] [PubMed] [Google Scholar]
- 91.Shi L., Reid L.H., Jones W.D., Shippy R., Warrington J.A., Baker S.C., Collins P.J., de Longueville F., Kawasaki E.S., Lee K.Y., et al. The MicroArray Quality Control (MAQC) project shows inter- and intraplatform reproducibility of gene expression measurements. Nat. Biotechnol. 2006;24:1151–1161. doi: 10.1038/nbt1239. [DOI] [PMC free article] [PubMed] [Google Scholar]
- 92.Livak K.J., Schmittgen T.D. Analysis of relative gene expression data using real-time quantitative PCR and the 2(-Delta Delta C(T)) method. Methods. 2001;25:402–408. doi: 10.1006/meth.2001.1262. [DOI] [PubMed] [Google Scholar]
Associated Data
This section collects any data citations, data availability statements, or supplementary materials included in this article.