Abstract
Purpose.
We evaluated the relationship between cone photoreceptor packing density and outer nuclear layer (ONL) thickness within the central 15 degrees.
Methods.
Individual differences for healthy subjects in cone packing density and ONL thickness were examined in 8 younger and 8 older subjects, mean age 27.2 versus 56.2 years. Cone packing density was obtained using an adaptive optics scanning laser ophthalmoscope (AOSLO). The ONL thickness measurements included the ONL and the Henle fiber layer (ONL + HFL), and were obtained using spectral domain optical coherence tomography (SDOCT) and custom segmentation software.
Results.
There were sizeable individual differences in cone packing density and ONL + HFL thickness. Older subjects had on average lower cone packing densities, but thicker ONL + HFL measurements. Cone packing density and ONL + HFL thickness decreased with increasing retinal eccentricity. The ratio of the cone packing density-to-ONL2 was larger for the younger subjects group, and decreased with retinal eccentricity.
Conclusions.
The individual differences in cone packing density and ONL + HFL thickness are consistent with aging changes, indicating that normative aging data are necessary for fine comparisons in the early stages of disease or response to treatment. Our finding of ONL + HFL thickness increasing with aging is inconsistent with the hypothesis that ONL measurements with SDOCT depend only on the number of functioning cones, since in our older group cones were fewer, but thickness was greater.
There are individual differences in cone packing density, ONL + Henle thickness, and their ratio in the macula. Older subjects have on average fewer cones but thicker ONL + Henle thicknesses, so that early effects of disease or treatment using these parameters require normative data from the subject.
Introduction
Changes to cone structure and function have been measured across age groups with a wide variety of techniques.1–7 These measurement methods are applied readily to central cones, since the subject can fixate centrally and make judgments requiring fine resolution, allowing demonstration of early changes with aging that are consistent with central cones being more fragile or at risk. Dense packing of central cone photoreceptors, along with a high concentration of cone photopigment, is typical of young, healthy subjects, while less densely packed photoreceptors and lower central cone photopigment are found for older subjects.1–5,7 These data are consistent with a remodeling with aging of the foveal region, with photoreceptors being less dense. Consistent with the cone photopigment distribution data, the macular pigment density data have a corresponding ring-shaped maximum in the same older subjects, while the younger subjects have a sharp foveal peak for both distributions. Similarly, young subjects have more phase retardation centrally than older ones, and older subjects have a more eccentric peak of phase retardation, indicating a loss of Henle fiber birefringence in the central fovea with aging that is consistent with lower cone density in the central fovea of older subjects, but not necessarily lower cone density at locations eccentric to the fovea.3
Imaging techniques with high magnification are being developed for assessing aging changes based on data from individual photoreceptors.7 Using an adaptive optics scanning laser ophthalmoscope (AOSLO), we find a lower cone packing density in older subjects compared to younger ones, with individual differences sufficiently large that there is substantial overlap between the two groups. The rod photoreceptors also are fewer in older eyes than younger ones, with large individual differences for cones and rods, based on postmortem data.8,9 Genetic differences may underlie at least one of the causes of individual differences in the numbers of cones.10,11
This loss of cones and rods implies that the outer nuclear layer (ONL) should decrease in thickness with aging, if the measurement depends largely upon the numbers of photoreceptor cell bodies. ONL thickness has been used extensively as a marker of photoreceptor number in studies of retinal degeneration, since the number of rows of photoreceptor nuclei in depth decreases as the rods die in retinal degenerations.12 Measurements of ONL thickness for assessing retinal degeneration in a chicken model were devised for in vivo use by means of optical coherence tomography (OCT).13 ONL thickness was demonstrated later for in vivo measurements in humans with degenerative retinal disease.14 However, for eyes without retinal degeneration, when OCT data were compared to histological sections, the measurements of ONL thickness near the fovea were found to increase, rather than decrease, with aging.15 This finding has been attributed to gliosis of other cells within the boundaries used for ONL measurements with OCT. The ONL in the foveal region also contains significant thickness due to the Henle fiber layer (HFL), which decreases in thickness with increasing eccentricity but extends to hundreds of micrometers.16 The HFL can be visualized better by misaligning the OCT instrument with respect to the subject's pupil.17,18 Thus far, the correction to ONL thickness measurement that is due to the HFL thickness and other factors has not been related to individual differences in age, foveal shape, overall retinal thickness, numbers of cones, or other factors.
We compared the cone packing density from AOSLO to the ONL thickness from spectral domain OCT (SDOCT), for younger and older subjects. We divided the analysis of cone packing density and ONL thickness into two retinal regions: (1) a central region of interest that emphasizes foveal cones in a cone rich area and (2) a more peripheral region of interest with similar or higher numbers of rods. In addition to considerations of local environmental differences for cone- versus rod-rich retina, there are quantitative analysis considerations. When compared on the basis of cone packing density, that is location by location rather than the total numbers of cones, high values for the cone packing density in the fovea dominate the analysis. Thus, the important but very few foveal cones, which are more fragile cones and in a cone-dominated region, influence the analysis that is based on density per unit area.7 Previous studies analyzed cones at each eccentricity separately to avoid biasing conclusions concerning peripheral cones due to the high density values of central cones, which could dominate a linear analysis. However, the previous multiple comparison method did not find an aging change in measured cone densities at eccentricities equal to or greater than 0.54 mm, where the retina still is cone-dominated.
To investigate independently the central versus more peripheral cones, we re-analyzed our previous AOSLO data set7 for those subjects with contemporaneous OCT data, but used a more robust statistical method that allows testing small differences over a larger area. We analyzed the more peripheral data separately to probe the impact of age on peripheral cones, which are larger in diameter, thought to be more robust, more distant from the foveal avascular zone, and in contact with a higher proportion of rods. These cones have been difficult to assess with many previous techniques. For instance, photopigment concentration per unit of retinal area is low because the cones are shorter and sparser with increasing eccentricity. This makes it difficult to obtain accurate maps of cone photopigment density outside of approximately 2–5 degrees eccentricity, depending on the subject, and similarly difficult to obtain changes with aging for cones outside the fovea.2
We present new OCT data to provide the thickness from OCT measurements of the ONL+ HFL in subjects in whom the cones have been quantified. Previous histologic data indicate that for younger subjects, the ONL in the central region of interest should contain a high proportion of cone photoreceptor cell bodies compared to rod photoreceptor cell bodies.8,9 In contrast, these histologic studies indicate that for younger subjects the ONL + HFL thickness in the more peripheral region of interest should reflect similar numbers of rods and cones, or more rods than cones.
Methods
Subjects
A total of 16 healthy subjects (8 younger subjects aged 24–32 years, mean 27.2, and 8 older subjects aged 51–65 years, mean 56.2) participated in this study. All subjects received a complete eye examination, including a subjective refraction and fundus examination. All subjects had best corrected visual acuity of 20/20 or better and were phakic. Exclusion criteria were any evidence of retinal pathology or systemic diseases. Further, we reduced the variability in cone density and ONL + HFL thickness due to eye shape or eye elongation by limiting refractive error. Spherical equivalent refractive errors ranged from +1.00 to −3.75 diopters (D, younger subjects +1.00 to −3.00 D, mean −0.28 D; older subjects +2.50 to −3.75 D, mean −1.03 D) with astigmatism less than −1.00 D when referenced to the spectacle plane. Five axial length measurements of each eye were made using an IOL Master (Carl Zeiss Meditec, Dublin, CA), to eliminate subjects with axial lengths greater than 26.5 mm. These data were used to recalibrate the cone packing density for individual subjects, as described previously.7,19,20
Only the right eye of each subject was tested in this study. This research followed the tenets of the Declaration of Helsinki. Informed consent was obtained from the subjects after explanation of the nature and possible consequences of the study. The research was approved by the Institutional Review Board (IRB) of Indiana University.
Procedures
To provide information about cone packing density, we resampled the data from cone photoreceptors that were imaged in vivo at high resolution, along the horizontal and vertical meridians with the Indiana AOSLO.7,21,22 Cone packing densities then were computed across eccentricities for local regions of 50 × 50 μm with a custom Matlab program (MathWorks, Natick, MA), as described previously.7,19,20 Only cones capable of guiding light and with clear boundaries can be imaged and counted, and this is nearly every cone in the macula with the present instrumentation for subjects with relatively clear media.21,23 Cones beneath blood vessels can be more difficult to quantify due to being dim. Tear film fluctuations in older subjects led to a small amount of missing data in these large data sets. In the few cases of missing data, we interpolated between nearby image data sets. Visual inspection of the entire data set of Song et al.7 indicated that there were no patches >30 μ within clear images and not underneath blood vessels that were missing cones or lacking quantifiable cones when other retinal features were of good contrast. Thus, our interpolation provides a conservative estimate of the decrease in cone counts with aging, but the estimate if every cone were counted is likely not to be significantly lower than the averages reported here. Two subjects in each group from the 20 total contained in the previous data set7 did not have contemporaneous OCT measurements, and were omitted from these analyses.
To obtain information about the ONL, infrared fundus imaging and SDOCT imaging were performed, providing both en face fundus images and high resolution, cross-sectional measurements of the posterior pole (Spectralis OCT; Heidelberg Engineering, Heidelberg, Germany, Figs. 1–3). SDOCT images used a super luminescent diode with a wavelength of 870 nm as a light source. The axial and lateral resolution of the SDOCT is approximately 7 and 14 μm, respectively. Horizontal and vertical SDOCT scans centered at the fovea were obtained for each subject, using the manufacturer's eye tracking feature (automatic real time, ART). To reduce speckle noise, each b-scan was created by averaging 20 frames. All b-scan images were exported as “.tiff” files for further image processing, as described previously.24 We analyzed the central 15-degree data, obtained from the separate horizontal and vertical scans. Although we imaged more eccentrically with the AOLSO and the SDOCT, including 30-degree vertical scans with SDOCT, we omitted these additional conditions because the number of missing data points near the optic nerve head would have presented a statistical problem in our parametric design.
Figure 1.
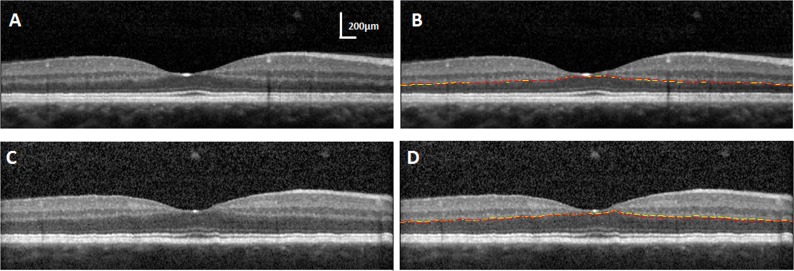
(A) A horizontal SDOCT image without segmentation lines for a young subject. (B) SDOCT segmentation for the ONL/OPL, showing the best reproducibility of manual segmentation 6 months apart. SD = 0.3 pixels for the same SDOCT image in (A). (C) A horizontal SDOCT image without segmentation lines for another young subject. (D) SDOCT segmentation for the ONL/OPL, showing the worst reproducibility of manual segmentation. SD = 2 pixels for the same SDOCT image in (C). First segmentation, yellow lines; second segmentation, red lines.
Figure 3.
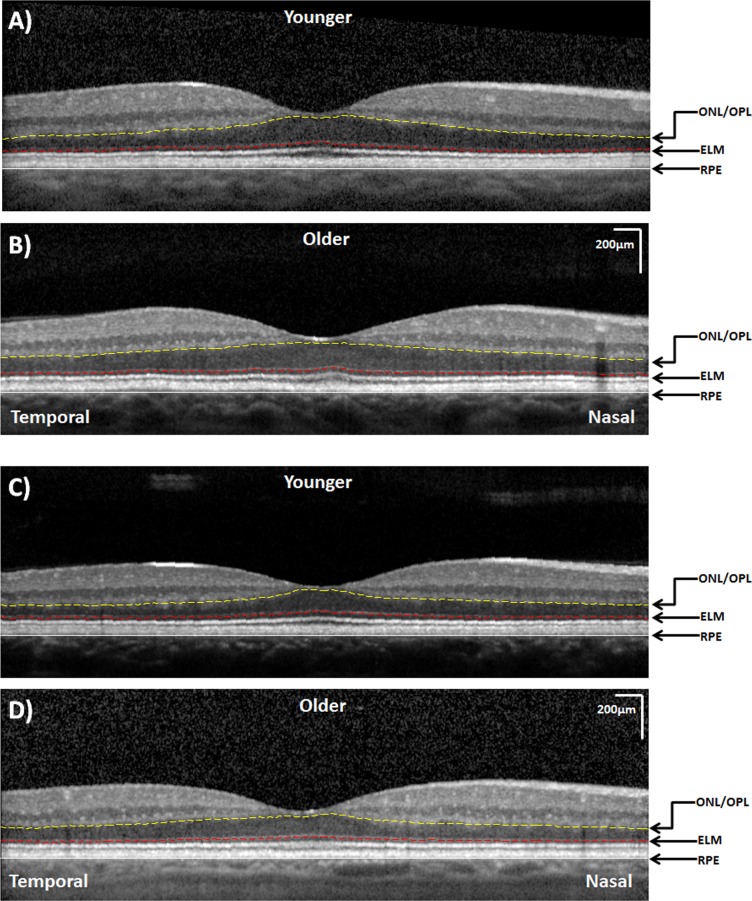
Examples of the horizontal SDOCT scans in the younger (A, C) and older (B, D) age groups. A relatively thicker ONL + HFL thickness along the temporal retina is observed in the older subjects. Both images are displayed at the same magnification.
To segment the cross-sectional images obtained from SDOCT, the posterior boundary of the RPE layer was identified manually and read into Matlab. The program then applied a polynomial algorithm to flatten the RPE layer based on individual SDOCT images by moving each pixel column vertically. Next, the external limiting membrane (ELM), and the border between the ONL and the outer plexiform layer (ONL/OPL) were traced manually on the flattened image. A spline algorithm was used to interpolate between sample points marked on the ELM and ONL/OPL separately. Thus, global thickness was measured, while the small focal changes that have a minimal effect on average thickness over a large region of macula were not analyzed.
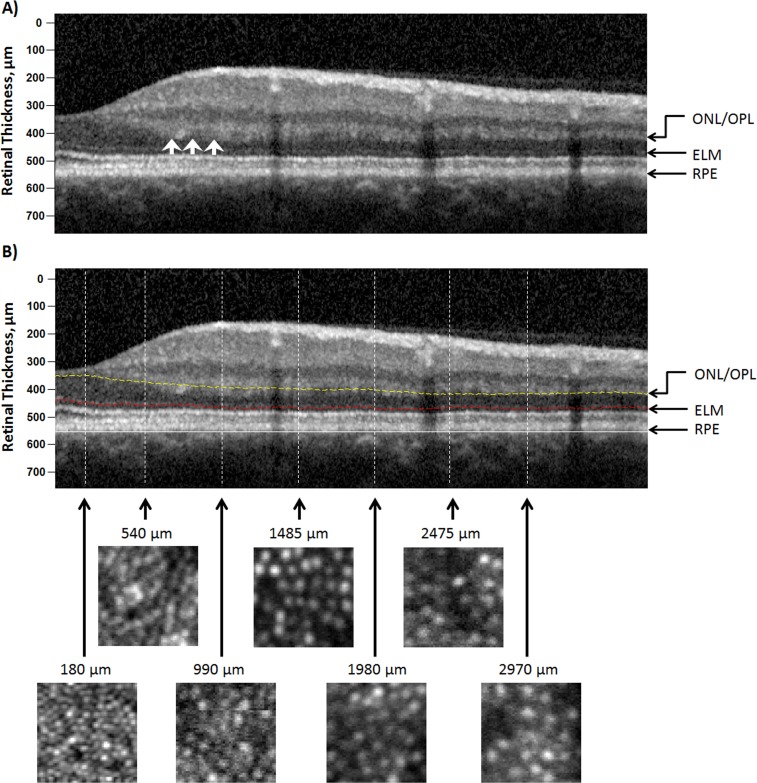
ONL + HFL thickness was defined as the distance between the light to dark change that occurs at the junction of the OPL and ONL to the bright signal attributed to the ELM, as discussed recently with histologic comparisons.15,25 We included the very subtle, lighter portions just beneath this border, when they were present, which had diminished reflectivity and that continues into the periphery across the entire scan, even though the border appeared discontinuous near to the fovea (Fig. 1). We were conservative when we defined the segmentation line. We selected the location as indicated by the yellow line (Fig. 2). First, the layer is not a well-delineated straight line; we chose the upper margin instead of the lower margin so that the HFL components were included within the ONL rather than the OPL.
Figure 2.
(A) SDOCT image, a vertical scan along the superior retina of the same subject in Figures 1A and 1B, without segmentation lines. (B) SDOCT (top) and AOSLO (bottom) images along the superior retina. On the SDOCT image, the distance between the ONL/OPL and ELM was taken as the ONL+ HFL thickness. The white arrows indicate the hyperreflectivity of HFL. The lower panel shows a series of cone photoreceptor images with a sampling window of 50 × 50 μm at the corresponding retinal eccentricities along the SDOCT scan. ONL/OPL (dashed yellow line); ELM (dashed red line); posterior boundary of the RPE (white line).
We examined reproducibility of the segmentation using the results of two segmentation sessions performed 6 months apart. We examined two aspects of this repeat segmentation. First, we performed a Bland-Altman analysis26 on the raw pixel values of the OPL to ONL boundary in horizontal scans to determine whether the pixel location on the scan influenced the reproducibility. We examined whether reproducibility was influenced by vertical position in the image, since in SDOCT the data points that fall closer to the top versus bottom of the image are in different frequency bins and, thus, have different signal-to-noise properties. There was no positive or negative slope trend with vertical position of the OPL to ONL boundary in 11 different Bland-Altman analyses, spaced left-to-right across the retinal scan, indicating no effect of vertical pixel position. Further, the standard deviations at the 11 positions, left-to-right in the scan, of the 16 measurements of Sessions 1–2 ranged from 0.7–1.43 pixels. There was no monotonic trend between the sessions for left-to-right or center-to-periphery analyses. Second, we determined whether the thicknesses from the Session 1 versus Session 2 sessions for segmentation had sufficient variability to explain the size of effects that we encountered for aging or meridian, discussed in Results. If reproducibility is poor with respect to the size of the effect of age, eccentricity, or meridian, then obtaining consistent and significant differences between age groups or meridians is unlikely due to the variability.
Near the fovea, structures of the Henle fiber are visualized in SDOCT as directly anterior to the ONL, but the HFL as opposed to the ONL can be demarcated poorly. While tilting the SDOCT image during data acquisition better delineates the unwanted HFL, nevertheless there are no results from a large sample providing repeatability or quantitative comparisons of ONL thickness.17,18 We examined each image for the eccentricity nearest to the fovea where the Henle fiber contribution to thickness is no longer visible, which was found to be ≤5 degrees for 15 of 16 subjects. This agrees with histological data.15 Thus, we separated the ONL + HFL thickness statistics into a central region, analyzing these data separately from those 5 degrees outward to 7.5 degrees.
We separated the cone packing density, as well as the ONL + HLF thickness data into an inner region of interest between 500 μ and 1.5 mm (5 degrees) eccentricity, and an outer one of 1.5 mm (5 degrees) eccentricity and outwards, corresponding to the parafoveal and perifoveal regions used in OCT macular thickness scans. This analysis emphasizes differences in topography as well as the HFL changes with eccentricity, and also separated cones in the cone-rich area from those surrounded by equal or greater number of rods. To investigate whether the thickness of the ONL changes with the lower number of cones measured in older subjects, along with the lower numbers of rods expected from histology, the ratio of the cone packing density-to-thickness2 (ONL2) was computed as a function of eccentricity. We assumed a unit area for the cone packing density, and the same unit area for the volume of cell bodies in the ONL, resulting in this ratio.
Statistical Analysis
We analyzed the cone packing density, thickness, and ratio with a 3-way ANOVA for each of the inner and outer regions of interests, for the factors of age, eccentricity, and meridian. To emphasize the horizontal versus vertical differences in the data, which were prominent in the central cones in our previous studies,7,19 we also performed a separate ANOVA for the outer and inner regions of interest. In an additional ANOVA, we treated nasal and temporal data as repeat measures for the horizontal meridian, and superior and inferior as repeat measures for the vertical meridian. To illustrate graphically the differences in horizontal versus vertical meridian for the ONL, and examine the data for non-monotonic changes with eccentricity, we performed an analysis similar to a Bland-Altman,26 using the following equation:
 |
where N = nasal, T = temporal, S = superior, and I = inferior meridian.
Results
Variations with Age, Eccentricity, and Meridian for the Outer Region of Interest
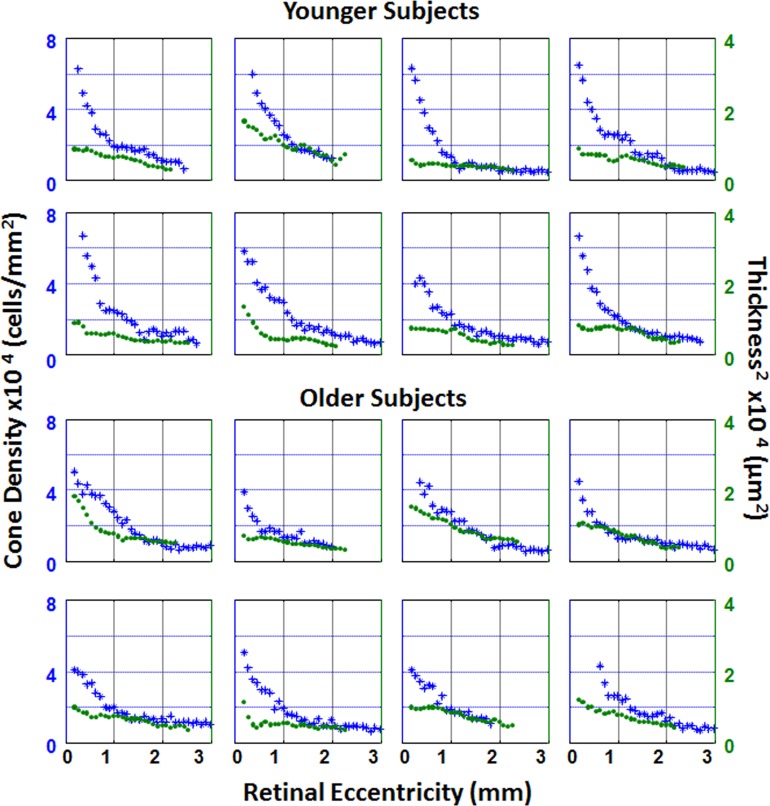
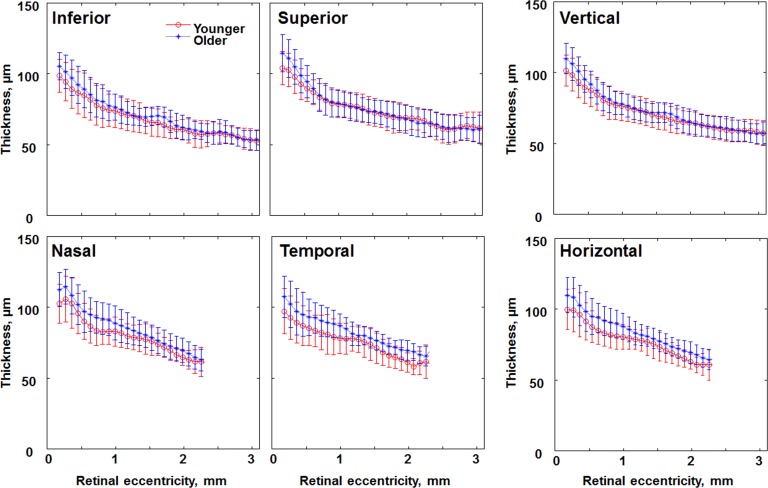
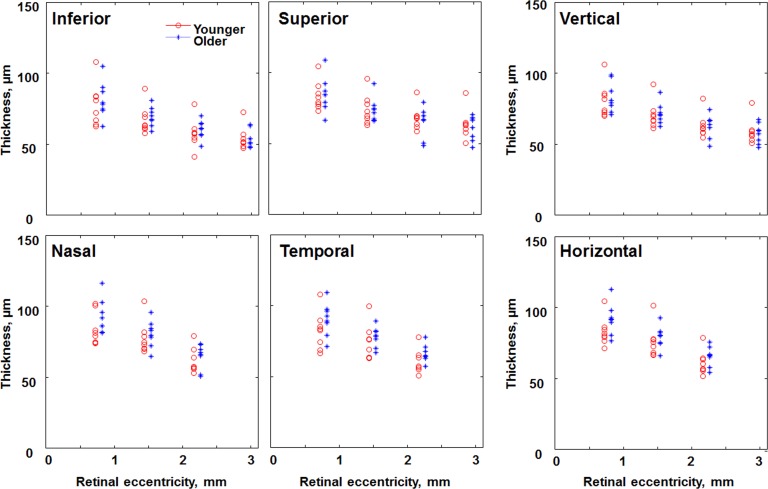
For the region of interest, there was a significant difference between the younger and older groups for cone packing density (Fig. 4) and ONL + HFL thickness (Figs. 5, 6), with older subjects having on average lower cone packing densities but larger ONL + HFL thickness (P < 0.0001 for each analysis). The summary statistic of these two measurements, the ratio of cone packing density-to-ONL2 is fairly consistent across subjects while reflecting aging trends as discussed below (Figs. 7, 8). The individual differences were sufficiently large so that the data from the two age groups overlapped. There was not significantly more variability for the older subjects for our sample for cone packing density, ONL + HFL thickness, or the ratio measure (P > 0.05).
Figure 4.
Individual plots of cone density (blue asterisks) and ONL + HFL thickness2 (green circles) as a function of retinal eccentricity along the temporal meridian. The top two rows represent plots from younger subjects. The bottom two rows represent plots from older subjects.
Figure 5.
Comparison of ONL + HFL thickness in younger (red circles) and older (blue asterisks) age groups along different retinal meridians. Data for the vertical and horizontal meridians are the average of the inferior and superior meridians, nasal and temporal meridians, respectively. Error bars represent SD.
Figure 6.
Comparison of the ONL + HFL thickness in individual subjects of the younger (red circles) and older (blue asterisks) age groups at 2.5, 5, and 7.5 degrees along different retinal meridians, plus additional 10-degree vertical data. The x coordinates for the older age group are displaced to the right for better visualization.
Figure 7.
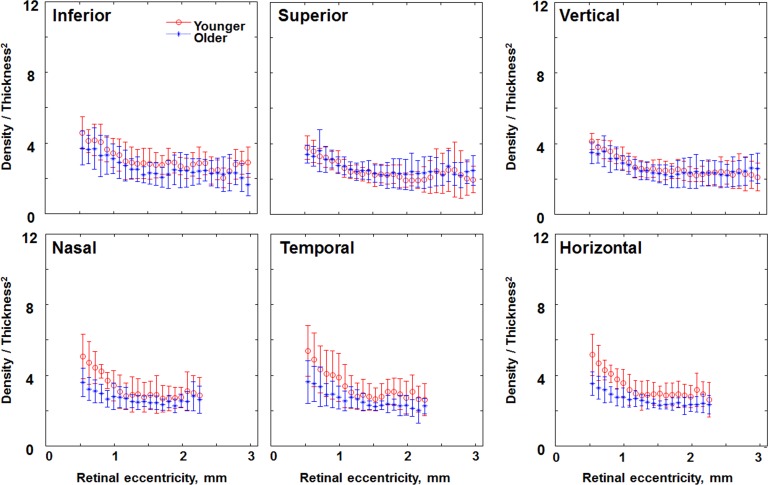
Comparison of the ratio of cone density-to-thickness2 in individual subjects of the younger (red circles) and older (blue asterisks) age groups along different retinal meridians. Data within the central 500 μm have been removed due to the lack of cone density data in some subjects. Error bars represent SD.
Figure 8.
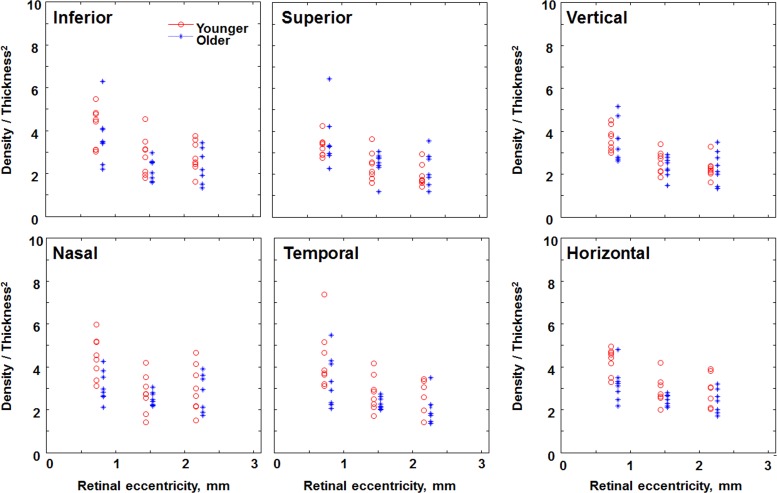
Comparison of the ratio of cone density-to-thickness2 in individual subjects of the younger (red circles) and older (blue asterisks) age groups at 2.5, 5, and 7.5 degrees along different retinal meridians. The x coordinates for the older age group are displaced to the right for better visualization.
The mean cone packing density was 13.0 × 10³ cones/mm2 and 12.5 × 10³ cones/mm2 within the outer region of interest for younger versus older subjects, respectively. The mean ONL + HFL thickness was 66.7 and 70.1 μm within the outer region of interest for younger versus older subjects, respectively. Taking into account the greater retinal area with increasing eccentricity, the average cone packing density would be lower and the average ONL + HFL thickness would be higher on average.
As expected, cone packing density decreased with increasing eccentricity (P < 0.0001, Fig. 4) and ONL + HFL thickness decreased significantly with increasing retinal eccentricity (P < 0.0001; Figs. 4, 5). At this outer region of interest, the total number of photoreceptors is not necessarily decreasing, but rather cones are decreasing while rods are increasing, so that little change in outer retina thickness with eccentricity was expected based solely on cell numbers.
As expected, cone packing density also depended upon meridian (P < 0.003), with younger subjects having an average of 16.0 × 10³ cones/mm2 in the horizontal meridian but only 12.8 × 10³ cones/mm2 in the vertical meridian, compared to 15.7 × 10³ and 12.3 × 10³ cones/mm2, respectively, in older subjects (Fig. 4). The full data set has been reported previously for each eccentricity from 0.18 to 2.16 mm in tabular form.7 The average numbers of cones along this section of the meridian, when weighted by the more eccentric areas having a larger area, is smaller than the above average across the 50 × 50 μm samples. The ANOVA with nasal and temporal data combined to contrast with inferior and superior indicated that cone packing density was higher along the horizontal meridian (P < 0.022). ONL + HFL thickness depended on meridian as well (P < 0.0001), with the greatest thickness on average in the nasal retina (74.6 μm) and thinnest in the inferior retina (66.4 μm). None of the interactions in either ANOVA reached significance, but note the appreciable individual differences in each age group, the small sample, and the potential for focal defects in aging eyes.
The ratio of the cone packing density-to-ONL2 was larger on average for the younger than for the older group, 3.08 versus 2.89, respectively (P < 0.0001; Figs. 7, 8). While there were individual differences, the range of the ratios overlapped for the younger and older subjects. The ratio decreased with increasing eccentricity (P < 0.0001), which is expected because the number of cones is decreasing while the numbers of cones + rods is not necessarily changing appreciably at this location. The ratio also differed with meridian (P < 0.041).
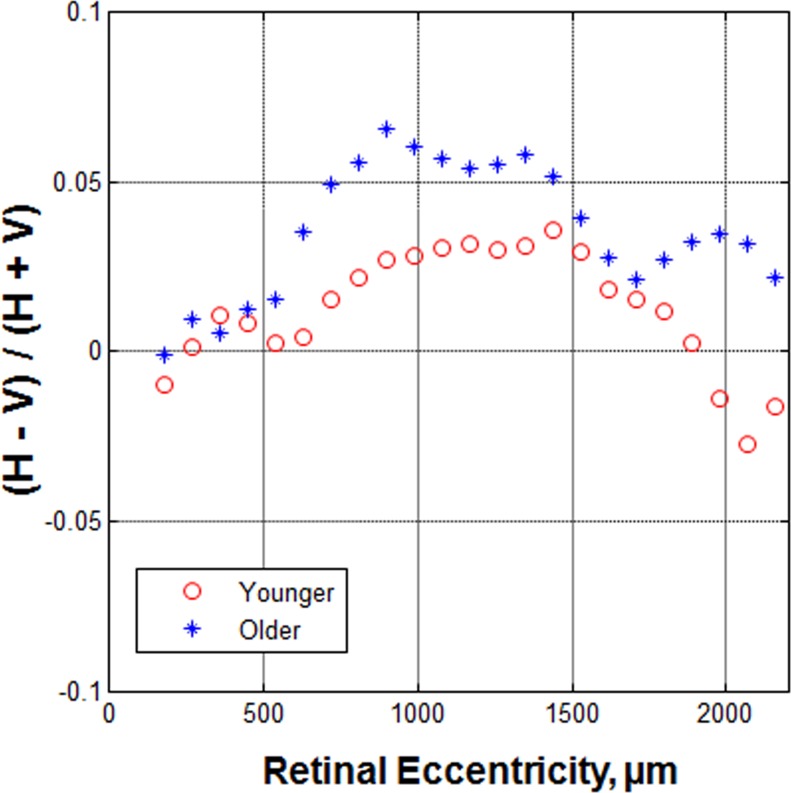
In our analysis, in which the horizontal data were contrasted against the vertical data as a function of eccentricity, similar to a Bland-Altman analysis, we found that the difference was non-monotonic with retinal eccentricity for the older group, but more systematic for the younger group (Fig. 9). This subtle change is at an eccentricity similar to the patchy loss of rods found previously by histology.8
Figure 9.
The ratio of the horizontal versus vertical difference, expressed as meridional difference to total meridional ONL + HFL thickness, as a function of retinal eccentricity. In general, the ratio is higher in the older age group beyond the eccentricity of 500 μm. A nonmonotonic change of the ratio occurs in the older age group, which is a sudden decrease near the eccentricity of 1700 μm, and then an increase.
Variations with Age, Eccentricity, and Meridian for the Inner Region of Interest
For the data nearer the fovea, the results are similar (Figs. 4–8). There were significant differences between the younger and older groups for cone packing density (Fig. 4) and ONL + HFL thickness (Figs. 5, 6), with older subjects having on average lower cone packing densities but thicker ONL + HFL (P < 0.0001 for each analysis). Again, the individual differences led to overlap of the data for the two age groups. The mean cone packing densities were 43.9, 25.7, and 13.7 × 10³ cones/mm2 at 1.2, 2.1, and 4.5 degrees retinal eccentricity, respectively. The mean ONL + HFL thicknesses were 98.4, 84.6, and 74.3 μm at 1.2, 2.1, and 4.5 degrees retinal eccentricity, respectively, and include a significant contribution from the HFL thickness.
As expected, cone packing density decreased with increasing eccentricity (P < 0.0001; Figs. 1, 3, 4). ONL + HFL thickness, which includes the Henle fibers and supporting structures, such as portions of the Muller cells, decreased significantly with increasing retinal eccentricity (P < 0.026; Figs. 4, 5). At this more central retinal location, the number of cone photoreceptors decreases rapidly with eccentricity. This decrease is greater in the younger subjects, who have higher foveal cone densities than the older subjects, so there is a significant interaction of age and eccentricity for cone packing density (P < 0.0001). The topographic mapping demonstrates the differences in cone packing density and ONL + HFL thickness between the two age groups, including the steeper fall-off and meridional differences for cone packing density of the younger subjects in the central region but higher values and smaller meridional differences for ONL + HFL thickness for the older subjects. The finding of fewer cones in the center for older subjects along with a different distribution of cones and their axons for the two age groups is in agreement with previous studies exploring cone density, cone photopigment, macular pigment, and foveal birefringence.3,4
Cone packing density also depended upon meridian (P < 0.001) as expected from the data set of Song et al.7 The ANOVA with nasal and temporal combined to contrast with inferior and superior indicated that cone packing density was higher along the horizontal meridian (P < 0.001). Younger subjects had an average over all samples of 27.1 × 10³ cones/mm2 in the horizontal meridian, but 22.9 × 10³ cones/mm2 in the vertical meridian, while older subjects had 23.5 × 10³ cones/mm2 in the horizontal meridian but only 20.8 × 10³ cones/mm2 in the vertical meridian (Fig. 4). This asymmetry is so great that older subjects had greater numbers of cones on average in the horizontal meridian than younger subjects had in the vertical meridian. Note that the actual average cone density across these regions of rapid decrease is lower than the average of the samples, since the more eccentric samples with lower values represent relatively larger regions.
ONL + HFL thickness depended on meridian as well (P < 0.005), with the ONL + HFL thickest on average in the nasal retina (88.1 μm) and thinnest in the inferior retina (78.1 μm). None of the interaction analyses for ONL + HFL reached significance.
The ratio of the cone packing density-to-ONL2 was larger on average for the younger than for the older group 3.75 vs. 3.01 (P < 0.0001; Figs. 7, 8). As with more eccentric locations, the range of the ratios overlapped for the younger and older subjects (Fig. 7), however to a lesser degree. The ratio did not decrease significantly with increasing eccentricity (P < 0.08). The ratio, however, differed with meridian (P < 0.028). For older subjects the ratio of cone packing density-to-ONL2 was 2.96 for the vertical and 3.06 for the horizontal meridians, compared to 3.48 and 4.01, respectively, for younger subjects. The HFL accounts for appreciable amounts of ONL + HFL thickness in this central region, yet nevertheless the central and more peripheral regions had similar ONL + HFL thicknesses for younger compared to older subjects.
A comparison of Figures 4 and 9 illustrates that younger subjects have cone density peaked near the fovea and density dropped off rapidly, but more rapidly for the vertical meridian than the horizontal. Surprisingly, the horizontal versus vertical contrast of the ONL + HFL thickness (Fig. 9) indicates a fairly radially symmetric ONL despite the asymmetry of the cone packing density. The data for older subjects show a different pattern, in that there is a lower peak of cone packing density near the fovea and there still is some asymmetry for horizontal versus vertical meridian. Again, the horizontal versus vertical contrast of the ONL + HFL thickness indicates fairly symmetric data.
The previously reported cone packing data and reproducibility measurements indicate that age, meridian, and eccentricity vary across individuals, but that there is considerable variation within an age group and overlap across younger versus older age groups.7 The reproducibility data for the ONL + HFL thickness indicate that the pixel-to-pixel variation is not likely an important factor, although the criterion used for segmentation has some impact on the size of trends in the data. For the inner macular region, there was no significant difference in the ONL + HFL thickness for Sessions 1–2 measurements (P = 0.485), while there were significant effects of age and eccentricity (P = 0.001, 0.003, respectively). Since we limited the reproducibility analysis to horizontal measurements, there was less statistical power, and also no analysis for horizontal versus vertical meridian. For the outer macular region, there was no significant difference in the ONL + HFL thickness for Sessions 1–2 measurements (P = 0.660). The effect of age was not large enough to overcome the loss of the contribution from the thinnest meridian (inferior) and the decrease in statistical power (P = 0.055). ONL + HFL thickness was varied significantly with eccentricity, and there was an interaction of age and eccentricity (P = 0.002 and 0.012, respectively). The individual variations within each age group were large. Failing to control for eccentricity or meridian could result in the lack of an effect of age. The reproducibility data supported our finding that the thickened ONL + HFL with age is not due to segmentation errors, since these were small relative to the effect.
Discussion
The lower cone packing densities in older eyes found for regions near (inner region of interest) and more peripheral (outer region of interest) to the fovea indicate the potential for cone damage with aging, whether the cones are long, narrow, and near the fovea, or shorter, wider, and nearer to retinal capillaries. Similarly, cones in the cone-rich inner area and the rod-rich outer area were fewer in number in the older eyes. This finding, along with individual differences across subjects, indicated that careful comparison to a normative group is necessary for studies of early detection of damage to the cones or for measuring treatment effects. Our ONL + HFL data, as seen for older subjects in Figure 9, also indicated the potential for focal or regional variations, in agreement with histologic findings that show patchy losses of photoreceptors, including rods when outside the foveal center.8 Such patchy losses might be undetectable in particular samples given that there are individual differences within younger and older subject groups, and that changes within the older group can be subtle.
Subtle increases in cones numbers due to disease or increases due to treatment, or changes to the ONL, may be detectible more readily when regional variations within eyes are understood better. The differences in cone packing density and ONL + HFL thickness according to meridian further underscored the need for understanding variations within an eye. Individual differences in the thickness of the ONL + HFL for several older subjects with healthy eyes were seen readily on visual inspection. Given that the numbers of functioning cones decreased, if the ONL + HFL thickness were a sensitive marker for decreased cones, then it would have decreased correspondingly with age. While cones visualized with AOSLO were seen only if they guided light back to the instrument, we did not observe large patches of missing cones. Instead, there were fewer cones on average for older subjects. While the ONL + HFL thickness near the fovea was augmented by Henle fibers, the thickness parameters might be expected to remain constant per cone cell body + cone axon + supporting Müller cell with aging. Thus, another explanation is needed for why the ONL + HFL thickness increased with age rather than decreased in proportion to the decrease in cones.
The increase in ONL + HFL in older eyes is unlikely to be due to the addition of cone cell bodies or their axons. Using AOSLO, we found fewer functioning cones, on average, in the older eyes. The foveal remodeling seen in previous studies with an outward shift of cone photopigment, macular pigment, and birefringence of the HFL,3,4 is more central than our outer region of interest, which began at 5 degrees. Yet most of the trends in the data are similar for the central and more peripheral areas. An increase in rod cell bodies to the ONL is unlikely to be contributing to the increased ONL + HFL thickness in older subjects, since rods decrease with age even more than cones.8,9 A greater thickness of the ONL + HFL has been reported near the fovea due to the increased thickness of the aging HFL.15 In addition to the hypothesis that thickness in aging can be due to the hypertrophy of Müller cells, we add the potential for additional forms of gliosis and retinal remodeling leading to the small but significant increases in the ONL + HFL thickness found in our older subjects. Several types of changes to photoreceptors and neighboring tissues have been demonstrated recently with SDOCT on a sub-cellular level.27–29 While the sprouting of neurites may be related to a significant decrease of photoreceptors in retinal degenerations, the increase of the ONL + HFL thickness also could be related to the age-related sprouting of bipolar or horizontal cells.30–32 The ONL is not of uniform reflectivity on OCT, with variations also occurring outside the foveal region where a signal from the Henle fibers can be obtained when there is misalignment of the eye to the device (Figs. 1−3).17,18 A global ONL + HFL thickness measure, while providing useful quantification concerning individual differences and large changes that occur in retinal degenerations, does not demonstrate clearly the small losses of photoreceptors in aging.
Footnotes
Supported by NIH Grants EY007624, EB002346, EY04395, EY014375, and Vision Science Core Grant P30EY019008.
Disclosure: T.Y.P. Chui, None; H. Song, None; C.A. Clark, None; J.A. Papay, None; S.A. Burns, None; A.E. Elsner, None
References
- 1.Eisner A, Fleming SA, Klein ML, Mauldin WM. Sensitivities in older eyes with good acuity: cross-sectional norms. Invest Ophthalmol Vis Sci. 1987;28:1824–1831 [PubMed] [Google Scholar]
- 2.Elsner AE, Berk L, Burns SA, Rosenberg PR. Aging and human cone photopigments. J Opt Soc Am A. 1988;5:2106–2112 [DOI] [PubMed] [Google Scholar]
- 3.VanNasdale DA, Elsner AE, Hobbs T, Burns SA. Foveal phase retardation changes associated with normal aging. Vision Res. 2011;51:2263–2272 [DOI] [PMC free article] [PubMed] [Google Scholar]
- 4.Elsner AE, Burns SA, Beausencourt E, Weiter JJ. Foveal cone photopigment distribution: small alterations associated with macular pigment distribution. Invest Ophthalmol Vis Sci. 1998;39:2394–2404 [PubMed] [Google Scholar]
- 5.Swanson WH, Fish GE. Age-related changes in the color-match-area effect. Vision Res. 1996;36:2079–2085 [DOI] [PubMed] [Google Scholar]
- 6.Keunen JE, van Norren D, van Meel GJ. Density of foveal cone pigments at older age. Invest Ophthalmol Vis Sci. 1987;28:985–991 [PubMed] [Google Scholar]
- 7.Song H, Chui YT, Zhong Z, Elsner AE, Burns SA. Variation of cone photoreceptor packing density with retinal eccentricity and age. Invest Ophthalmol Vis Sci. 2011;52:7376–7384 [DOI] [PMC free article] [PubMed] [Google Scholar]
- 8.Curcio CA, Millican CL, Allen KA, Kalina RE. Aging of the human photoreceptor mosaic: evidence for selective vulnerability of rods in central retina. Invest Ophthalmol Vis Sci. 1993;34:3278–3296 [PubMed] [Google Scholar]
- 9.Panda-Jonas S, Jonas JB, Jakobczyk-Zmija M. Retinal photoreceptor density decreases with age. Ophthalmology. 1995;102:1853–1859 [DOI] [PubMed] [Google Scholar]
- 10.Jelcick AS, Yuan Y, Leehy BD, et al. Genetic variations strongly influence phenotypic outcome in the mouse retina. PLoS One. 2011;6:e21858 [DOI] [PMC free article] [PubMed] [Google Scholar]
- 11.Whitney IE, Raven MA, Lu L, Williams RW, Reese BE. A. QTL on chromosome 10 modulates cone photoreceptor number in the mouse retina. Invest Ophthalmol Vis Sci. 2011;52:3228–3236 [DOI] [PMC free article] [PubMed] [Google Scholar]
- 12.Danciger M, Ogando D, Yang H, et al. Genetic modifiers of retinal degeneration in the rd3 mouse. Invest Ophthalmol Vis Sci. 2008;49:2863–2869 [DOI] [PMC free article] [PubMed] [Google Scholar]
- 13.Huang Y, Cideciyan AV, Papastergiou GI, et al. Relation of optical coherence tomography to microanatomy in normal and rd chickens. Invest Ophthalmol Vis Sci. 1998;39:2405–2416 [PubMed] [Google Scholar]
- 14.Aleman TS, Cideciyan AV, Sumaroka A, et al. Retinal laminar architecture in human retinitis pigmentosa caused by Rhodopsin gene mutations. Invest Ophthalmol Vis Sci. 2008;49:1580–1590 [DOI] [PMC free article] [PubMed] [Google Scholar]
- 15.Curcio CA, Messinger JD, Sloan KR, Mitra A, McGwin G, Spaide RF. Human chorioretinal layer thicknesses measured in macula-wide, high-resolution histologic sections. Invest Ophthalmol Vis Sci. 2011;52:3943–3954 [DOI] [PMC free article] [PubMed] [Google Scholar]
- 16.Drasdo N, Millican CL, Katholi CR, Curcio CA. The length of Henle fibers in the human retina and a model of ganglion receptive field density in the visual field. Vision Res. 2007;47:2901–2911 [DOI] [PMC free article] [PubMed] [Google Scholar]
- 17.Lujan BJ, Roorda A, Knighton RW, Carroll J. Revealing Henle's fiber layer using spectral domain optical coherence tomography. Invest Ophthalmol Vis Sci. 2011;52:1486–1492 [DOI] [PMC free article] [PubMed] [Google Scholar]
- 18.Otani T, Yamaguchi Y, Kishi S. Improved visualization of Henle fiber layer by changing the measurement beam angle on optical coherence tomography. Retina. 2011;31:497–501 [DOI] [PubMed] [Google Scholar]
- 19.Chui TY, Song H, Burns SA. Adaptive-optics imaging of human cone photoreceptor distribution. J Opt Soc Am A Opt Image Sci Vis. 2008;25:3021–3029 [DOI] [PMC free article] [PubMed] [Google Scholar]
- 20.Chui TY, Song H, Burns SA. Individual variations in human cone photoreceptor packing density: variations with refractive error. Invest Ophthalmol Vis Sci. 2008;49:4679–4687 [DOI] [PMC free article] [PubMed] [Google Scholar]
- 21.Burns SA, Tumbar R, Elsner AE, Ferguson D, Hammer DX. Large-field-of-view, modular, stabilized, adaptive-optics-based scanning laser ophthalmoscope. J Opt Soc Am A Opt Image Sci Vis. 2007;24:1313–1326 [DOI] [PMC free article] [PubMed] [Google Scholar]
- 22.Ferguson RD, Zhong Z, Hammer DX, et al. Adaptive optics scanning laser ophthalmoscope with integrated wide-field retinal imaging and tracking. J Opt Soc Am A Opt Image Sci Vis. 2010;27:A265–A277 [DOI] [PMC free article] [PubMed] [Google Scholar]
- 23.Zou W, Qi X, Burns SA. Woofer-tweeter adaptive optics scanning laser ophthalmoscopic imaging based on Lagrange-multiplier damped least-squares algorithm. Biomed Opt Express. 2011;2:1986–2004 [DOI] [PMC free article] [PubMed] [Google Scholar]
- 24.Chui TY, Zhong Z, Burns SA. The relationship between peripapillary crescent and axial length: implications for differential eye growth. Vision Res. 2011;51:2132–2138 [DOI] [PMC free article] [PubMed] [Google Scholar]
- 25.Spaide RF, Curcio CA. Anatomical correlates to the bands seen in the outer retina by optical coherence tomography: literature review and model. Retina. 2011;31:1609–1619 [DOI] [PMC free article] [PubMed] [Google Scholar]
- 26.Bland JM, Altman DG. Statistical methods for assessing agreement between two methods of clinical measurement. Lancet. 1986;1:307–310 [PubMed] [Google Scholar]
- 27.Gomez ML, Mojana F, Bartsch DU, Freeman WR. Imaging of long-term retinal damage after resolved cotton wool spots. Ophthalmology. 2009;116:2407–2414 [DOI] [PMC free article] [PubMed] [Google Scholar]
- 28.Framme C, Wolf S, Wolf-Schnurrbusch U. Small dense particles in the retina observable by spectral-domain optical coherence tomography in age-related macular degeneration. Invest Ophthalmol Vis Sci. 2010;51:5965–5969 [DOI] [PubMed] [Google Scholar]
- 29.Zweifel SA, Engelbert M, Laud K, Margolis R, Spaide RF, Freund KB. Outer retinal tubulation: a novel optical coherence tomography finding. Arch Ophthalmol. 2009;127:1596–1602 [DOI] [PubMed] [Google Scholar]
- 30.Jones BW, Watt CB, Frederick JM, et al. Retinal remodeling triggered by photoreceptor degenerations. J Comp Neurol. 2003;464:1–16 [DOI] [PubMed] [Google Scholar]
- 31.Terzibasi E, Calamusa M, Novelli E, Domenici L, Strettoi E, Cellerino A. Age-dependent remodelling of retinal circuitry. Neurobiol Aging. 2009;30:819–828 [DOI] [PubMed] [Google Scholar]
- 32.Li ZY, Kljavin IJ, Milam AH. Rod photoreceptor neurite sprouting in retinitis pigmentosa. J Neurosci. 1995;15:5429–5438 [DOI] [PMC free article] [PubMed] [Google Scholar]


