

Superficially, many angiosperm leaves appear bilaterally symmetric. However, is there a systematic source of asymmetry in leaves? This work describes left-right asymmetries in tomato and Arabidopsis thaliana leaves that are dependent on phyllotactic direction. Using modeling and empirical results, the authors infer such asymmetry arises via biased auxin distribution in leaf primordia.
Abstract
In a majority of species, leaf development is thought to proceed in a bilaterally symmetric fashion without systematic asymmetries. This is despite the left and right sides of an initiating primordium occupying niches that differ in their distance from sinks and sources of auxin. Here, we revisit an existing model of auxin transport sufficient to recreate spiral phyllotactic patterns and find previously overlooked asymmetries between auxin distribution and the centers of leaf primordia. We show that it is the direction of the phyllotactic spiral that determines the side of the leaf these asymmetries fall on. We empirically confirm the presence of an asymmetric auxin response using a DR5 reporter and observe morphological asymmetries in young leaf primordia. Notably, these morphological asymmetries persist in mature leaves, and we observe left-right asymmetries in the superficially bilaterally symmetric leaves of tomato (Solanum lycopersicum) and Arabidopsis thaliana that are consistent with modeled predictions. We further demonstrate that auxin application to a single side of a leaf primordium is sufficient to recapitulate the asymmetries we observe. Our results provide a framework to study a previously overlooked developmental axis and provide insights into the developmental constraints imposed upon leaf morphology by auxin-dependent phyllotactic patterning.
INTRODUCTION
Plant organs initiate in a number of different patterns, such as spiral, alternate, whorled, or in opposite pairs (Kuhlemeier, 2007). The first of these patterns has attracted much interest over the years, particularly with respect to how such arrangements are achieved mechanistically. To this end, computer modeling has been leveraged to incorporate current theory on the roles of the plant growth hormone auxin and its efflux carrier PIN-FORMED1 (PIN1) in phyllotaxis (Reinhardt et al., 2003; Smith et al., 2006; Jönsson et al., 2006). In these models, auxin gradients are formed by PIN1 proteins, which are thought to orient toward neighbor cells with higher auxin concentration. This causes a feedback effect of auxin on its own transport (Smith and Bayer, 2009) and creates a spacing mechanism forming peaks of auxin that trigger organ initiation. Computer models using these hypotheses have been shown to recreate spiral organ initiation and the golden angle associated with the Fibonacci sequence. While such studies have been instrumental in furthering our knowledge of pattern formation at the shoot apex, one factor that has been overlooked is the distribution of auxin on the different sides of a primordium. In the case of spiral phyllotaxis, the first primordium (P1) may be affected by the next auxin maximum that will ultimately give rise to another primordium. As the new maximum grows in size, its sink effect is reduced, and we might therefore expect that, instead of a homogenous distribution across P1, the P1 auxin peak is shifted away from the newly forming auxin peak. This would cause the concentration of auxin to be diminished on the side of the P1 closest to the incipient primordium and affect the bilateral symmetry of the leaf.
Despite the possibility of such an asymmetry across the left-right axis of initiating leaf primordia, observed bilateral asymmetries in mature angiosperm leaves are rare. Stochastic asymmetries are quite common, but there are few instances of described systematic asymmetry. Instead, the majority of spirally arranged species appear, superficially, to be bilaterally symmetric. To critically assess the assumption of auxin asymmetry in leaves, we revisit models of auxin transport sufficient to recapitulate spiral phyllotaxis. We find evidence for asymmetries between auxin distribution and the center of leaf primordia. In planta, a DR5 reporter verifies modeled asymmetries relative to the direction of the phyllotactic spiral in developing leaves. Although tomato (Solanum lycopersicum) leaves appear to have no systematic bilateral asymmetry, we demonstrate that in both young primordia and mature leaves, left-right asymmetry is apparent, reflecting the influence of the auxin asymmetries we observe during early development. This phenomenon is not unique to compound leaved species as we see similar asymmetries in mature Arabidopsis thaliana leaves. This suggests that in many species, across the core eudicots, seemingly bilaterally symmetric leaves may in fact possess asymmetries due to the differing auxin concentrations on each side of a primordium. Finally, we demonstrate the sufficiency of auxin to induce the leaf asymmetries that we observe through auxin application experiments. Together, our results provide insights into inherent constraints imposed upon leaf development by auxin-dependent phyllotactic patterning and present a mechanism by which leaves acquire left-right asymmetries.
RESULTS
Spiral Phyllotaxy Models Show Asymmetric Auxin Distribution in Organ Primordia
To determine if auxin asymmetry is an inherent outcome of the self-organizing properties of transport within the shoot apical meristem (SAM), we revisited the Smith et al. (2006) model of phyllotaxis (Figure 1A). In this model, auxin transport is simulated on a growing cellular mesh that represents the shoot apex. Auxin moves from cell to cell by the action of its exporter protein PIN1, which orients toward neighboring cells with higher concentration. This causes auxin to accumulate at convergence points in the peripheral zone, and when a pair of cells reaches a threshold concentration, they differentiate into a new primordium that grows out from the apex surface. As the simulation proceeds, the spacing mechanism causes new primordia to appear as far as possible from preexisting ones, resulting in spiral phyllotaxis. The radial position of a primordium is determined from the center of the pair of cells that triggered differentiation and does not change after initiation. We define a value called the indole-3-acetic acid (IAA) shift as the angular distance of the center of an auxin peak within a primordium relative to the primordium center. The IAA shift is positive if the auxin peak falls clockwise of the primordium center and negative if it falls counterclockwise. Since primordia initiate at the center of an auxin convergence point, the primordium center and the auxin peak center are initially very close and the IAA shift is almost zero. However, as the simulation proceeds, convergence points can influence each other through the auxin spacing mechanism, creating non-zero IAA shift values.
Figure 1.

An Auxin Transport Model Predicts Left-Right Auxin Asymmetries.
(A) Screen capture of an auxin transport simulation that recapitulates phyllotactic patterning. Shown are the centers of mass (white lines) and auxin concentration (green lines) of leaf primordia. Primordium cells are highlighted in blue to demonstrate the symmetrical recruitment of cells into the leaf.
(B) There is a significant negative correlation between divergence angle and IAA shift in both C and CC phyllotaxis. The result of such a correlation is that when divergence angles are high, the auxin concentration rests at a more negative angle, and vice versa.
(C) Visualization of the trends in divergence angles and IAA shifts throughout primordium development in C and CC simulations. Note that as primordia develop, they attain extremely negative (C) or positive (CC) values such that auxin falls on the descending side of the primordium. Starting at P3 (indicated with asterisks), IAA shift values become significantly shifted toward the descending direction (see text for significance values).
(D) A DR5 auxin reporter confirms modeled predictions that auxin response is asymmetrically distributed toward the descending side of leaf primordia. (1) Surface reconstructions from a propidium iodide confocal stack. Coloring is based upon surface Gaussian curvature where highly curved domes appear red and creases appear blue. (2) Confocal data showing propidium iodide (cell wall stain) and DR5:VENUSx6 signal (yellow). (3) Total DR5:VENUSx6 signal projected upon surface reconstruction and intensity of DR5 signal indicated by color, where red meristem background indicates no signal. From top to bottom, increasingly older stages of P1 leaf primordia up to P2 are shown. Lines drawn from the tip of the P1 primordium to the center of the meristem indicate the center of the primordium. The descending side of the primordium is indicated to show the excess distribution of auxin response, predominately at the primordium base.
It should be noted that as different naming schemes for the direction of phyllotactic spiral are used, here, we define direction by ascending the phyllotactic spiral from older to younger leaves. Consequently, we describe spirals as being either clockwise (C) or counterclockwise (CC), looking from the top of the vegetative apex. Relative to the spiral, we call the side of the leaf facing younger leaves “ascending” and the opposite side facing older leaves “descending.” This terminology therefore defines the directionality of the left and right sides of a leaf relative to the phyllotactic spiral and is a simplification of various conventions from the past, including “anadromic/catadromic” and “dextrorse/sinistrorse” (Macloskie, 1895; Raunkiaer, 1919; Dormer, 1972; Korn, 2006).
The divergence angle is defined as the angle between the next oldest primordium and the primordium of interest. We find a highly significant correlation between the divergence angle of a primordium and its IAA shift (Figure 1B). In addition, there is an extremely strong trend for IAA shift values to become negative as a primordium develops in C phyllotaxis, while in CC phyllotaxis, IAA shift values become increasingly positive (Figure 1C). The IAA shift values are more positive in CC phyllotaxis and negative in C phyllotaxis in a way that is independent of the relationship we observe between IAA shift and divergence angle (Figure 1B), suggesting that these are separate phenomena. This progressive trend corresponds to increased auxin concentration on the descending side of the primordium (toward the next oldest primordium). IAA shift values are significantly displaced toward the descending side of primordia as they further develop, and this trend becomes highly significant in subsequent older primordia (P < 2.2 × 10⁻¹⁶ for P4-5, both phyllotactic directions, indicated by asterisks in Figure 1C). Thus, the model predicts higher auxin concentrations on the descending side of primordia. Although the model can create spiral phyllotaxis under a wide variety of parameters, the direction and magnitude of IAA shift values are qualitatively similar, provided a stable spiral pattern is maintained.
Auxin Response Is Asymmetrically Distributed in Leaf Primordia
To test if auxin is indeed asymmetrically distributed across the left-right axis as predicted by the model, we imaged a DR5:VENUSx6 auxin reporter in tomato (n = 15) (Shani et al., 2010). A Gaussian curvature map of the SAM was used as an aid to identify the tip of young primordia and the meristem center (Figure 1D). Subsequently, a line connecting these two points was juxtaposed upon DR5 signal corresponding to approximately three cell layers from the surface, either over propidium iodide images or DR5 intensity maps projected onto surface reconstructions. By comparing reporter signal relative to the center of mass of increasingly older P1 leaf primordia, it becomes apparent that auxin response is asymmetrically distributed at the base of primordia, toward the descending side. This is especially true within the saddle-like region that defines the boundary of the basal end of the P1 leaf primordium with the rest of the SAM. As tomato leaves develop basipetally, the proximal region of the primordium near the saddle region disproportionately influences the development of the resulting leaf. In later P1 and P2 developmental stages, the bias of auxin response toward the descending side of the leaf is still present at the base of the primordium. By the P3 stage of development, when leaflet protrusions are visible, leaflets and terminal leaflet shape has already been patterned. Thus, it is before the P3 stage and at the base of the primordium that the auxin asymmetries we observe are most developmentally relevant.
Leaf Primordia Exhibit Asymmetric Morphology
The asymmetry in auxin response we observe in leaf primordia may have no functional consequences; alternatively, tomato leaves may in fact exhibit left-right asymmetry. To test whether asymmetries could be observed early in leaf development, we registered image stacks of serial sections of tomato SAMs (Figures 2A to 2D). We focused our analysis on P2, as previous data suggested that patterning of the proximal-distal axis in tomato by auxin occurs around this developmental stage (Koenig et al., 2009). The auxin asymmetries we infer (Figure 1) occur at either this stage or earlier. Whereas the tip of the SAM remains centered (Figures 2A to 2D, meristem denoted “M”) most P2 lunge, or shift the distribution of their mass, toward the ascending direction (toward P1) as one tracks sections in a proximal-to-distal fashion. We counted the proportion of primordia that lunge in each direction and found a highly significant overabundance of P2 that shift their distribution of mass in an ascending direction, toward P1 (Figure 2E, P = 4.9 × 10⁻⁴). This demonstrates that asymmetry along the ascending/descending axis is manifest from the earliest stages of leaf development (Figure 2). This is concomitant with the patterning of the proximal-distal axis by auxin (Koenig et al., 2009) and at a developmental stage consistent with the asymmetries predicted by modeling (Figure 1). The tendency of primordia to bend toward the ascending direction is consistent with modeled auxin distributions and observed DR5 activity, which are biased toward the descending side of primordia. A majority of the proximal-distal axis at this stage of primordium development is destined to become the terminal leaflet, for which we describe morphological asymmetries in the next section.
Figure 2.

Left-Right Asymmetry Manifests Early in Leaf Development.
(A) and (B) Serial sections through the SAM in which the P2 center of mass is displaced in an ascending (A) or descending (B) direction. Superimposed micrographs are denoted as proximal (green), middle (cyan), and distal (black) relative to P2. M, meristem.
(C) and (D) Same images as in (A) and (B), respectively, except zoomed in and annotation removed to better visualize displacement of the P2.
(C) Of the 34 SAMs analyzed in this manner, there was no significant deviation from a 1:1 ratio of phyllotactic directions. However, P2 was significantly biased to shift in an ascending direction, assuming equal probability of ascending and descending shifts.
Primordia Asymmetries Persist in Mature Tomato and Arabidopsis Leaves
Although mature tomato leaves do exhibit left-right asymmetries, these asymmetries are assumed to be stochastic and were not described as showing any systematic bias. This could arise if auxin and morphological asymmetries we observe in the SAM relative to phyllotactic direction were compensated for during secondary development.
We critically evaluated the assumption that mature tomato leaves show no consistent left-right asymmetry by analyzing leaflet position in relation to phyllotactic direction in ∼400 plants. We measured (1) the distance on the left and right sides of leaf 3 from the base of the terminal blade to the most distal primary leaflet and (2) from the base of the petiole to the most proximal primary leaflet (as defined in Figure 3A). The difference in these lengths between the left and right sides of the leaf (denoted LD – RD for distal measurements, and LP – RP for proximal measurements) were compared between C and CC plants (Figure 3B). For both L – R length differences, there was a highly significant difference between C and CC plants, such that the positioning of lateral leaflets is essentially mirrored between C and CC plants (Wilcoxon rank-sum, P < 2.2 × 10⁻¹⁶ for distal and proximal comparisons). The shifts between leaflets result in a distal positioning of descending lateral leaflets relative to ascending (as diagrammed in Figure 3A and shown in Figure 3F).
Figure 3.

Asymmetries in Lateral Leaflet Position and Terminal Leaflet Shape between the Ascending and Descending Sides of Compound Leaves.
(A) Diagrammatic leaves depicting exaggerated positions of lateral leaflets arising from plants with C (orange) and CC (black) spiral phyllotaxis. Ascending (Asc.) and descending (Des.) sides are also depicted. “L” and “R” on the distal ([Dist.] LD and RD) and proximal sides ([Prox.] LP and RP) of the leaves depict the lengths measured to analyze shifts in lateral leaflet positioning.
(B) Differences in positioning of lateral leaflets between the left and right sides of leaf (Lf.) 3 in C and CC plants. Note that inverse shifts in lateral leaflet positioning occur between populations with different phyllotactic directions. These data suggest that both distal and proximal leaflets are shifted in the distal direction on the descending side relative to the ascending side of a leaf.
(C) Juxtaposed averaged terminal leaflets of leaves 3 and 4 from C and CC plants. In all cases, the lobe of the descending side of the leaf is placed more distally than the lobe on the ascending side. There is also a curvature to the leaflets, such that the very tip of the leaflet points in the ascending direction. The descending side of leaflets arising from C (orange) and CC (black) plants is indicated by appropriately colored text.
(D) PCs describing asymmetric shape variation that significantly differs by phyllotactic direction. Note that PCs 1 and 2 differ in the distinctness of left and right lobes but that lower PC1 and 2 values describe asymmetric variation relating to more distal left lobes, whereas high PC1 and 2 values explain variation relating to more distal right lobes.
(E) Box plots of PC1 and 2 values by leaf number. Asymmetric shape variance is higher in leaves 1 and 2 relative to leaves 3 and 4, but leaves 3 and 4 PC1 and 2 values significantly differ with respect to phyllotactic chirality (Wilcoxon rank-sum test).
(F) Silhouettes of the rachis and lateral leaflets of leaves arising from C and CC plants exhibiting the characteristic shift in leaflet placement (arrows).
(G) Outlines of terminal leaflets from leaves arising from C and CC plants with characteristic distal shifts in lobe positioning (arrows).
The asymmetries we see along the rachis of the leaf even extend into the terminal leaflet and affect its morphology. We used a principal component analysis on elliptical Fourier descriptors (EFDs) to analyze asymmetries in the terminal leaflet (Figures 3C to 3E) (Iwata et al., 1998; Iwata and Ukai, 2002). Only asymmetric components of shape variance were analyzed, as this is the relevant question at hand (Iwata et al., 1998). Principal components (PCs) 1 and 2 were the only large effect PCs for which there was an overall significant difference between plants by chirality (Figure 3D; Wilcoxon rank-sum, PC1 P = 1.67 × 10⁻⁶ and PC2 P = 9.52 × 10⁻⁷). Together, PC1 and PC2 explain 70.1% of asymmetric shape variation. In terms of shape, PC1 and PC2 vary as to whether the lobe on the left or right side is more distinct, but both similarly describe the positioning of lobes. Low PC1 and PC2 values describe variation in which the left lobe of the terminal leaflet is placed more distally (toward the tip) than the right, while higher PC1 and PC2 values describe variance of shape in which the right lobe is distal to the left.
Considering PC values in each leaf separately, only leaves 3 and 4 significantly differ in their PC values with respect to phyllotactic chirality (Figure 3E). This is likely due to the gradual increase in variance of leaflet shape as one progresses through the leaf series from leaf 1 to leaf 4, which is understandable given the heteroblastic series in tomato where the first few leaves appear amorphous and less developmentally stable than leaves that emerge later. This is also consistent with a gradual development of spiral phyllotaxy in the nodes following the opposite cotyledons. For both leaves 3 and 4, PC1 and PC2 values of terminal leaflets arising from CC plants are significantly higher when compared with values from clockwise plants. This means that the right lobes of terminal leaflets arising from plants with CC phyllotaxis sit distal relative to those from C plants. This is evident when comparing the mean leaf 3 and leaf 4 terminal leaflet shapes between C and CC plants (Figures 3C and 3G).
Another indication of the effects of asymmetric auxin distribution is the number of leaflets on the descending and ascending sides of the leaf. Our previous work has indicated that one of the effects of increased auxin distribution in compound leaves is ectopic leaflet formation and excess blade outgrowth (Koenig et al., 2009). In fact, previous auxin application experiments support the notion that the descending and ascending sides of a leaf respond to auxin independently; that is, the effects of auxin application are limited to the side of the leaf where the auxin is placed. As the number of primary leaflets is essentially fixed to four (two each side), we counted the number of intercalary leaflets on each side of the fourth leaf (Table 1). On average, there were more (∼0.37) intercalary leaves on the descending side of the leaf relative to the ascending side (P = 3.12 × 10⁻¹¹, Wilcoxon paired), consistent with the increased auxin we infer is present on this side of the leaf primordium (Figure 1).
Table 1. Differences in Intercalary Leaflet Count between the Ascending and Descending Sides of the Leaf.
| Side of the Leaf | Mean Intercalary Leaflet Count | se |
|---|---|---|
| Ascending | 3.28 | 0.07 |
| Descending | 3.65 | 0.07 |
Shown are the mean intercalary leaflet counts on the ascending and descending sides of the fourth leaf. There is a highly significant increase in leaflet count on the descending side of the leaf relative to the ascending side (∼0.37 leaflets), consistent with previous studies (Koenig et al., 2009), and observations of increased auxin response on the descending side of primordia. n = 392; P = 3.12 × 10⁻¹¹ (Wilcoxon paired),
Overall, our results suggest that the features on the descending side of tomato leaves, from leaflets to the lobes of the terminal leaflets, are shifted distally relative to the ascending side. Additionally, there is an increased number of intercalary leaflets on the descending side of the leaf relative to the ascending side. These shifts are consistent with (1) morphological asymmetries we observe in young leaf primordia but also more importantly (2) auxin response and modeled asymmetries that predict a shift in the placement of auxin maxima toward the descending side of leaf primordia.
If phyllotaxis truly constrains left-right symmetry, we would expect spirally generated Arabidopsis leaves to also be asymmetric with respect to phyllotactic direction. Indeed, using quantitative measures of shape, it is apparent that Arabidopsis leaves have increased laminar outgrowth on the descending side of the leaf (Figure 4), consistent with the direction of the asymmetries we observe in the model and measure in tomato (Figure 1). Therefore, the direction of the phyllotactic spiral is a principal predictor of left-right leaf asymmetry in both tomato and Arabidopsis leaves.
Figure 4.

Asymmetry in Arabidopsis Leaves with Respect to Phyllotactic Direction.
(A) Asymmetric variation in shape explained by PC1 in leaves of Columbia-0. Arrows indicate laminar bulges.
(B) PC1 values from Arabidopsis differ across the leaf series such that C leaves have higher PC1 values than CC leaves (P = 0.00012).
(C) Significantly higher PC1 values in leaves from C plants indicate increased laminar outgrowth on the descending (Des.) side of leaves. The descending side of leaves arising from C (orange) and CC (black) plants is indicated by appropriately colored text.
(D) Outlines of leaves from C and CC plants with asymmetries characteristic of those statistically observed.
Auxin Application Is Sufficient to Induce Leaf Asymmetries
If the asymmetries in auxin response we observe by modeling and reporters (Figure 1) are indeed responsible for morphological asymmetry (Figures 2 to 4), we would expect that ectopic auxin application would be sufficient to induce similar effects. To test this, auxin was locally applied to the base of primordia as a lanolin paste (Figures 5A to 5C, bottom panels) at a previously determined physiologically relevant concentration based on auxin availability (Reinhardt et al., 2000; Koenig et al., 2009). The effects of auxin are of most interest when applied to the ascending side of leaves, which we infer is normally deficient in auxin response relative to the descending side (Figure 1). Auxin application to the ascending side of a primordium distally shifts lateral leaflets and increases the laminar outgrowth of terminal leaflets on the side of auxin application (Figure 5A). These features are typically associated with the descending side of leaves (Figures 2 and 3). As under nonmanipulated conditions (Figures 3A and B), we quantified the shift in lateral leaflet position induced by auxin application (Figure 5D). Lateral leaflets were significantly shifted ∼1 mm higher on the side of mature leaves to which auxin was applied during their development (P = 0.014). This shift is a conservative estimate, as we preferentially applied auxin to the ascending side of leaves (nASC = 20 and nDESC = 10). That is, when not manipulated, leaflets on this side are significantly shifted in the opposite direction than that induced by auxin (Figures 3A and 3B). The sufficiency of auxin to induce these morphological changes demonstrates the functional consequences of the asymmetries we infer by modeling and reporters and the developmental constraints that the architecture of the SAM and spiral phyllotaxis place upon leaf development.
Figure 5.

Leaf Asymmetries Induced by Ectopic Auxin Application.
(A) Auxin (10 mM) applied to the ascending base of leaf primordia (bottom panels, black material is applied auxin-lanolin paste). Top panels show resulting mature leaves that develop from the primordia shown. Ectopic auxin application yields leaves with their proximal leaflets shifted distally (arrows) and increased laminar outgrowth of the terminal leaf on the side of auxin application (asterisk), features associated with the descending side of the leaf when auxin is not applied (Figure 3).
(B) Auxin application yields similar effects when applied to the descending side of leaf primordia as well, exaggerating the morphology of characteristics normally associated with this side.
(C) Application of DMSO in lanolin (control) produces leaves more symmetrical than those to which auxin is applied (n = 15).
(D) Shifts in leaflet position were measured as the difference between “a” (green), the distance to the first proximal lateral leaflet on the side of auxin application, and “b” (orange), the distance to the lateral leaflet on the unmanipulated leaf side. As shown, leaflets are significantly shifted distally on the side of auxin application (one-sample t test, P = 0.014). Note that auxin was applied to the ascending (Asc.) side of leaves twice as often as the descending (Desc.) side (nASC = 20 and nDESC = 10). Such a bias makes this test conservative, as we expect the ascending side of leaves to be shifted proximally (toward the leaf base) in the absence of any manipulation (Figure 3).
DISCUSSION
Lewis Wolpert and Maynard Smith, among others, defined developmental constraint as the following (Smith et al., 1985): A developmental constraint is a bias on the production of variant phenotypes or a limitation on phenotypic variability caused by the structure, character, composition, or dynamics of a developmental system. In recent years, the ubiquity and importance of auxin-dependent processes in plant development has been firmly established. Although incomplete, the list of auxin-mediated phenomena in plants includes initiation of lateral roots, tropisms, maintenance of the root apical meristem, and patterning of the vasculature, embryo, and female gametophyte (Teale et al., 2006). If auxin is a primary determinant of such interconnected developmental events, it might be expected that the dynamics of one auxin-mediated process may constrain the outcomes of another, via shared dependence upon auxin.
A case in point is the role of auxin in establishing spiral phyllotaxis. The niches occupied by the left and right sides of leaf primordia in the SAM differ substantially in a way dependent on the direction of the phyllotactic spiral (Figure 6). Competition for space among auxin peaks depends on their position relative to each other and can have an asymmetry effect on the auxin distribution on the ascending and descending sides of a leaf primordium. These inferred auxin asymmetries impinge upon and constrain the patterning of the proximal-distal axis along the left and right sides of the leaf. Leaflet position is determined by auxin in the complex leaves of both tomato and Cardamine hirsuta (Barkoulas et al., 2008; Koenig et al., 2009). Recently, a similar mechanism has been proposed to pattern serrations along the margin of Arabidopsis (Bilsborough et al., 2011). Our data support the notion that asymmetries in auxin response between the ascending and descending sides of the leaflet primordium (Figure 1), which are a natural consequence of the dynamics of auxin transport in the SAM, affect the patterning of the proximal-distal axis differentially on the left and right sides of the leaf. That these inferred auxin asymmetries exist from the inception of the leaf argues toward their importance, as they are present during the developmental window when proximal-distal patterning is first established (Koenig et al., 2009). Indeed, the effects of these asymmetries are seen not only in leaf primordia, but also in mature leaves (Figures 3 to 5).
Figure 6.

The Left and Right Sides of Leaf Primordia Are Exposed to Differing Auxin Concentrations, Dependent on Phyllotactic Direction.
Diagram of C (orange) and CC (gray) phyllotactic systems. Ascending (red) and descending (purple) sides of the P0 and P1 are denoted, as well as left (L) and right (R). Black arrows indicate auxin flux. The relationship between young and old primordia is such that auxin is depleted from the ascending side of older primordia and supplied to the descending side of younger primordia.
That phyllotactic patterning imposes constraints upon the left-right symmetry of leaves rests upon the assumption that auxin mediates both processes. At least throughout the core eudicots, this argument can be made. Spiral phyllotaxis is a result of auxin transport processes in both the rosids (Reinhardt et al., 2003) and the asterids (Reinhardt et al., 2000; Stieger et al., 2002), as is proximal-distal patterning of leaflets and serrations described above (Barkoulas et al., 2008; Koenig et al., 2009; Bilsborough et al., 2011). In the few species for which left-right asymmetry is apparent by eye, such as Calathea and Aglaonema, increased laminar growth always occurs on the descending side of the leaf (Korn, 2006).
Auxin-mediated patterning is an obviously malleable mechanism co-opted in numerous developmental processes. The prevalent use of auxin, however, constricts the morphospace available to leaves, as leaves are both initiated and patterned by auxin within the context of spiral phyllotaxis. The relationship between phyllotaxis and leaf asymmetry is likely modulated by other parameters that mutually affect the development of the SAM and leaves, including meristem and primordium size, plastochron interval (time between each organ initiation), and nonspiral phyllotactic patterns. Bilateral communication between the meristem and young primordia is well established (Sussex, 1951; Waites et al., 1998). Given our current knowledge of the global influence of auxin in the SAM and leaf development, we can now begin to explore the mechanisms by which leaf morphology is constrained by the developmental context within which it is initiated.
METHODS
Plant Materials and Growth Conditions
Tomato (Solanum lycopersicum) accession LA3475 (cv M82) was used for wild-type tomato measurements. Tomato resources were obtained from the UC Davis Tomato Genetics Resource Center, and the DR5:VENUSx6 line is as described by Shani et al. (2010). Arabidopsis thaliana Columbia-0 was used for all Arabidopsis work.
Tomato seeds were sterilized for 2 min in 50% bleach, washed in water, and plated onto wet paper towels in Phytatrays (Sigma-Aldrich). Seed was kept at room temperature in darkness for 3 d and then transferred to chamber conditions in light for an additional 3 d before transplanting into Sunshine soil mix (Sun-Gro Horiculture). Arabidopsis seeds were placed straight into soil. Plants were grown in a walk-in chamber (Conviron) with temperature adjusted to 22°C and lighting to a 16:8 h light-dark cycle. For measures of leaflet positioning and terminal leaflet shape, tomato plants were analyzed 33 d after plating seed. For histology, tomato apices were harvested 19 d after plating seed and processed using standard histological protocols. Arabidopsis leaves were harvested 25 d after sowing.
Measures of Lateral Leaflet Displacement and Asymmetric Shape
Measurements of lateral leaflet position and terminal leaflet shape in tomato were made from photographs. The first four leaves of tomato plants were dissected and placed under nonreflective glass, and their terminal leaflets were removed at the base. Photos of the leaf series were taken using Olympus SP-500 UZ cameras mounted on copy stands (Adorama; 36’’ Deluxe Copy Stand) and controlled remotely by computer using Cam2Com software (Sabsik). Arabidopsis leaf series were scanned (Epson; Perfection V300 photo scanner).
Measures of the distance from the base of the terminal leaflet or the petiole to the most distal and proximal leaflets were made using measurement functions in ImageJ. Lengths were normalized using rulers present in each photograph. For shape analysis, photographs were first converted to binary form using ImageJ and individual leaflets extracted from the leaf series and named appropriately as separate files.
The analysis of leaflet/leaf shape was conducted using EFDs followed by principal component analysis using the program SHAPE (Iwata and Ukai, 2002). Object contours were extracted as chain code. Chain code was subsequently used to calculate normalized EFDs. Normalization was based on manual orientation with respect to the proximal-distal axis of the leaflet/leaf. Principal component analysis was performed on the EFDs resulting from the first 20 harmonics of Fourier coefficients. For the analysis of symmetrical shape, a and d coefficients were analyzed, while for analysis of asymmetrical shape, b and c coefficients were analyzed (Iwata et al., 1998). Coefficients of EFDs were calculated at −2 and +2 standard deviations for each PC and the respective contour shapes reconstructed from an inverse Fourier transformation. PCs were then analyzed for statistical differences between various factors.
Tissue Culture and Auxin Application
Shoots were cultured as previously described (Fleming et al., 1999). Auxin applications (10 mM IAA or 1% DMSO as a control) were performed as previously conducted in SAMs (Reinhardt et al., 2000; Koenig et al., 2009) on P2- and P3-staged leaves. For mature leaf morphology, shoots were transferred to soil and maintained in high humidity. Recovered shoots then grew for several weeks until leaves were large enough for imaging.
Statistical Analysis
All basic statistic functions were performed in R and visualized in the package ggplot2 (Wickham, 2009). PCs arising from EFDs for tomato leaflets were not normal, and statistical differences were called on a per leaf basis using nonparametric tests. PCs describing EFDs for Arabidopsis and modeled IAA shift and divergence angle values were sufficiently normal to fit analysis of variance models. Arabidopsis terms considered were leaf number, phyllotactic chirality, and the interaction between these terms if statistically supported. Spiral model terms included simulation, leaf, plastochron, phyllotactic direction, and interaction terms if supported.
Auxin Transport Modeling
For the purpose of this study, we have adapted the model of phyllotaxis of Smith et al. (2006) and Smith (2011). Cells were modeled as polygons on a growing shoot apex surface with cell division. Growth of the apex and bulging primordia were both specified descriptively, with an auxin transport simulation used to determine the location of primordium initiation. The auxin simulation provides a spacing mechanism via the feedback of auxin on the polarity of its transporter, the PIN1 protein. This transport-feedback patterning process (Smith and Bayer, 2009) causes the formation of auxin convergence points in the peripheral zone of the growing shoot apex. New primordia were triggered when a pair of adjacent cells reaches a threshold concentration, and their center of mass was taken as the primordium center. Although growth caused primordia to move down the surface away from the tip as the simulation proceeded, the radial position of primordia did not change after initiation. Upon differentiation, cells within a fixed-size neighborhood of the center of a primordium were considered as primordium cells and were assigned a separate identity (blue cells in Figure 1A). The radius used to recruit new primordium cells was increased as primordia develop and grow out. Thus, new cells are added to primordia both by cell division and recruitment. In the original model of Smith et al. (2006), primordium cells were given a bias for PINs to preferentially orient toward the primordium center. This assumption fixes the center of the auxin peak upon differentiation and was used to stabilize the model, producing more regular patterns. Subsequently, it was found that by using a different equation for auxin transport, the model became much more stable and able to generate a wider variety of patterns (Smith, 2011). More importantly, normal Fibonacci phyllotaxis patterns could be maintained without the assumption of a PIN bias in primordium cells. This allowed the auxin peaks the freedom to move after initiation, as they were no longer explicitly tied to the primordium centers. Thus, the cells marked as primordium cells had no special identity in the model, except to calculate the primordium center and the center of the auxin convergence point.
Cells were modeled as polygons on a growing apex surface and thus are assumed to be uniform in thickness. Extracellular space was ignored, with diffusion and transport occurring directly from cell to cell. The change in concentration of auxin in a cell was modeled as:
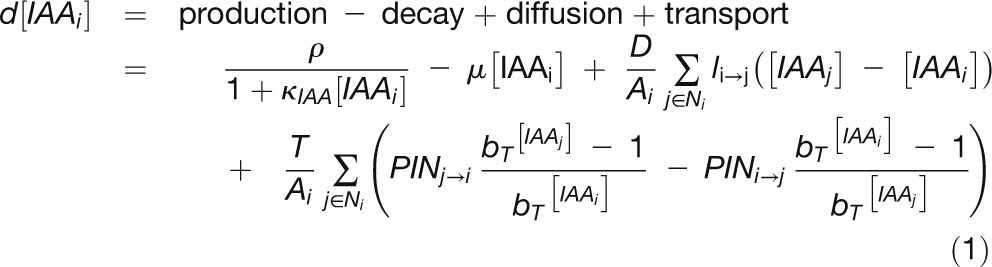 |
where  is the concentration of auxin in cell i, ρcontrols the rate of production with saturation coefficient
  , μcontrols decay, D is the diffusion coefficient,
  is the area of cell i,
  are the neighbors of cell i,
  is the length of the wall between cell i and j, T is the transport coefficient,
  is the amount of PIN1 on the membrane of cell i facing cell j, and
  is the base for exponential transport. Auxin production occurred in all cells greater than a fixed distance from the apex tip. In these central zone cells, ρ was set to zero.
We modeled PIN allocation to the membranes as:
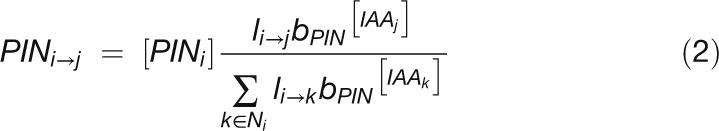 |
where  is the total amount of PIN in cell i, and
  is the base for exponential PIN allocation to cell membrane sections. Equations 1 and 2 were implemented on the growing cellular template as described by Smith et al. (2006). Simulations were performed using the VV simulation environment (Smith et al., 2003) and written in C++. VV is available as part of the L-studio collection (Prusinkiewicz, 2004) of biological modeling software.
Variability in Divergence Angles
The model is deterministic; however, a small amount of noise was included in the auxin production coefficient at each time step. A different seed for the pseudo-random number generator caused each simulation run to proceed differently, although individual runs were qualitatively similar (i.e., produce Fibonacci phyllotaxis). The amount of noise added was very small as the IAA production coefficient was shifted at most ±0.004% in each time step (following a Gaussian distribution). Although such small variation has little impact on positioning later in the simulation, it greatly affects the initial symmetry-breaking in the model, which decides the position of the initial primordia. Modeling in this way allowed the simulation of many different virtual plants, with the same model parameters.
A greater contribution to the variability in divergence angles comes from the cellular tissue upon which the model is constructed. Cell size and shape affect cell-to-cell transport since the total amount of transport is depends on wall length (Equations 1 and 2). This affects the auxin distribution and the exact positioning of new primordia. Thus, the irregular shape of cells was the primary source of the variance in divergence angles seen in the main text (Figure 1B).
Confocal Imaging
Meristems were stained in 0.01% propidium iodide solution for 10 min and then transferred for confocal imaging. Three-dimensional optical stacks were collected with a Leica TCS SP5 confocal microscope using a ×63 long distance objective. The depth of z-sections was set to 0.5 µm for accurate curvature analysis. Samples were excited with an argon laser (488 nm), and data were collected in two channels: (1) propidium iodide (615 to 660 nm) and (2) yellow fluorescent protein (505 to 545 nm).
Using MorphoGraphX (http://www.MorphoGraphX.org), confocal image stacks collected in the propidium iodide channel were used as follows to create a two-dimensional curved meristem surface with curvature measure: (1) The propidium iodide stack was loaded into the software and the stack was processed to obtain a sharp outline of the meristem surface. (2) The surface was then fit with a polygonal mesh using 6-µm cubes, and subsequently the mesh was smoothed three times. This yielded a smoothed mesh of roughly 5000 to 6000 vertices. (3) The Gaussian curvature of the mesh was then calculated for a mesh neighborhood of 5 and the extracted surface colored to reflect this measure. Such a large mesh neighborhood was used to provide global information on curvature and rule out local curvature changes such as cell surface bulging. Gaussian curvature is the product of the two principal directions of curvature. As such a dome or valley would both have positive curvature (product of two positive curvatures or two negative curvatures respectively), whereas a saddle shape (like the crease between primordia and meristem) with one positive and one negative principal curvature would yield a negative Gaussian measure.
Confocal image stacks collected in the YFP channel were then loaded in behind the extracted surface after it was subdivided to ∼200,000 vertices. Signal was projected paradermally onto the surface from 0.5 to 15 µm depth within the stack, using the surface as measure 0 µm. This depth of data corresponds to approximately three cell layers. The projected signal was color coded by intensity of signal.
Acknowledgments
We thank Julin Maloof (University of California Davis) for mentorship in quantitative approaches. The UC Davis Tomato Genetics Resource Center provided tomato germplasm, and the DR5:VENUSx6 line is a gift from Naomi Ori (Hebrew University, Israel). Matt Jones (University of California Davis) graciously provided experimental reagents. Rebekah Clarke, Dan Naylor, Nataly Raymundo, Nora Downs, Paradee Thammapichai, Sumitra Tatapudy, Tandis Arani, and Thinh Thiem (all of University of California Davis) provided photographic assistance. C.M. is supported by a National Science Foundation Graduate Research Fellowship. D.P.K. is supported by a grant from the Human Frontier Science Program (Fellowship LT000783/2010). S.A.B. is funded by a National Science Foundation–International Research Fellowship Program fellowship and SystemsX.ch. D.H.C. is a Gordon and Betty Moore Foundation Fellow of the Life Sciences Research Foundation. Funding for R.S.S. was provided by SystemsX.ch Plant Growth Research, Technology, and Development. This work was funded through a National Science Foundation grant (IOS-0820854) to N.R.S., Julin Maloof, and Jie Peng (University of California Davis).
AUTHOR CONTRIBUTIONS
D.H.C., L.R.H., A.R., S.A.B., D.P.K, C.M., R.S.S, and N.R.S. designed the experiments. D.H.C., L.R.H., A.R., S.A.B., D.P.K, C.M., and R.S.S performed the experiments. S.A.B, R.S.S., and C.K. contributed new analytic/computational tools. D.H.C. and R.S.S. analyzed data. D.H.C., C.K., R.S.S., and N.R.S. wrote the article.
Glossary
- SAM
shoot apical meristem
- IAA
indole-3-acetic acid
- C
clockwise
- CC
counterclockwise
- EFDs
elliptical Fourier descriptors
- PC
principal component
References
- Barkoulas M., Hay A., Kougioumoutzi E., Tsiantis M. (2008). A developmental framework for dissected leaf formation in the Arabidopsis relative Cardamine hirsuta. Nat. Genet. 40: 1136–1141 [DOI] [PubMed] [Google Scholar]
- Bilsborough G.D., Runions A., Barkoulas M., Jenkins H.W., Hasson A., Galinha C., Laufs P., Hay A., Prusinkiewicz P., Tsiantis M. (2011). Model for the regulation of Arabidopsis thaliana leaf margin development. Proc. Natl. Acad. Sci. USA 108: 3424–3429 [DOI] [PMC free article] [PubMed] [Google Scholar]
- Dormer K.J. (1972). Shoot Organization in Vascular Plants. (Syracuse, NY: Syracuse University Press; ). [Google Scholar]
- Fleming A.J., Caderas D., Wehrli E., McQueen-Mason S., Kuhlemeier C. (1999). Analysis of expansin-induced morphogenesis on the apical meristem of tomato. Planta 208: 166–174 [Google Scholar]
- Iwata H., Niikura S., Matsuura S., Takano Y., Ukai Y. (1998). Evaluation of variation of root shape of Japanese radish (Raphanus sativus L.) based on image analysis using elliptic Fourier descriptors. Euphytica 102: 143–149 [Google Scholar]
- Iwata H., Ukai Y. (2002). SHAPE: A computer program package for quantitative evaluation of biological shapes based on elliptic Fourier descriptors. J. Hered. 93: 384–385 [DOI] [PubMed] [Google Scholar]
- Jönsson H., Heisler M.G., Shapiro B.E., Meyerowitz E.M., Mjolsness E. (2006). An auxin-driven polarized transport model for phyllotaxis. Proc. Natl. Acad. Sci. USA 103: 1633–1638 [DOI] [PMC free article] [PubMed] [Google Scholar]
- Koenig D., Bayer E., Kang J., Kuhlemeier C., Sinha N. (2009). Auxin patterns Solanum lycopersicum leaf morphogenesis. Development 136: 2997–3006 [DOI] [PubMed] [Google Scholar]
- Korn R.W. (2006). Anodic asymmetry of leaves and flowers and its relationship to phyllotaxis. Ann. Bot. (Lond.) 97: 1011–1015 [DOI] [PMC free article] [PubMed] [Google Scholar]
- Kuhlemeier C. (2007). Phyllotaxis. Trends Plant Sci. 12: 143–150 [DOI] [PubMed] [Google Scholar]
- Macloskie G. (1895). Antidromy in plants. Am. Nat. 29: 973–978 [Google Scholar]
- Prusinkiewicz P. (2004). Art and science for life: Designing and growing virtual plants with l-systems. Acta Hortic. 630: 15–28 [Google Scholar]
- Raunkiaer C. (1919). Über Homodromie und Antidromie, insbesondere bei Gramineen. Biologiske meddelelser 1 (12). [On homodromy and antidromy, especially in the grasses.]. (Copenhagen, Denmark: A.F. Host & Son)
- Reinhardt D., Mandel T., Kuhlemeier C. (2000). Auxin regulates the initiation and radial position of plant lateral organs. Plant Cell 12: 507–518 [DOI] [PMC free article] [PubMed] [Google Scholar]
- Reinhardt D., Pesce E.R., Stieger P., Mandel T., Baltensperger K., Bennett M., Traas J., Friml J., Kuhlemeier C. (2003). Regulation of phyllotaxis by polar auxin transport. Nature 426: 255–260 [DOI] [PubMed] [Google Scholar]
- Shani E., Ben-Gera H., Shleizer-Burko S., Burko Y., Weiss D., Ori N. (2010). Cytokinin regulates compound leaf development in tomato. Plant Cell 22: 3206–3217 [DOI] [PMC free article] [PubMed] [Google Scholar]
- Smith J.M., Burian R., Kauffman S., Alberch P., Campbell J., Goodwin B., Lande R., Raup D., Wolpert L. (1985). Developmental constraints and evolution: A perspective from the Mountain Lake Conference on Development and Evolution. Q. Rev. Biol. 60: 265–287 [Google Scholar]
- Smith C., Prusinkiewiz P., Samavati F. (2003). Local specification of surface subdivision algorithms. Applications of Graph Transformations with Industrial Relevance (AGTIVE 2003). Lecture Notes in Computer Science 3062: 313–327 [Google Scholar]
- Smith R.S. (2011). Modeling plant morphogenesis and growth. In New Trends in the Physics and Mechanics of Biological Systems: Lecture Notes of the Les Houches Summer School, Vol. 92, July 2009, M.B. Amar, A. Goriely, M.M. Mueller, and L.F. Cugliandolo, eds (Oxford, UK: Oxford University Press), pp. 301–336
- Smith R.S., Bayer E.M. (2009). Auxin transport-feedback models of patterning in plants. Plant Cell Environ. 32: 1258–1271 [DOI] [PubMed] [Google Scholar]
- Smith R.S., Guyomarc’h S., Mandel T., Reinhardt D., Kuhlemeier C., Prusinkiewicz P. (2006). A plausible model of phyllotaxis. Proc. Natl. Acad. Sci. USA 103: 1301–1306 [DOI] [PMC free article] [PubMed] [Google Scholar]
- Stieger P.A., Reinhardt D., Kuhlemeier C. (2002). The auxin influx carrier is essential for correct leaf positioning. Plant J. 32: 509–517 [DOI] [PubMed] [Google Scholar]
- Sussex I.M. (1951). Experiments on the cause of dorsiventrality in leaves. Nature 167: 651–652 [DOI] [PubMed] [Google Scholar]
- Teale W.D., Paponov I.A., Palme K. (2006). Auxin in action: Signalling, transport and the control of plant growth and development. Nat. Rev. Mol. Cell Biol. 7: 847–859 [DOI] [PubMed] [Google Scholar]
- Waites R., Selvadurai H.R., Oliver I.R., Hudson A. (1998). The PHANTASTICA gene encodes a MYB transcription factor involved in growth and dorsoventrality of lateral organs in Antirrhinum. Cell 93: 779–789 [DOI] [PubMed] [Google Scholar]
- Wickham H. (2009). ggplot2: Elegant Graphics for Data Analysis. (New York: Springer; ). [Google Scholar]