Abstract
Ultrasonic attenuation is important not only as a parameter for characterizing tissue but also for compensating other parameters that are used to classify tissues. Several techniques have been explored for estimating ultrasonic attenuation from backscattered signals. In the present study, a technique is developed to estimate the local ultrasonic attenuation coefficient by analyzing the time domain backscattered signal. The proposed method incorporates an objective function that combines the diffraction pattern of the source/receiver with the attenuation slope in an integral equation. The technique was assessed through simulations and validated through experiments with a tissue mimicking phantom and fresh rabbit liver samples. The attenuation values estimated using the proposed technique were compared with the attenuation estimated using insertion loss measurements. For a data block size of 15 pulse lengths axially and 15 beamwidths laterally, the mean attenuation estimates from the tissue mimicking phantoms were within 10% of the estimates using insertion loss measurements. With a data block size of 20 pulse lengths axially and 20 beamwidths laterally, the error in the attenuation values estimated from the liver samples were within 10% of the attenuation values estimated from the insertion loss measurements.
INTRODUCTION
Ultrasonic wave propagation in random media at wavelengths comparable to or greater than the size of typical heterogeneities have been widely studied, often with a view toward characterization of the underlying microstructure. Quantitative ultrasound (QUS) techniques have been used to estimate the size, shape and mechanical properties of tissue microstructure for specified regions of interest (ROIs). Measurements of speed of sound,1, 2 backscatter energy,3 backscatter coefficient (BSC),4, 5 scatterer size, and scatterer strength5, 6 can provide a means for material characterization. However, many of these parameters require compensation for losses due to frequency-dependent attenuation. In and of itself, ultrasonic attenuation can also be used to distinguish between diseased and normal tissues. To this end, researchers have compiled attenuation coefficients for various tissues in different animals.1, 7, 8, 9, 10, 11, 12
Several methods have been developed to estimate local attenuation in scattering media from ultrasonic backscatter. Generally these attenuation algorithms can be divided into three categories: (1) frequency domain, (2) time-frequency domain, and (3) time domain techniques. In the frequency domain techniques, various methods such as spectral shift,13, 14, 15 spectral difference,15, 16 spectral-log difference,17, 18 and hybrid method19 have been developed and assessed. Insana et al.20 modified the spectral difference method by accounting for transducer beam diffraction pattern using an empirically determined correction factor. It accounted for transducer size, focus, and band-pass characteristics. The hybrid method estimates attenuation coefficients by using the spectral difference technique and Gaussian filters to measure the downshift of the central frequency.19 The hybrid method is an improvement over the spectral difference technique by employing a Gaussian filter to estimate center frequency of the backscattered power spectra. The hybrid method was demonstrated to be more stable at boundaries with variations in backscatter. The hybrid method uses the advantages of the spectral difference and spectral shift techniques while minimizing their disadvantages. Labyed and Bigelow21 recently compared three spectral domain attenuation estimation methods, i.e., spectral difference, spectral log difference, and hybrid methods, using backscattered signals from simulated phantoms with varying scatterer sizes and concentrations. The authors investigated the error associated with using different data block sizes for accurate attenuation estimation.
Frequency domain techniques use the backscattered power spectrum to estimate attenuation coefficients. The backscattered power spectrum can be modeled as a multiplication of a system response function, a scattering function and an attenuation function. By using a reference signal the system dependent function can be compensated in the power spectrum, yielding the normalized power spectrum. However, the normalized power spectrum is still a combination of the scattering function and attenuation, which are both frequency dependent. By assuming that the scattering function is constant over a particular depth, the attenuation can be estimated by comparing normalized power spectra at different depths. Therefore, the axial resolution of this technique can suffer because power spectra taken from several depths are required to accurately estimate the attenuation. All the spectral domain techniques assume that the diffraction effects can be decoupled from attenuation effects, which may result in biased estimates when the effects due to diffraction and attenuation are comparable to each other.
To better deal with diffraction effects, researchers developed a reference phantom spectral domain technique that compared the backscatter signal from a sample to a known reference sample, i.e., a phantom, to estimate backscatter and attenuation of the sample.16, 22 The reference technique accounts for system-dependent effects with the assumption that the speed of sound in the reference and the unknown sample are similar, otherwise diffraction effects will not be accounted for accurately. Researchers have developed algorithms to estimate backscatter coefficient and attenuation simultaneously.23, 24 Bigelow et al.23 estimated backscatter and attenuation simultaneously using a Gaussian transformation and spectral fit algorithm. Nam et al.24 developed a technique to simultaneously estimate BSC and attenuation slopes using a least sqaures method. The authors used a power law model for BSCs and developed a three-parameter model to incorporate backscatter and attenuation coefficients. Then a least squares technique was employed to estimate backscatter and attenuation coefficients simultaneously. The authors used a glass bead phantom to compare theoretical and experimental results. The authors modeled the frequency dependence of the backscatter coefficients using a power law fit to estimate both the parameters simultaneously.
Researchers have also investigated estimating attenuation based on time-frequency domain techniques. Fink et al.25 used a short time Fourier transform to calculate the down shift of the spectral centroid with depth to estimate attenuation. Again diffraction effects had been decoupled from attenuation in the estimation process.
In one time domain approach, He and Greenleaf used the monotonic relationship between the signal-to-noise ratio of the echo envelope peaks and the variance of the mean power of the scattered echoes to estimate attenuation coefficients.26, 27 Jang et al.28 estimated attenuation based on the entropy difference between two adjacent envelope segments of narrowband ultrasound pulse echoes. The authors used segments of size 10 mm × 10 mm from a depth of 3 cm using a 2.5 MHz transducer. Knipp and coworkers estimated ultrasound attenuation from B-mode image data.29 The authors used a “gray-scale look-up table” to convert image pixel value data within an ROI to echo signal amplitudes and compare these to echo signals from the same depth in a reference phantom. These relative echo levels were used to estimate attenuation in the respective ROI. Rice introduced the relationship between the density of zero crossings of a waveform and the power spectrum of that waveform.30, 31 Flax et al.32 demonstrated that the density of zero crossings could be related to attenuation coefficients by assuming the waveform could be described by a Gaussian spectrum. Again all the time domain methods discussed in the preceding text estimated attenuation by decoupling diffraction effects from attenuation effects. The time domain backscattered signal is a convolution of the source/receiver characteristics, scattering function, and attenuation function. Therefore the assumption of separating the source/receiver characteristics from the convolution integral may break down when diffraction effects are comparable with attenuation effects in the backscattered signal.
Time domain approaches can be easier to implement and can be computationally more cost effective compared to frequency or time-frequency domain techniques. However, it is more difficult to account for diffraction correction in time domain techniques. Recently, Ghoshal et al.33, 34 modeled the backscatter response in the time domain using a stochastic wave equation where the materials properties and source/receiver characteristics were coupled in an integral equation. The authors modeled the diffraction pattern using a single-order Gaussian beam model and compared the theoretical model with experimental data using high f-number transducers to extract grain size in polycrystalline media. The authors suggested that a single-order Gaussian beam model might not model the beam pattern accurately away from the focus specifically for transducers with high f-numbers. Thus a better model for the transducer beam pattern was necessary to successfully account for the backscatter response for a wide variety of transducer geometries.
In this study, the theoretical model developed by Ghoshal et al.33, 34 was modified using O’Neil’s35 analytical solution for the axial pressure for a focused transducer to estimate attenuation coefficients from tissues. Using an iterative process, the attenuation coefficient could be estimated by solving an integral equation where the attenuation coefficient and the diffraction of the beam pattern were coupled. A second model was derived by approximating the transducer axial pressure by multiple Gaussian functions, and a closed form solution for the time domain backscattered response was obtained. The attenuation coefficient was estimated for different data blocks corresponding to different locations imaged from a sample. The theory and the objective function for the optimization problem are briefly discussed in Sec. 2. The experimental methods and results from tissue-mimicking phantoms and fresh rabbit liver samples are provided in Sec. 3. Finally, Sec. 4 provides some conclusions regarding the study.
THEORY
Consider a block of data that corresponds to several consecutive lines of range gated ultrasonic backscattered signal from a sample. The variance of all the signals from a single data block is given by
| (1) |
where the angular bracket is defined as the mean of y, and V(t) is the backscattered signal corresponding to the data block. Using a single scattering assumption and a single order Gaussian beam pattern, the variance of signals in a given data block of axial length z1 to z2 is given by33, 34
| (2) |
where w0 is the transducer element radius, w(z) is the beam width as function of depth z in the respective material. The distance between the transducer surface and the sample, i.e., the water path, is denoted by zf, the distance zr is from the start of the surface of the solid media to the start of the data block, and the axial distance zi = zf + (c/cf)z. If no water path exists between the sample and the source, then zf = 0 and zi = z. The local attenuation coefficient, mass density, and speed of sound in the sample are denoted by α, ρ, and c, respectively. Similarly, the attenuation coefficient, mass density and speed of sound in water are denoted by αf, ρf, and cf, respectively. The total attenuation from the sample surface to the start of the data block is denoted by αT. The time domain input wave is assumed to be a Gaussian pulse where σ is the width in the time domain. It is assumed the backscatter coefficient denoted by σb is spatially and temporally independent and denoted at the center frequency associated with the input wave ω0. In practice, to extract the system dependent response, a reference signal can be acquired by reflecting a pulse from a planar reflector placed at the focus of the transducer. The peak amplitude of the reflected reference signal from the planar reflector placed at the focus of transducer (distance from the transducer face and the focus is denoted by zREF) is denoted by Vmax. The diffraction constant D(ω0, zREF) is used to account for the diffraction effects of the reference signal. The reflection coefficient of the planar reflector is denoted by Rff, and the transmission coefficient from the water to the material and from sample to water are denoted by TfL and TLf, respectively.
The displacement field using a complex single-order Gaussian beam can be written as34
| (3) |
where is the wave number and A0 is the amplitude at x = y = z = 0. The complex Gaussian beam parameter is defined by36, 37
| (4) |
where q(z) is a function of beamwidth w(z) and radius of curvature R(z) along axial direction of the propagating beam. The Gaussian beamwidth and the radius of curvature of the wavefront may be written as
| (5) |
At z = 0, the beamwidth is the transducer radius w (0) = w0, the radius of curvature of the wavefront is R(0) = −F, and F is the focal length. The source field can be separated into its amplitude A(x) and phase as
| (6) |
where the amplitude is given by
| (7) |
and the phase terms can be deduced accordingly. From Eqs. 4, 5, the factor may be written as
| (8) |
where and the wave vector is defined by . From Eq. 3, the factor is the square of the normalized axial pressure amplitude of the transducer for a single order Gaussian beam model. Next, the axial pressure of a focused transducer beam is approximated using two different models.
O’Neil model
O’Neil35 has provided the analytical solution for the axial pressure for a focused transducer as long as the focusing is not too severe using a continuous wave as the forcing function. Therefore, from O’Neil,35 Eq. 8 can be written as
| (9) |
where the denotes absolute of , and . Field II was used to simulate a transducer field pattern in water for the sets of transducers shown in Table TABLE I..38, 39 The comparison of the O’Neil model and Field II results are shown in Figs. 1a, 1b, 1c. The pressure field along the transducer axis was normalized by the maximum strength of the field and compared with the O’Neil model from Eq. 9 as shown in Fig. 1b. It can be observed that the difference between the theory and the simulated axial pressure is negligible.
TABLE I.
Transducer specifications.
| Transducer | Center frequency (MHz) | Focal length (mm) | f-number | Pulse length (PL) (μs) |
|---|---|---|---|---|
| f/3–5 MHz (Valpey Fisher) | 5 | 57.15 | 3 | 0.6 |
| f/4–8 MHz (Panametrics V321) | 8 | 74.65 | 4 | 0.4 |
| f/3–11 MHz (Valpey Fisher) | 11 | 38.10 | 3 | 0.3 |
| f/2–7 MHz (Valpey Fisher) | 7 | 37.37 | 2 | 0.6 |
Figure 1.
Simulated transducer axial pressure using Field II for (a) transducer f/3–5 MHz, (b) transducer f/4–8 MHz, and (c) transducer f/3–11 MHz geometries compared with the O’Neil model from Eq. 9 and four Gaussian functions from Eq. 11.
Combining Eqs. 2, 9, the single scattered response is given by
| (10) |
where is a constant obtained from Eq. 2. Generally data blocks are constructed around the focal region of the transducer for better signal-to-noise ratio. Therefore in such situations, modeling the axial pressure along the depth of field is sufficient to estimate attenuation.
Multiple Gaussian functions
Using multiple Gaussian functions, the axial pressure of the transducer can be modeled very accurately. The benefit of such modeling will lead to a closed form solution for the attenuation estimation function in the time domain backscattered response. The square of the absolute axial pressure can be written as a summation of M Gaussian functions as
| (11) |
where the constants Ap, zp, and γp are estimated by minimizing the error between the axial beam profile and Eq. 11. The axial beam profile can either be obtained experimentally or by using the expression shown in Eq. 9. The comparison of the multiple Gaussian functions and Field II results are shown in Figs. 1a, 1b, 1c. The results demonstrate good agreement between the multiple Gaussian model and the Field II for the entire depth of field of the respective transducers.
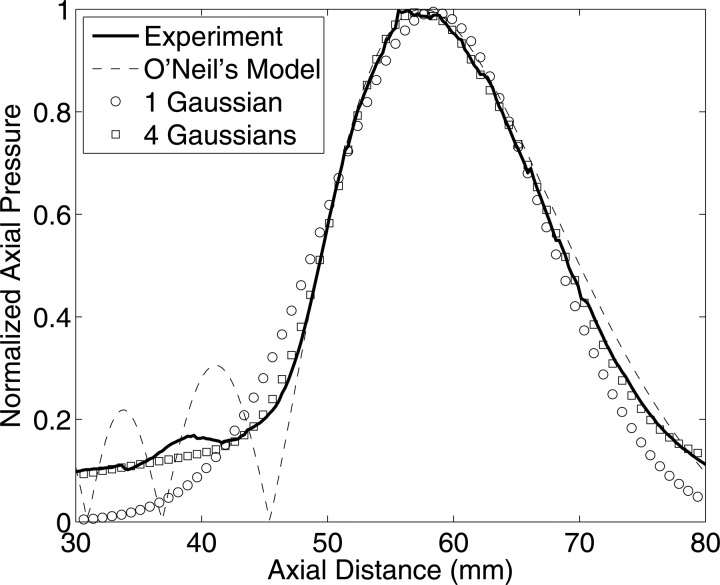
A comparison of the axial pressure estimated from experiments with the O‘Neil’s model, single-order Gaussian function and four Gaussians is shown in Fig. 2 for the transducer model (f/3-5 MHz) shown in Table TABLE I.. It can be observed that the best fit was obtained using summation of four Gaussian functions. Depending on the application, higher numbers of Gaussian functions could be used to improve the accuracy. The results demonstrated that the single-order Gaussian beam model fit the axial pressure with good accuracy near the focal region but deviated from experimental results away from the focus. Depending on the region of analysis, the user can choose different models such that accuracy and computation cost are optimized.
Figure 2.
Comparison of axial pressure of transducer f/3–5 MHz from experiment and various models.
Using the multiple Gaussian function the single scattered response is given by
| (12) |
Here the limits of integration were changed compared to the limits from Eq. 10, such that the analytical solution can be obtained. This change of limits does not violate any assumption because the Gaussian time domain pulse causes the integrand to approach zero depending upon t and the input wave pulse length, i.e., the location of data block. Therefore this model may be used to estimate local attenuation for different depths in the sample by adjusting the analysis region in terms of time t. Using the multiple Gaussian function to model the transducer axial pressure, the time domain backscattered response is given by
| (13) |
where is the ratio of speed of sound in the sample and water (assumed to couple the transducer to the sample). The preceding equation is an important result of the current study where a closed form solution is derived for time domain backscattered response. In this result, the attenuation function and the transducer characteristics are coupled.
The attenuation coefficient is estimated by minimizing the mean squared error between the model [from Eq. 13] and experimental results . Mathematically the optimization problem is stated as
| (14) |
where is the variance of all signals in the respective data block obtained from backscattered time-domain signals, Q is the total number of time samples used in the data block and is the theoretical normalized backscatter response at time ti using attenuation coefficient of α. The normalization is obtained using
| (15) |
Therefore to estimate attenuation, φ0 is not required to be calculated. The preceding normalization procedure adjusts the magnitude of the theoretical model to be comparable to the magnitude of the experimental result. The attenuation value used for that minimizes the least mean square error between the model and the experimental data is considered the attenuation value for the respective data block. The attenuation coefficient is converted from Np/cm to dB/cm. All the results presented in this study were obtained by using the multiple Gaussian functions and closed form solution of the time domain backscatter response. For all the transducer geometries used for this study, four Gaussian functions were used to model the axial pressure profile of each transducer.
EXPERIMENTAL METHODS AND RESULTS
Phantom construction
Two tissue-mimicking phantoms (Phantoms A and B) used by Wear et al.40 with different BSCs and attenuation coefficients were used here. Glass beads were used as scatterers in all the phantoms embedded in agarose, n-propanol, condensed milk, and water. Phantoms A and B had glass bead size distributions of 75–90 and 9–43 μm, respectively. The construction process of the Phantoms A and B was described by Wear et al.40
Simulations were conducted to test the new technique. The software phantoms were constructed in matlab (The Mathworks Inc., Natick, MA) and signals generated using Field II.38, 39 Three-dimensional volume matrices were constructed of 50 mm in the direction parallel to the transducer face, 2 mm in height, and of various depths (65 and 80 mm). The source consisted of a sinusoidal pulse with center frequency of 5 MHz and a pulse length of approximately 1.5 cycles. The beamwidth (−6 dB) was 900 μm for the source, assuming a Gaussian beamwidth for an f/3 aperture. The beam was focused at different depths in the phantom by changing the aperture size of the source/receiver and keeping the f/number of 3 as a constant. Point scatterers were placed at random spatial locations in the phantom volume using a uniform probability density function.
Liver samples
Fresh liver samples were extracted from male New Zealand white rabbits acquired from Myrtle’s Rabbitry (Tompson’s Station, TN). The rabbits had been on a special fatty diet.41 The basal diet contained 10% fat, 1% cholesterol, 0.11% Mg, 14% protein, and 54% carbohydrates (Catalog No. 1811279, 5TZB, Purina Test Diet, Richmond, IN). Therefore the rabbit livers had a higher fat content than a normal rabbit liver. Ultrasonic experiments were conducted within 15 min of the removal of the liver from the body.
Ultrasonic methods
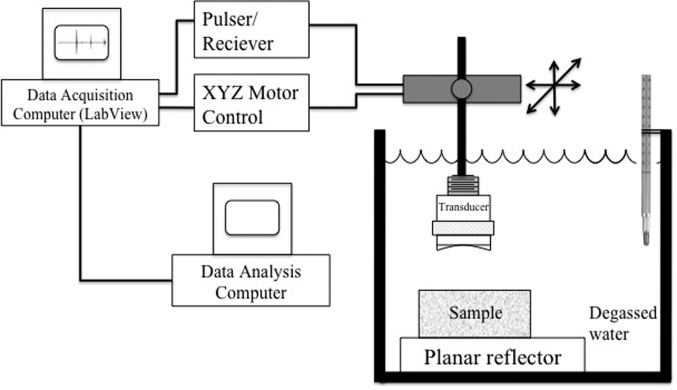
A schematic of the experimental setup is shown in Fig. 3. The sample was completely submerged and a single-element focused transducer was used for scanning. The specifications for the focused transducers used for the experiments are listed in Table. TABLE I.. For scanning, the tissue-mimicking phantoms were immersed in a tank of degassed water and the liver samples were immersed in 0.9% saline solution made from degassed water. The transducers were operated in pulse-echo mode using a Panametrics 5900 pulser/receiver (GE Panametrics, Inc., Waltham, MA), and the echo signals were recorded and digitized with a 14 bit, 200 MHz A/D card (Model: PDA14-200, Signatec, Newport Beach, CA) and downloaded to a PC computer for postprocessing. The sampling rate used to digitize the received signals was 200 MHz. In an experiment, the sample was held stationary and the transducer was moved using a computer-controlled micropositioning system (Daedal, Inc., Harrisburg, PA). For analysis, rf signals backscattered from the samples were recorded. A step size of approximately one-half beamwidth was used between consecutive scan lines. The temperature of the water bath was maintained at room temperature for the phantom experiments. A mechanical coil heater (Waage Electric Inc., Kenilworth, NJ) controlled by a water bath temperature controller (Model YS172, Yellow Spring Instrument Co., Inc., Yellow Spring, OH) was used to maintain water bath temperature at 37 °C for the experiments with liver samples.
Figure 3.
Experimental setup.
Sound speed and attenuation were also estimated in the phantoms and liver samples using time of flight and insertion loss methods, respectively.42 To estimate sound speed, arrival times of received pulses were measured with and without the sample in the water path between the transducer and a planar Plexiglas reflector. The sound speed in the sample c was computed from
| (16) |
where cf is the speed of sound in the surrounding fluid media, t3 is the propagation time to the reflector measured when no sample is in the path, and t1 and t2 are the arrival times of the frontwall of the sample and the sample/reflector interface echoes, respectively. The propagation times were estimated using cross-correlation.
Using the speed of sound estimated from Eq. 16, the sample thickness D was calculated. The attenuation coefficient was estimated using
| (17) |
where and are the frequency response of the time domain reflected signal from the Plexiglas reflector with and without the sample in the path, respectively. The attenuation coefficients estimated from the insertion loss methods at the center frequency of the input wave were compared with the results obtained from the proposed time domain attenuation estimation approach.
Experimental results
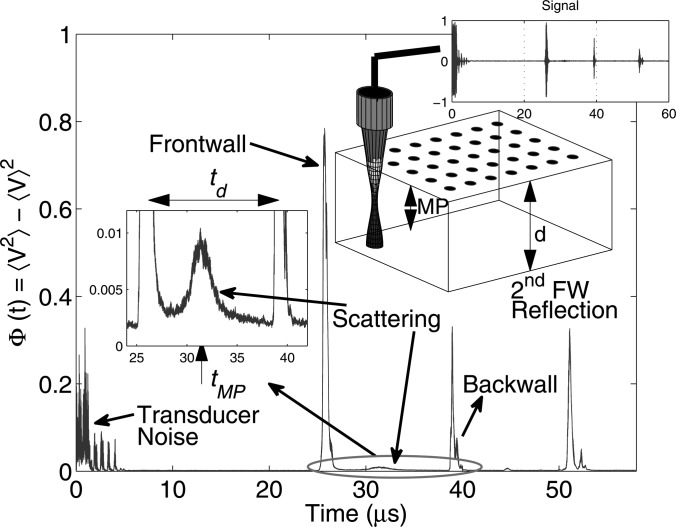
The variance of all signals from a sample of thickness d is shown in Fig. 4, where all the peaks are defined explicitly. The transducer pulse-echo signal was collected at several different spatial positions by translating the transducer across the sample. From Fig. 4, the peak between the frontwall and the backwall was mainly due to the material properties and source/receiver characteristics. The theoretical model shown in Eq. 13 can be used to fit the experimental data to estimate various parameters.
Figure 4.
(Color online) Schematic of a ultrasound scanning setup and the variance plot of all signals acquired at different locations. The peak between the frontwall and backwall reflection is magnified, which is a function of transducer characteristics and scattering properties of the material.
First, the input signal was analyzed in a region with uniform single scattering and fit to a Gaussian envelope to estimate σ. An example signal reflected from a planar surface placed at the focus of transducer f/4-8 MHz and the corresponding best-fit Gaussian envelope is shown in Fig. 5a, and its frequency response is shown Fig. 5b. Here the pulse length (PL) is referred to as the duration of the pulse [shown in Fig. 5a], where the amplitude falls from its max value by 20 dB.
Figure 5.
(a) Reflected signal from a planar reflector at the focus using transducer f/4–8 MHz and the Gaussian fit and (b) the frequency response of the signal.
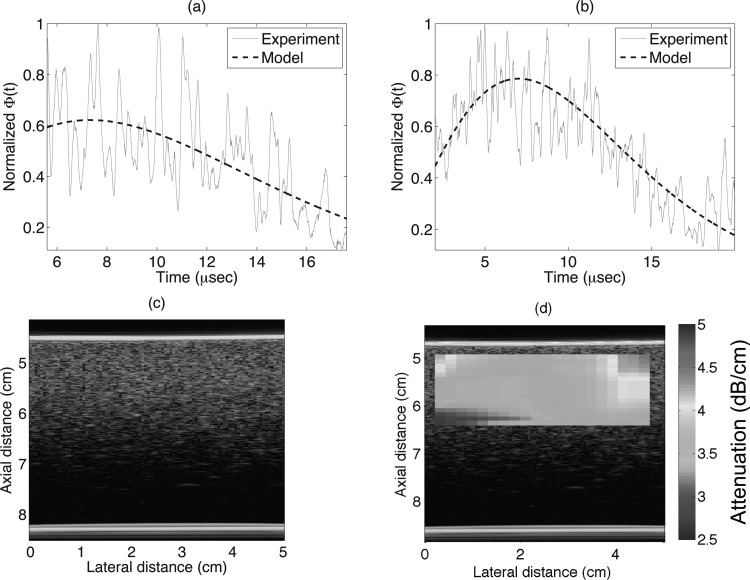
Next, the variances of the signal envelopes were calculated from a data block. The signal envelopes were used instead of the raw signals because this helped in reducing the high frequency fluctuations. Example variances of the signals for two different data block sizes are shown in Figs. 6a, 6b. As expected, more averaging of scan lines reduced the high frequency fluctuations in the variance curve. An example B-mode of Phantom B and its parametric map of attenuation are shown in Figs. 6c, 6d, respectively. The attenuation map was constructed using a data block size of 20 PL axially and 20 beam widths (BW) laterally. For all the results presented here, the data blocks were overlapped by 90% in both axial and lateral directions for the purposes of creating parameter images.
Figure 6.
(Color online) (a) Example variance of the signal and the model fit for a single data block of axial and lateral lengths of 20 PL and 20 BW, respectively. (b) Example variance of the signal and the model fit for a single data block of axial and lateral lengths of 25 PL and 50 BW respectively. (c) B-mode image, and (d) parametric B-mode image enhanced by attenuation maps for Phantom B.
From insertion loss measurements the estimated attenuation coefficients for Phantom A and B were 1.85 ± 0.025 and 4 ± 0.35 dB/cm, respectively, at 5 MHz. Wear et al.43 published insertion loss measurement from the same Phantom A and B as 0.4 and 0.7 dB/cm/MHz, respectively, in the frequency range of 2.5–5 MHz, which corresponds to 2 and 3.5 dB/cm for Phantom A and B, respectively, at 5 MHz. The interlaboratory comparison of the attenuation coefficients from Phantom A and B resulted in agreement within 0.75 and 1 dB/cm, respectively at 5 MHz compared to the insertion loss measurements, between the participating laboratories for the study.43
The absolute percent errors in mean attenuation coefficients were estimated using
| (18) |
where and refers to the estimated mean attenuation using the new method and insertion loss measurements. Error curves for phantoms A and B using transducer f/3–5 MHz are shown in Figs. 7a, 7c, respectively. The percentage standard deviation error was estimated using
| (19) |
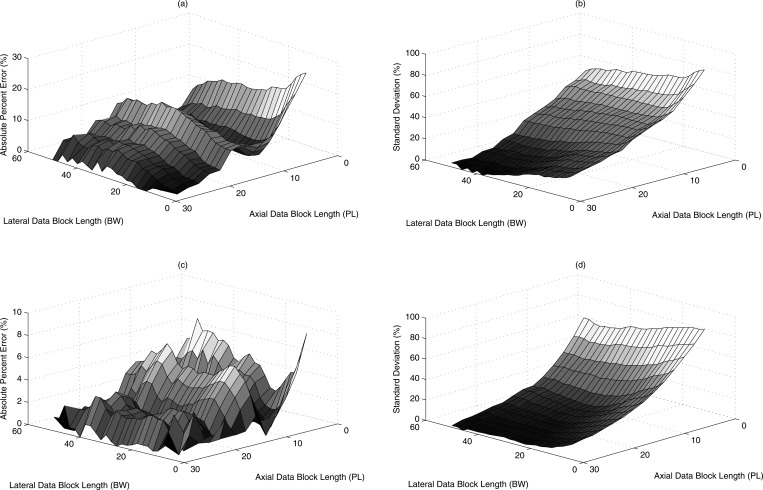
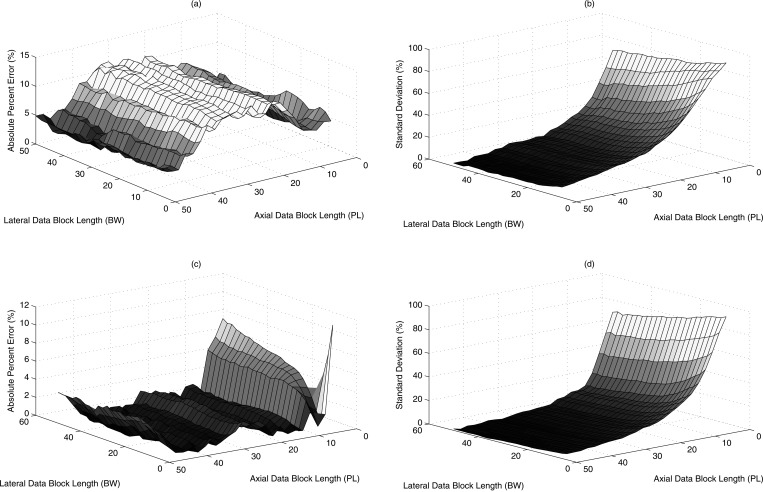
where and are the mean and standard deviation of the estimated attenuation from all the data blocks. The percentage standard deviation error from Phantoms A and B using transducer f/3–5 MHz are shown in Figs. 7b, 7d, respectively. The bias and the standard deviations decreased as the axial length of the data block size increased. The estimated percentage error and percentage standard deviation error using transducer f/4–8 MHz are shown in Figs. 8a, 8b, 8c, 8d. Similarly, the results using transducer f/2–7 MHz from Phantoms A and B are shown in Figs. 9a, 9b, 9c, 9d. Due to a small depth of field, the maximum possible axial data block size was 15 PL. Overall as the block size was increased both in the lateral and axial direction the error in estimated attenuation decreased compared to the insertion loss measurements. The new method yielded attenuation estimates within 10% of insertion loss measurements at a data block size of 15 PL axially and 15 BW laterally.
Figure 7.
(Color online) Attenuation estimated for Phantom A in terms of (a) absolute percent error and (b) standard deviation error and for Phantom B in terms of (c) absolute percent error (d) standard deviation error for the estimates for various combinations of data block sizes using transducer f/3–5 MHz.
Figure 8.
(Color online) Attenuation estimated for Phantom A in terms of (a) absolute percent error and (b) standard deviation error and for Phantom B in terms of (c) absolute percent error and (d) standard deviation error for the estimates for various combinations of data block sizes using transducer f/4–8 MHz.
Figure 9.
(Color online) Attenuation estimated for Phantom A in terms of (a) absolute percent error and (b) standard deviation error and for Phantom B in terms of (c) absolute percent error and (d) standard deviation error for the estimates for various combinations of data block sizes using transducer f/2–7.2 MHz.
To compare the results obtained using the proposed method with other methods, attenuation coefficients for Phantoms A and B were estimated from peaks of echo envelope as proposed by He and Greenleaf.26 The algorithm described in Sec. III of Ref. 11 was used, where the central 25 A-lines of the B-scan and the first 45 peaks were detected from the signal envelopes, which approximately corresponded to a data block size of 30–35 PL axially by 13 BW laterally. The comparison of the results from envelope peak method, and the new methods using two different data block size are tabulated in Table TABLE II.. The new method resulted in similar estimates in terms of error and standard deviations for half the axial length of the data block size used in the envelope peak method. At similar data block sizes, the new method resulted in much lower bias and variance estimates compared to the envelope peak method.
TABLE II.
Comparison of estimated error and standard deviations of attenuation coefficients from two different methods using transducer f/3–5 MHz.
| Phantom A | Phantom B | |||
|---|---|---|---|---|
| ABS ERR (%) | STD (%) | ABS ERR (%) | STD (%) | |
| Envelope peak (31PL × 13BW) | 10.81 | 24.18 | 2.50 | 20.51 |
| New method (15PL × 15BW) | 9.82 | 20.86 | 1.28 | 19.54 |
| New method (30PL × 15BW) | 0.25 | 9.64 | 0.84 | 7.20 |
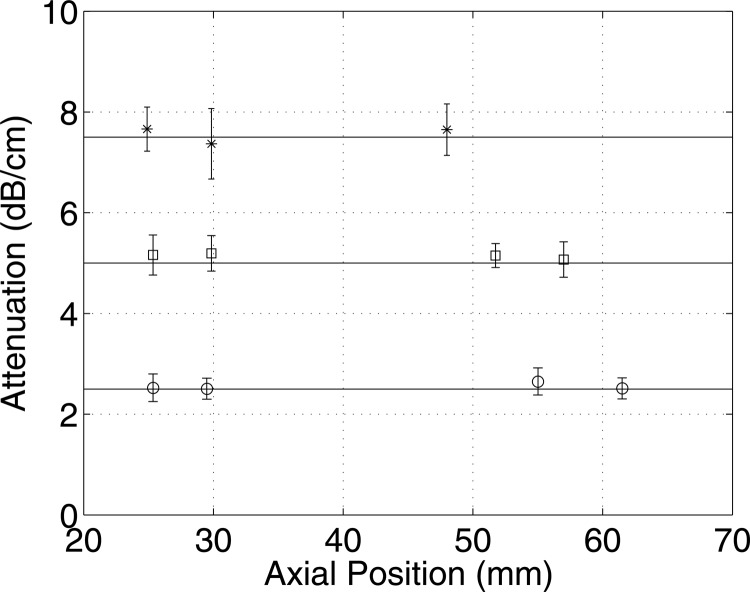
Using simulated phantoms, attenuation coefficients were estimated at various depth from weakly and strongly attenuating media. The attenuation estimates from three different numerical phantoms with attenuation coefficients of 2.5, 5, and 7.5 dB/cm at 5 MHz are shown in Fig. 10, using a data block size of 20 PL axially and 20 BW laterally. The attenuation coefficients estimated using the new method and without correcting for the downshift in the center frequency resulted in errors less than 10% compared to the actual attenuation values. Therefore the method appears to be robust at various depths in an attenuating media. However, it should be noted that for the results at 7.5 dB/cm (at 5 MHz) the signal-to-noise ratio was not sufficient to estimate attenuation accurately beyond 48 mm using the proposed method.
Figure 10.
Attenuation using the new method estimated from simulated phantoms with mean attenuation coefficients of 2.5, 5, and 7.5 dB/cm at 5 MHz denoted by ○, □ and *, respectively, along the axial direction from the surface of the phantom.
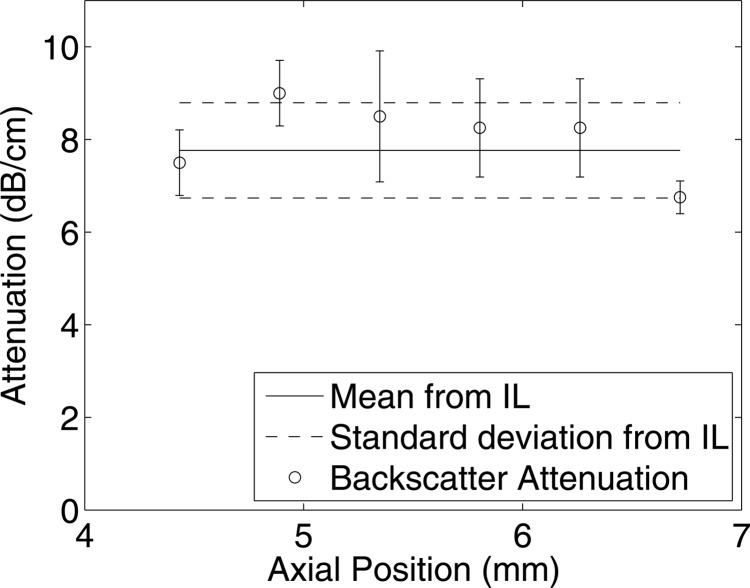
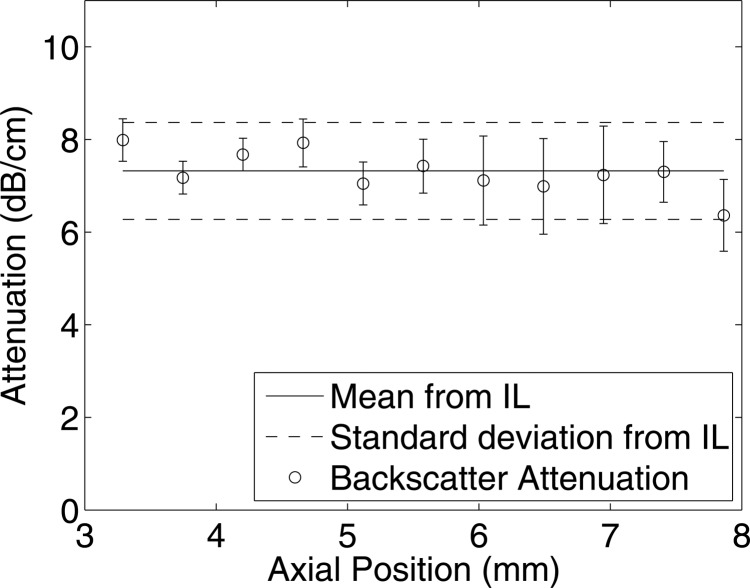
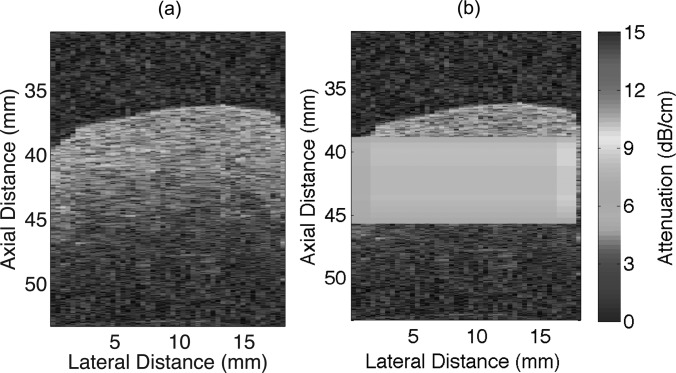
Attenuation coefficients were estimated from the rabbit liver samples using the new technique and compared with the estimates obtained by insertion loss using transducer f/3–11 MHz. From the insertion loss measurements, the estimated attenuation for the liver samples RL1 and RL2 were 7.81 ± 1.01 and 7.35 ± 1.12 dB/cm, respectively, at 11 MHz. Attenuation coefficients were estimated at different depths using the new technique for a data block size of 20 PL axially and 20 BW laterally. At each depth of the sample, the mean and standard deviation of the attenuation values were estimated from all the data blocks at that particular depth. The mean and standard deviation of attenuation values estimated using the new method and the insertion loss measurements are shown in Figs. 1112 for liver samples RL1 and RL2, respectively. The mean attenuation values of 8.04 ± 1.03 and 7.19 ± 0.79 dB/cm/MHz were estimated for the selected data blocks from samples RL1 and RL2 respectively. The B-mode image and a parametric image enhanced by attenuation coefficients for the rabbit liver sample RL1 are shown in Figs. 13a, 13b, respectively.
Figure 11.
Comparison of attenuation estimated using the insertion loss (IL) method with the proposed technique from rabbit liver RL1 using transducer f/3–11 MHz. The horizontal axis denotes the attenuation estimated from different depths using the new method, and the standard deviation is obtained from all the data blocks at the respective depth.
Figure 12.
Comparison of attenuation estimated using the insertion loss (IL) method with the proposed technique from rabbit liver RL 2 using transducer f/3–11 MHz. The horizontal axis denotes the attenuation estimated from different depths using the new method, and the standard deviation is obtained from all the data blocks at the respective depth.
Figure 13.
(Color online) (a) B-mode image, and (b) parametric B-mode image enhanced by attenuation maps for rabbit liver RL1.
CONCLUSION
A new time-domain attenuation estimation algorithm was introduced. The new technique coupled the spatial diffraction pattern of the source/receiver beam characteristics with the attenuation of the sample using a stochastic wave equation. The theoretical model derived here clearly demonstrated that it is the axial pressure of the beam that couples with the attenuation of the material. The axial pressure was modeled using O’Neil’s analytical solution and using multiple Gaussian functions. Using the Gaussian model, a closed form analytical solution for the time domain backscattered response was derived. Attenuation coefficients were then estimated using a numerical optimization scheme and multiple Gaussian functions to approximate the axial profile of the focused transducer beam from backscatter data from regions approximated by single and uniform scattering. Coupling the source/receiver characteristics with the attenuation function represents a significant improvement over previous time-domain attenuation techniques. The closed form solution obtained using multiple Gaussian functions was computationally more efficient compared to the solution obtained using O’Neil’s model because it did not require solving an integral equation numerically.
The attenuation values estimated using the new technique from tissue-mimicking phantoms for data block sizes of 15 PL axially by 15 BW laterally, agreed to within 10% of insertion loss estimates. Similarly the estimated attenuation from fresh rabbit liver samples, for data block sizes of 20 PL axially by 20 BW laterally, agreed to within 10% of insertion loss estimates. The results obtained for the fresh rabbit liver samples agreed to within one standard deviation of the insertion loss measurements.
For a tightly focused transducer (f/2), the new method also resulted in less than 10% error for data block sizes of 15 PL axially and 15 BW laterally. The error in the estimates decreased with increasing data block size but did not provide better than 5% error for the largest data block size. Interestingly, a larger data block size was required for the liver samples for less than 10% error with respect to the insertion loss estimates. The attenuation coefficients estimated using the new technique were compared with another time-domain technique based on envelope detection. The attenuation estimated using the new technique resulted in lower variance even when used outside the focal region of the beam because the theoretical model accounted for diffraction effects accurately.
Frequency domain techniques, such as the spectral centroid shift method, estimate attenuation by comparing the downshift in the center frequency from several data blocks along the axial direction.25 The new technique resulted in using similar effective data block sizes compared to some of the frequency domain techniques such as spectral-log difference and hybrid methods. In other frequency domain techniques, such as hybrid method,19 the backscatter coefficient is modeled as a power of frequency; this restricts its applicability. This contrasts with the new method proposed here that eliminates such limitations. Simulation and experimental results demonstrated that at a moderate depth of penetration and low to high attenuating media, the assumption resulted in errors of less than 10% of the expected values.
Due to the assumption of the maximum energy content at the center frequency, the backscatter coefficient just modifies the amplitude of the variance of the backscattered signals rather than its shape. To neglect this assumption, the backscatter coefficient can be integrated over the frequency band of the transducer but still would act as a constant amplitude term in the time domain variance function. However, the advantage of applying the technique without adjusting for the downshift in center frequency is that attenuation coefficients were obtained for each data block without knowing the backscatter coefficient.
ACKNOWLEDGMENT
The authors would like to acknowledge the technical contributions of Dr. Rita J. Miller. The work was supported by NIH Grant No. R01-EB008992.
References
- Goss S. A., Johnston R. L., and Dunn F., “Comprehensive compilation of empirical ultrasonic properties of mammalian tissue,” J. Acoust. Soc. Am. 64, 423–457 (1978). 10.1121/1.382016 [DOI] [PubMed] [Google Scholar]
- Techavipoo U., Varghese T., Chen Q., Stiles T. A., Zagzebski J. A., and Frank G. R., “Temperature dependence of ultrasonic propagation speed and attenuation in excised canine liver tissue measured using transmitted and reflected pulses,” J. Accoust. Soc. Am. 115, 2859–2865 (2004). 10.1121/1.1738453 [DOI] [PubMed] [Google Scholar]
- Straube W. L. and Arthur R. M., “Theoretical estimation of the temperature dependence of backscattered ultrasonic power for noninvasive thermometry,” Ultrasound Med. Biol. 20, 915–922 (1994). 10.1016/0301-5629(94)90051-5 [DOI] [PubMed] [Google Scholar]
- Madsen E. L., Insana M. F., and Zagzebski J. A., “Method of data reduction for accurate determination of acoustic backscatter coefficients,” J. Accoust. Soc. Am. 76, 913–923 (1984). 10.1121/1.391317 [DOI] [PubMed] [Google Scholar]
- Insana M. F., Wagner R. F., Brown D. G., and Hall T. J., “Describing small-scale structure in random media using pulse-echo ultrasound,” J. Accoust. Soc. Am. 87, 179–192 (1990). 10.1121/1.399283 [DOI] [PMC free article] [PubMed] [Google Scholar]
- Lizzi F. L., Greenabaum M., Feleppa E. J., Elbaum M., and Coleman D. J., “Theoretical framework for spectrum analysis in ultrasonic tissue characterization,” J. Accoust. Soc. Am. 73, 1366–1373 (1983). 10.1121/1.389241 [DOI] [PubMed] [Google Scholar]
- Chivers R. C. and Parry R. J., “Ultrasonic velocity and attenuation in mammalian tissues,” J. Acoust. Soc. Am. 63, 940–953 (1978). 10.1121/1.381774 [DOI] [PubMed] [Google Scholar]
- Parker K. J., “Ultrasonic attenuation and absorption in liver tissue,” Ultrasound Med. Biol. 9, 363–369 (1983). 10.1016/0301-5629(83)90089-3 [DOI] [PubMed] [Google Scholar]
- Tervola K., Gummer M., J. W.Erdman, Jr., and W. D.O’Brien, Jr., “Ultrasonic attenuation and velocity properties in rat liver as a function of fat concentration: A study at 100 MHz using a scanning laser acoustic microscope,” J. Acoust. Soc. Am. 77, 307–313 (1985). 10.1121/1.392229 [DOI] [PubMed] [Google Scholar]
- Maruvada S., Shung K. K., and Wang S.-H., “High frequency backscatter and attenuation measurements of selected bovine tissue between 10 and 30 MHz” Ultrasound Med. Biol. 26, 1043–1049 (2000). 10.1016/S0301-5629(00)00227-1 [DOI] [PubMed] [Google Scholar]
- Kiss M. Z., Varghese T., and Kliewer M. A., “Ex vivo ultrasound attenuation coefficient for human cervical and uterine tissue from 5 to 10 MHz,” Ultrasonics 51, 467–471 (2011). 10.1016/j.ultras.2010.11.012 [DOI] [PMC free article] [PubMed] [Google Scholar]
- Lockwood G. R., Ryan L. K., Hunt J. W., and Foster F. S., “Measurement of the ultrasonic properties of vascular tissues and blood from 35–65 Mhz,” Ultrasound Med. Biol. 17, 653–666 (1991). 10.1016/0301-5629(91)90096-F [DOI] [PubMed] [Google Scholar]
- Kuc R. and Li H., “Reduced-order autoregressive modeling for center-frequency estimation,” Ultrason. Imaging 7 (1985). [DOI] [PubMed] [Google Scholar]
- Kuc R., Schwartz M., and Micsky L. V., “Parametric estimation of the acoustic attenuation coefficient slope for soft tissue,” in 1976 Ultrasonics Symposium (1976), pp. 44–47.
- Kuc R., “Estimating acoustic attenuation from reflected ultrasound signals: Comparison of spectral-shift and spectral-difference approaches,” IEEE Trans. Acoust., Speech, Signal Process. 32, 1–6 (1984). 10.1109/TASSP.1984.1164282 [DOI] [Google Scholar]
- Yao L. X., Zagzebski J. A., and Madsen E. L., “Backscatter coefficient measurements using a refernce phantom to extract depth-dependent instrumentation factors,” Ultrason. Imaging 12, 58–70 (1990). 10.1016/0161-7346(90)90221-I [DOI] [PubMed] [Google Scholar]
- Kuc R. and Schwartz M., “Estimating the acoustic attenuation coefficient slope for liver from reflected ultrasound signals,” IEEE Trans. Sonics Ultrason. 26, 353–361 (1979). 10.1109/T-SU.1979.31116 [DOI] [Google Scholar]
- Kuc R., “Clinical application of an ultrasound attenuation coefficient estimation technique for liver pathology characterization,” IEEE Trans. Biomed. Eng. BME-27, 312–319 (1980). 10.1109/TBME.1980.326739 [DOI] [PubMed] [Google Scholar]
- Kim H. and Varghese T., “Hybrid spectral domain method for attenuation slope estimation,” Ultrasound Med. Biol. 34, 1808–1819 (2008). 10.1016/j.ultrasmedbio.2008.04.011 [DOI] [PubMed] [Google Scholar]
- Insana M. F., Zagzebski J. A., and Madsen E. L., “Improvements in the spectral difference method for measuring ultrasonic attenuation,” Ultrason. Imaging 5, 331–345 (1983). [DOI] [PubMed] [Google Scholar]
- Labyed Y. and Bigelow T. A., “A theoretical comparison of attenuation measurement techniques from backscatter ultrasound echoes,” J. Accoust. Soc. Am. 129, 2316–2324 (2011). 10.1121/1.3559677 [DOI] [PMC free article] [PubMed] [Google Scholar]
- Labyed Y. and Bigelow T. A., “Estimating the total ultrasound attenuation along the propagation path by using a reference phantom,” J. Acoust. Soc. Am. 128, 3232–3238 (2010). 10.1121/1.3483739 [DOI] [PMC free article] [PubMed] [Google Scholar]
- Bigelow T. A., Oelze M. L., and W. D.O’Brien, Jr., “Estimation of total attenuation and scatterer size from backscattered ultrasound waveforms,” J. Acoust. Soc. Am. 117, 413–423 (2005). 10.1121/1.1858192 [DOI] [PubMed] [Google Scholar]
- Nam K., Zagzebski J. A., and Hall T. J., “Simultaneous backscatter and attenuation estimation using a least square method with constraints,” Ultrasound Med. Biol. 37, 2096–2104 (2011). 10.1016/j.ultrasmedbio.2011.08.008 [DOI] [PMC free article] [PubMed] [Google Scholar]
- Fink M., Hottier F., and Cardoso J. F., “Ultrasonic signal processing for invivo attenuation measurement: short time Fourier analysis,” Ultrason. Imaging 5, 117–135 (1983). 10.1016/0161-7346(83)90014-7 [DOI] [PubMed] [Google Scholar]
- He P. and Greenleaf J. F., “Application of stochastic analysis of ultrasonic echoes-estimation of attenuation and tissue heterogeneity from peaks of echo envelope,” J. Accoust. Soc. Am. 79, 526–534 (1986). 10.1121/1.393540 [DOI] [PubMed] [Google Scholar]
- He P. and Greenleaf J. F., “Attenuation estimation on phantoms—A stability study,” Ultrason. Imaging 8, 1–10 (1986). 10.1016/0161-7346(86)90019-2 [DOI] [PubMed] [Google Scholar]
- Jang H. S., Song T. K., and Park S. B., “Ultrasound attenuation estimation in soft tissue using the entropy difference of pulsed echoes between two adjacent envelope segments,” Ultrason. Imag. 10, 248–264 (1988). 10.1016/0161-7346(88)90118-6 [DOI] [PubMed] [Google Scholar]
- Knipp B. S., Zagzebski J. A., Wilson T. A., Dong F., and Madsen E. L., “Attenuation and backscatter estimation using video signal analysis applied to b-mode images,” Ultrason. Imaging 19, 221–233 (1997). [DOI] [PubMed] [Google Scholar]
- Rice S. O., “Mathematical analysis of random noise,” Bell Syst. Tech. J. 23, 282–332 (1944). [Google Scholar]
- Rice S. O., “Mathematical analysis of random noise,” Bell Syst. Tech. J. 24, 46–108 (1945). [Google Scholar]
- Flax S. W., Pelc N. J., Glover G. H., Gutman F. D., and McLachlan M., “Spectral characterization and attenuation measurements in ultrasound,” Ultrason. Imaging 5, 95–116 (1983). 10.1016/0161-7346(83)90013-5 [DOI] [PubMed] [Google Scholar]
- Ghoshal G., Turner J. A., and Weaver R. L., “Wigner distribution of a transducer beam pattern within a multiple scattering formalism for heterogeneous solids,” J. Acoust. Soc. Am. 122, 2009–2021 (2007). 10.1121/1.2773989 [DOI] [PubMed] [Google Scholar]
- Ghoshal G. and Turner J. A., “Diffuse ultrasonic ackscatter at normal incidence through a curved interface,” J. Acoust. Soc. Am. 128, 3449–3458 (2010). 10.1121/1.3500683 [DOI] [PubMed] [Google Scholar]
- O’Neil H. T., “Theory of focusing radiators,” J. Accoust. Soc. Am. 21, 516–526 (1949). 10.1121/1.1906542 [DOI] [Google Scholar]
- Schmerr L. W., “A multigaussian ultrasonic beam model for high performance simulation on a personal computer,” Mater. Eval. 58, 882–888 (2000). [Google Scholar]
- Schmerr L. W. and Song S. J., Ultrasonic Nondestructive Evaluation System (Springer, New York, 2007), Chap. 9. [Google Scholar]
- Jensen J. and Svendsen N. B., “Calculation of pressure fields from arbitrarily shaped, apodized, and excited ultrasound transducers,” IEEE Trans. Ultrason. Ferroelectr. Freq. Control 39, 262–267 (1992). 10.1109/58.139123 [DOI] [PubMed] [Google Scholar]
- Jensen J. A., “Field: A program for simulating ultrasoud system,” Med. Biol. Eng. Comput. 34, 351–353 (1996). 10.1007/BF02520003 [DOI] [PubMed] [Google Scholar]
- Wear K. A., Stiles T. A., Frank G. R., Madsen E. L., Cheng F., Feleppa E. J., Hall C. S., Kim B. S., Lee P., W. D.O’Brien, Jr., Oelze M. L., Raju B. I., Shung K. K., Wilson T. A., and Yuan J. R., “Interlaboratory comparison of ultrasonic backscatter coefficint measurements from 2 to 9 MHz” J. Ultrasound Med. 24, 1235–1250 (2005). [DOI] [PubMed] [Google Scholar]
- King J. L., Miller R. J., J. P.Blue, Jr., W. D.O’Brien, Jr., and J. W.Erdman, Jr., “Inadequate dietary magnesium intake increases atherosclerotic plaque development in rabbits,” Nutrition Res. 29, 343–349 (2009). 10.1016/j.nutres.2009.05.001 [DOI] [PMC free article] [PubMed] [Google Scholar]
- Madsen E. L., Dong F., Frank G. R., Gara B. S., Wear K. A., Wilson T., Zagzebski J. A., Miller H. L., Shung K. K., Wang S. H., Feleppa E. J., Liu T., W. D.O’Brien, Jr., Topp K. A., Sanghvi N. T., Zaitsen A. V., Hall T. J., Fowlkes J. B., Kripfgans O. D., and Miller J. G., “Interlaboratory comparison of ultrasonic backscatter, attenuation and speed measurements,” J. Ultrasound Med. 18, 615–631 (1999). [DOI] [PubMed] [Google Scholar]
- Wear K. A., Laib A., Stuber A. P., and Reynolds J. C., “Comparison of measurements of phase velocity in human calcaneus to biot theory,” J. Acoust. Soc. Am. 117, 3319–3324 (2005). 10.1121/1.1886388 [DOI] [PMC free article] [PubMed] [Google Scholar]


