Abstract
Protein kinase B (AKT) and glycogen synthase kinase-3β (GSK-3β) are major components of insulin-AKT signaling that plays crucial roles in various types of tissue. Recent studies found that these two kinases are modified posttranslationally by O-GlcNAcylation. Here, we demonstrate that O-GlcNAcylation regulated phosphorylation/activation of AKT and GSK-3β in different manners in kidney HEK-293FT cells, but did not affect these two kinases in hepatic HepG2 cells. In neuronal cells, O-GlcNAcylation regulated phosphorylation of AKT negatively, but had no effect on GSK-3β. These results suggest protein-specific and cell type–specific regulation of AKT and GSK-3β by O-GlcNAcylation. Therefore, studies on the roles of AKT and GSK-3β O-GlcNAcylation should be done in a tissue- and cell type–specific manner.
Keywords: AKT, GSK-3β, O-GlcNAcylation, phosphorylation, cell types
1. Introduction
Protein kinase B (AKT) and glycogen synthase kinase-3 (GSK-3β) are two major components of the insulin-AKT signaling pathway that plays crucial roles in diverse aspects, such as regulation of metabolism, energy homeostasis, and cell proliferation and death, especially in liver, muscle, kidney, and brain. When the signaling pathway is activated, AKT is activated through its phosphorylation at Thr308 and Ser473, which in turn inhibits GSK-3β through phosphorylating it at Ser9. Thus, activation of insulin-AKT signaling executes diverse biological actions by inhibition of GSK-3β activity.
Protein O-GlcNAcylation is a unique type of protein glycosylation that refers to the enzymatic transfer of β-N-acetylglucosamine (GlcNAc) from UDP-GlcNAc donor to the hydroxyl group of serine/threonine residues of proteins via an O-glycosidic bond [1]. This process is catalyzed by O-linked N-acetylglucosamine transferase, or O-GlcNAc transferase (OGT). O-GlcNAc on proteins can also be removed with the catalysis of β-N-acetylglucosaminidase, or O-GlcNAcase (OGA). Protein O-GlcNAcylation is regulated dynamically by these two enzymes and the intracellular concentration of UDP-GlcNAc. Many studies have demonstrated that O-GlcNAcylation is ubiquitous in living systems and regulates numerous cellular signaling and functions, including transcription, translation, protein degradation, cell signaling, cell trafficking, apoptosis, and cell cycle control [2,3]. In many cases, O-GlcNAcylation regulates protein function via modulating the phosphorylation of the protein. All O-GlcNAcylated proteins that have been identified so far are also phosphoproteins. In some proteins, O-GlcNAcylation and phosphorylation competitively modify the same serine/threonine residues and are thus reciprocal to each other [2].
It was demonstrated recently that AKT and GSK-3β are modified by O-GlcNAc [4], suggesting that O-GlcNAc may regulate insulin-AKT signaling. Increased O-GlcNAcylation has been shown to induce insulin resistance [5–7], but contradictory studies have also been reported [8–10]. The exact role of O-GlcNAcylation in the regulation of AKT and GSK-3β remains elusive. In particular, the cell type–specific regulation of these two kinases by O-GlcNAcylation has not been reported.
In this study, we employed both genetic and pharmacological approaches in various cell lines derived from kidney, liver or brain and demonstrated that AKT and GSK-3β activation was regulated by O-GlcNAcylation in a cell type–specific manner.
2. Materials and methods
2.1. Plasmids, Antibodies and reagents
Mammalian expression vector pCMV-Entry-hOGT1 was bought from Origene Company (Rockville, MD). The primary antibodies used in this study are listed in Table 1. Peroxidase-conjugated anti-mouse and anti-rabbit IgG were obtained from Jackson ImmunoResearch Laboratories (West Grove, PA). ECL Kit was from Amersham Pharmacia (Amersham Bioscience, Piscataway, NJ). PUGNAc was obtained from Toronto Research Chemicals (North York, ON, Canada), and thiamet-G was from Cayman Chemical (Ann Arbor, MI). Insulin and other reagents were bought from Sigma-Aldrich (St. Louis, MO).
Table 1.
Primary antibodies employed in this study
| Antibody | Type | Specificity | Protein Loaded (μg) | Dilution | Source/Reference |
|---|---|---|---|---|---|
| RL2 | Mono- | O-GlcNAc | 10 | 1:2000 | Affinity Bioreagents, Golden, CO, USA |
| CTD110.6 | Mono- | O-GlcNAc | 10 | 1:2000 | Covance, Emeryville, CA, USA |
| Anti-OGT (TI-14) | Poly- | OGT | 5 | 1:2000 | Sigma Aldrich, St. Louis, MO, USA |
| Anti-AKT | Poly- | AKT | 1 | 1:1000 | Cell Signaling Technology, MA, USA |
| Anti-AKT-pT308 | Poly- | AKT-pT308 | 30–50 | 1:500 | Cell Signaling Technology |
| Anti-AKT-pS473 | Poly- | AKT-pS473 | 10 | 1:1000 | Cell Signaling Technology |
| Anti-GSK-3β | Mono- | GSK-3β | 1 | 1:1000 | Cell Signaling Technology |
| Anti-GSK-3β-pS9 | Poly- | GSK-3β-pS9 | 5 | 1:1000 | Cell Signaling Technology |
| Anti-GSK-3α/β | Poly- | Anti-GSK-3α/β | 1 | 1:1000 | Cell Signaling Technology |
| Anti-GSK-3α/β-pS21/9 | Poly- | Anti-GSK-3α/β-pS21/9 | 5 | 1:1000 | Cell Signaling Technology |
| Anti-FoxO1-pS256 | Poly- | FoxO1-pS256 | 20 | 1:1000 | Cell Signaling Technology |
| Anti-FoxO1 | Poly- | FoxO1 | 5 | 1:1000 | Cell Signaling Technology |
| Anti-β-Catenin-pS33/37/T41 | Poly- | β-Catenin-pS33/37/T41 | 10 | 1:1000 | Cell Signaling Technology |
| Anti-β-Catenin | Poly- | β-Catenin | 5 | 1:1000 | Cell Signaling Technology |
| Anti-GAPDH | Poly- | GAPDH | 1 | 1:2000 | Santa Cruz, CA, USA |
2.2. Cell culture, transfection, and RNA interference
HEK-293FT, HepG2, and N2a cells (all purchased from American Type Culture Collection, Manassas, VA) were maintained in Dulbecco's modified Eagle's medium (DMEM) supplemented with 10% fetal bovine serum (Invitrogen, Carlsbad, CA) at 37°C. Mouse primary hippocampal neuronal cells were prepared from hippocampi of embryonic C57B6 mice (E16). Cells were plated (50,000 cells/m2) in poly-D-lysine–coated flasks (BD Falcon, Franklin Lakes, NJ) and cultured in Neurobasal medium containing 2% B-27 supplement, 50 μg/ml gentamycin, and 2 mM L-glutamine (Invitrogen). Cultures were kept at 37°C in a moist atmosphere (5% CO2). Half of the medium was replaced by fresh medium every 3 days, and 7-day-old cultures were used in this study. The use of mice was carried out in strict accordance with the recommendations in the Guide for the Care and Use of Laboratory Animals of the National Institutes of Health. The protocol was approved by the Institutional Animal Care and Use Committee of the New York State Institute for Basic Research in Developmental Disabilities. All surgery was performed under anesthesia, and all efforts were made to minimize suffering.
Transfection was performed in triplicates with FuGENE-6 (Roche Diagnostics, Indianapolis, IN) in 12-well plates. The cells were transfected by using FuGENE-6 for 48 hr according to the manufacturer's instructions. For knock-down of OGT expression, we used SureSilencing shRNA plasmids for human OGT (SA Bioscience, Frederick, MD). They were designed to target CCAAGGACGATACTGAAAGTT (shOGT1) and AGATCTTCGAACAGCCAGAAT (shOGT2) of the human OGT under the control of the U1 promoter and the GFP gene. shRNA with the sequences (CCATCGCCAAGCTGATTAAAT) was used to be a negative control.
2.3. Immunoprecipitation
Cells were washed twice with PBS, and lysed with the lysate buffer (50 mM Tris-HCl, pH 7.4, 150 mM NaCl, 50 mM NaF, 1 mM Na3VO4, 0.5% Triton-X 100, 2 mM EDTA, 5 mM AEBSF, 10 μg/ml aprotinin, 10 μg/ml leupeptin and 10 μg/ml pepstatin). Insoluble materials were removed by a brief centrifugation, and the supernatants were incubated with the indicated antibody pre-coupled onto protein G beads at 4°C for 4 hr. The beads were washed with lysate buffer twice and then with TBS twice. The bound proteins were eluted by boiling them in Laemmlie sample buffer. The samples were analyzed by Western blots.
2.4. Western blots
Cultured cells in 12-well plates were lysed in 250 μl Laemmli buffer (125 mM Tris-HCl, pH 6.8, 4% SDS, 20% glycerol, 2% β-mercaptoethanol, and 0.005% bromophenal blue), followed by heating in boiling water for 5 min. Protein concentrations of the samples were determined by using a modified Lowry method [11]. The levels of specific proteins and their phosphorylation were determined by Western blots using 10% sodium dodecyl sulfate–polyacrylamide gel electrophoresis (SDS-PAGE). The blots were developed using ECL and then quantified densitometrically using the Molecular Imager System (Bio-Rad, Hercules, CA).
2.5. Statistical Analysis
Where appropriate, the data are presented as mean ± SD. Data points were compared by the unpaired two-tail student's t test.
3. Results
3.1. AKT and GSK-3β are modified by O-GlcNAc
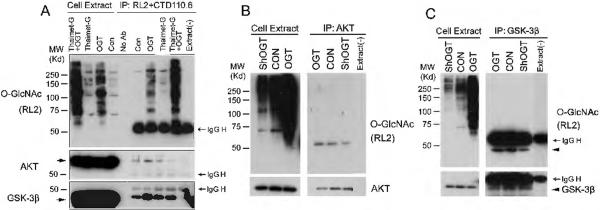
We first confirmed the O-GlcNAc modification of AKT and GSK-3β. HEK-293FT cells were first transfected with OGT and/or treated with thiamet-G, a selective O-GlcNAcase inhibitor, to elevate global protein O-GlcNAcylation, followed by immunoprecipitation of O-GlcNAcylated proteins from the cell lysate using a mixture of two O-GlcNAc antibodies, RL2 and CTD110.6. The amounts of O-GlcNAcylated AKT and GSK-3β were then determined by Western blots. The RL2 blot indicated (i) that thiamet-G treatment increased the global protein O-GlcNAcylation level slightly, whereas OGT transfection increased it dramatically, and (ii) that the O-GlcNAcylated proteins were successfully immunoprecipitated (Fig. 1A). AKT and GSK-3β were found in the immunoprecipitates, suggesting that they are O-GlcNAcylated or co-immuno-precipitated with other O-GlcNAcylated proteins under this condition. Increased amounts of AKT and GSK-3β in the immunoprecipitates after OGT transfection and thiamet-G treatment indicated that the immuno-complex responded to elevated global level of O-GlcNAcylation in the cells.
Fig. 1.
Detection of O-GlcNAcylation of AKT and GSK-3β. (A) HEK-293FT cells were transfected with OGT for 36 hr and then treated with 25 μM thiamet-G for 12 hr. The OGlcNAcylated proteins were immunoprecipitated from the cell lysate using a mixture of two antibodies, RL2 and CTD110.6, and detected by Western blots developed with RL2. (B,C) AKT (B) and GSK-3β (C) were immunoprecipitated from the lysates of HEK-293FT cells after transfection with OGT or shOGT for 48 hr, and O-GlcNAcylation level was detected by Western blots developed with RL2. As a control, a buffer instead of cell extracts was added(right lane). The AKT (B) and GSK-3β (C) blots were included to confirm the success of immunoprecipitation.
To verify the O-GlcNAc modification of AKT and GSK-3β, we immunoprecipitated AKT and GSK-3β from the lysate of HEK-293FT cells after transfection with OGT to elevate or with shOGT to reduce O-GlcNAcylation and detected their O-GlcNAcylation level with RL2 antibody. We observed (i) that both AKT and GSK-3β were modified by O-GlcNAc and (ii) that OGT expression increased and OGT knockdown decreased the O-GlcNAcylation of AKT and GSK-3β (Fig. 1B, 1C). These results further confirmed marked modifications of AKT and GSK-3β with O-GlcNAc.
3.2. O-GlcNAcylation regulates AKT and GSK-3β phosphorylation in kidney HEK-293FT cells
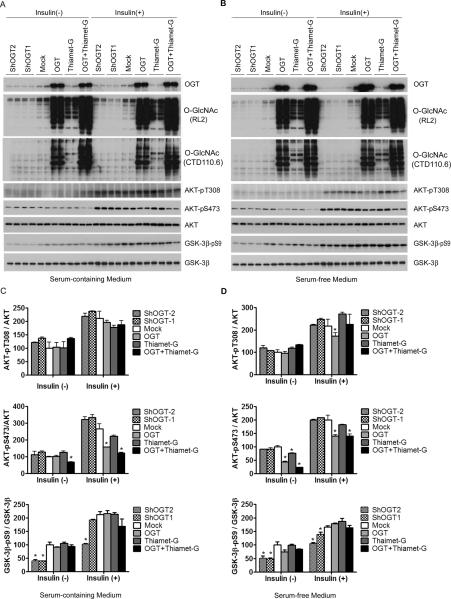
To investigate the functional impact of O-GlcNAcylation on AKT, we studied phosphorylation of AKT at Thr308 and Ser473, which determine its kinase activity, in HEK-293FT cells transfected with OGT or shOGT in combination with thiamet-G treatment. We also treated the cells with insulin while they were cultured in normal or serum-free medium to stimulate the insulin-AKT signaling pathway, which allowed a bigger window for investigating the effects of O-GlcNAcylation on this pathway. As expected, insulin treatment stimulated phosphorylation of AKT at Thr308 and Ser473 and of GSK-3β at Ser9 dramatically under both culture conditions (Fig. 2). We found that OGT overexpression led to a dramatic elevation of O-GlcNAcylation that was accompanied by a marked decrease in Ser473 phosphorylation of AKT under both culture conditions and either with or without insulin stimulation (Fig. 2). A decrease in Thr308 phosphorylation of AKT was seen only after cells were cultured under serum-free medium and after insulin stimulation. Thiamet-G also induced a marked increase in O-GlcNAcylation, but it failed to induce any significant changes of AKT phosphorylation at either site, although an additive effect with OGT expression was evident under basal conditions. Knockdown of OGT did not result in any significant change in AKT phosphorylation, probably due to a low level of AKT O-GlcNAcylation in these cells without OGT over-expression. None of the OGT expression or knockdown or thiamet-G treatment affected the level of AKT in these cells.
Fig. 2.
Regulation of AKT and GSK-3β phosphorylation by O-GlcNAcylation in HEK-293FT cells. (A,B) HEK-293FT cells cultured in normal or serum-free medium were transfected with OGT or shOGT for 36 hr, followed by treatment with 25 μM thiamet-G for 12 hr. Then some cells were also treated with 100 nM insulin for 30 min. The levels of OGT, O-GlcNAc, AKT, and GSK-3β and their phosphorylation were determined by Western blots developed with antibodies indicated at the right side of each blot. (C,D) Densitometric quantifications of AKT-pT308, AKT-pS473, and GSK-3β-pS9 after normalization by the kinase levels (from ATK and GSK-3β blots, respectively). Data are presented as mean ±SD. * p<0.05 vs. the mock transfection control group.
Knockdown of OGT significantly decreased phosphorylation of GSK-3β at Ser9 when the cells were cultured under both media and with or without insulin stimulation. However, neither OGT over-expression nor thiamet-G treatment resulted in any significant changes of GSK-3β phosphorylation (Fig. 2).
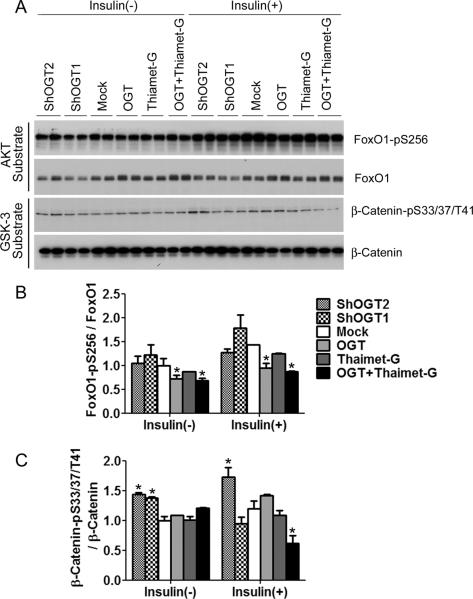
To learn the functional consequences of the altered phosphorylation/activation of AKT and GSK-3β in response to the alterations of O-GlcNAcylation in HEK-293FT cells, we investigated the downstream targets of these two kinases. AKT activation can prevent cellular apoptosis through phosphorylation of the transcription factor Forkhead box protein O1 (FoxO1) [12]. We found that OGT overexpression decreased FoxO1 phosphorylation level at Serine 256 site both with and without insulin stimulation (Fig. 3). These results are consistent with the increased O-GlcNAcylation and decreased phosphorylation/activity of AKT with OGT overexpression (Fig. 2B,D). GSK-3β phosphorylates and regulates β-catenin's activity in the regulation of cell growth [13]. We found that OGT knockdown significantly increased phosphorylation of β-catenin both with and without insulin stimulation (Fig. 3), which is consistent with the decrease of Ser9 phosphorylation of GSK-3β and thus increase in its kinase activity under these conditions (Fig. 2B,D). These data suggest that the regulation of phosphorylation/activation of AKT and GSK-3β has functional consequences.
Fig. 3.
Phosphorylation of AKT and GSK-3β substrates after alteration of O-GlcNAcylation in HEK-293FT cells. (A) HEK-293FT cells cultured in serum-free medium were transfected with OGT or shOGT for 36 hr, followed by treatment with 25 μM thiamet-G for 12 hr. Some cells were then also treated with 100 nM insulin for 30 min. The levels of AKT substrate FoxO1 and GSK-3β substrate β-Catenin and their phosphorylation were determined by Western blots. (B,C) Densitometric quantifications of FoxO1-pS256 and β-CateninpS33/37/T41 after normalization by the total protein levels. Data are presented as mean ±SD. * p<0.05 vs. the mock transfection control group.
3.3. O-GlcNAcylation does not regulate AKT or GSK-3β phosphorylation in hepatic HepG2 cells
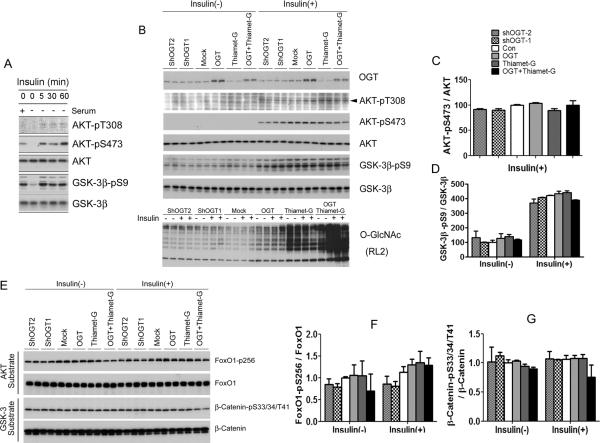
To investigate whether O-GlcNAcylation also regulates phosphorylation/activation of AKT and GSK-3β in other types of cells as in HEK-293FT cells, we first selected HepG2 cells (human hepatocellular carcinoma cells), because the liver is a glucose sensor and plays an important role in regulating glucose homeostasis. We took the same approach as used for HEK-293FT cells and observed that insulin stimulation for 5–60 min increased phosphorylation of AKT and GSK-3β markedly (Fig. 4A,B). We found that, unlike HEK293FT cells, neither over-expression of OGT or shOGT nor thiamet-G treatments led to alterations of phosphorylation or the levels of AKT and of GSK-3β in HepG2 cells, although OGT over-expression and thiamet-G treatment increased O-GlcNAcylation in HepG2 cells (Fig. 4B–D). We also studied FoxO1, a downstream target of AKT, and β-catenin, a downstream target of GSK-3β, and found no significant change of their phosphorylation upon alteration of O-GlcNAcylation (Fig. 4E–G). These results suggest that the phosphorylation/activation of AKT and GSK-3β in liver cells might not be regulated by O-GlcNAcylation.
Fig. 4.
Phosphorylation and activity of AKT and GSK-3β after alterations of OGlcNAcylation in HepG2 cells. (A) HepG2 cells were treated with 100 nM insulin for 0, 5, 30 or 60 min, and the levels of AKT and GSK-3β and their phosphorylation were determined by Western blots. (B) HepG2 cells cultured in serum-free medium for 12 hr were transfected with OGT or shOGT for 36 hr, followed by treatment with 25 μM thiamet-G for 12 hr. Then some cells were also treated with 100 nM insulin for 30 min. The levels of OGT, O-GlcNAc, AKT, and GSK-3β as well as their phosphorylation were determined by Western blots. (C,D) Densitometric quantifications of AKT-pS473 and GSK-3β-pS9 after normalization by the kinase levels (from ATK and GSK-3β blots, respectively). AKT-pT308 was not quantified because of the weak immuno signals with high backgrounds. (E) The levels of AKT substrate FoxO1 and GSK-3β substrate β-catenin and their phosphorylation were determined by Western blots. (F,G) Densitometric quantifications of FoxO1-pS256 and β-CateninpS33/37/T41 after normalization by the total protein levels. Data are presented as mean ± SD. * p<0.05 vs. the mock transfection control group.
3.4. O-GlcNAcylation regulates phosphorylation of AKT negatively, but has no effect on GSK-3, in neuronal cells
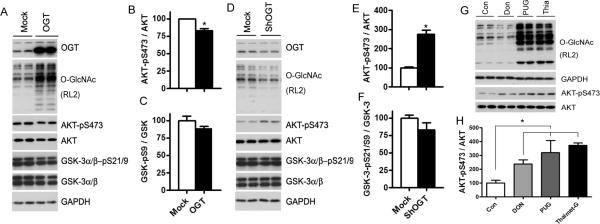
We next investigated the regulation of phosphorylation/activation of AKT and GSK-3β by O-GlcNAc in a neuroblastoma cell line, N2a cells, because both O-GlcNAcylation and OGT are abundant in the brain. We found that OGT overexpression resulted in decreased Ser473 phosphorylation of AKT, whereas OGT knockdown led to increased Ser473 phosphorylation of AKT (Fig. 5A–F), suggesting a negative regulation of AKT phosphorylation/activation by O-GlcNAcylation. Phosphorylation of AKT at Thr308 was not detectable in N2a cells under any conditions we tested, probably due to a very low phosphorylation level at this site under these conditions (data not shown). However, phosphorylation of GSK-3α at Ser21 or GSK-3β at Ser9, as detected by using an antibody against both GSK-3α and GSK-3β, was not significantly altered when O-GlcNAcylation was either up-regulated by OGT overexpression or down-regulated by shOGT expression. When N2a cells were treated with DON to inhibit the intracellular synthesis of UDP-GlcNAc, we observed decreased O-GlcNAcylation and a concurrent increase in Ser473 phosphorylation of AKT (Fig. 5G, H), confirming the negative regulation of AKT phosphorylation by O-GlcNAcylation. However, when N2a cells were treated with the O-GlcNAcase inhibitors thiamet-G or PUGNAc to increase O-GlcNAcylation level, we also found increased Ser473 phosphorylation of AKT, suggesting that these two O-GlcNAcase inhibitors may have additional, stronger actions that oppose the effect of increased O-GlcNAcylation on Ser473 phosphorylation of AKT.
Fig. 5.
Regulation of AKT but not GSK-3 by O-GlcNAcylation in N2a cells. (A–F) N2a cells were transfected with OGT (A) or shOGT (D) for 48 hrs, and the cell lysates were analyzed by Western blots. Densitometric quantifications of the blots are shown on the right sides of the blots (B, C, E, F). (G) Western blots of the lysates of N2a cells after treatment with Don, PUGNAc or thiamet-G for 12 hrs. (H) Densitometrical quantifications of AKT-pS473 from the panel G. Data are presented as mean ±SD. * p<0.05 vs. the control group.
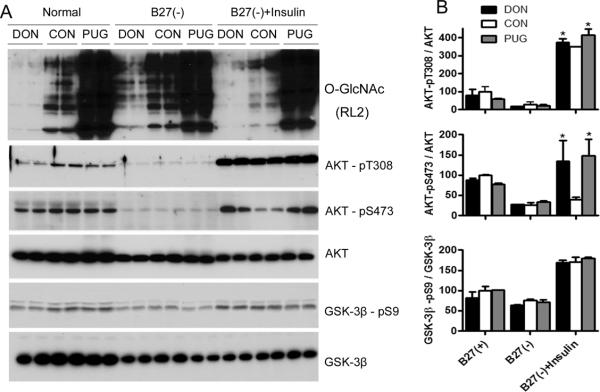
We also studied the regulation of phosphorylation/activation of AKT and GSK-3β by O-GlcNAc in primary mouse hippocampal neuronal cells. To get a wide window to observe the regulation, we depleted B-27 supplements from the standard culture medium and added insulin to stimulate the cells in addition to the normal culture condition. As expected, depletion of B-27 down-regulated phosphorylation of AKT and GSK-3β, whereas insulin treatment activated the phosphorylation dramatically (Fig. 6A). In consistent with our expectation, we found that DON and PUGNAc treatments decreased and increased O-GlcNAcylation, respectively. Although these treatments did not alter the phosphorylation of either AKT or GSK-3β under basal culturing conditions, DON treatment enhanced insulin-induced phosphorylation of AKT at both Ser473 and Thr308 in the hippocampal neuronal cells (Fig. 6). However, the phosphorylation of GSK-3β at Ser9 was not affected by either DON or PUGNAc treatments. As seen in N2a cells, PUGNAc also led to a marked increase in Ser473 phosphorylation of AKT in the primary mouse hippocampal neuronal cells. These results suggest similar regulations of AKT phosphorylation/activation by O-GlcNAcylation in primary mouse hippocampal neuronal cells as in N2a cells.
Fig. 6.
Regulation of AKT but not GSK-3 by O-GlcNAcylation in primary mouse hippocampal neuronal cells. Primary hippocampal neuronal cells were cultured in Neurobasal medium supplemented with 2% B27 for seven days, followed by depletion of B27 or treatment with 50 μM DON or 100 μM PUGNAc for 12 hrs. Then, the cells were treated with 100 nM insulin for 30 min before being harvested. (A) Western blots of the cell lysates developed with antibodies indicated. (B) Densitometric quantifications of the blots shown in A. Data are presented as mean ±SD. * p<0.05 vs. the control group.
4. Discussion
O-GlcNAc has been found to modify AKT [5,14] and GSK-3β [15] in recently, suggesting that O-GlcNAc modification may regulate their phosphorylation/activities. In the present study, we demonstrated that AKT and GSK-3β were regulated by O-GlcNAcylation in a cell type–specific manner. By investigating in cell lines derived from kidney, liver, and brain, we found that the effects of O-GlcNAcylation on phosphorylation/activation of AKT and GSK-3β were very different in different types of cells. In HEK-293FT cells that were derived from human embryonic kidney cells transformed with the SV40 large T antigen, elevated O-GlcNAcylation as the result of OGT overexpression led to decreased phosphorylation of AKT at Ser473 and Thr308. These results suggest that these serine and threonine residues might be O-GlcNAcylated. The exact sites of AKT O-GlcNAcylation have not yet been mapped. When OGT was knocked down by using shOGT, we did not observe any significant alterations of AKT phosphorylation. This was probably due to a relatively low level of AKT O-GlcNAcylation in these cells under the basal condition, and thus OGT knockdown induced a much smaller change of O-GlcNAcylation than that induced by OGT overexpression, as shown in Figure 2. Such a small decrease in O-GlcNAcylation might be unable to cause a detectable increase in AKT phosphorylation.
The effects of O-GlcNAcylation on Ser9 phosphorylation of GSK-3β was apparently opposite to those on AKT phosphorylation in HEK293-FT cells. We observed no significant changes of GSK-3β phosphorylation upon OGT overexpression, but a marked decrease upon OGT knockdown. These results suggest that O-GlcNAcylation may regulate GSK-3β Ser9 phosphorylation positively, which is consistent with the potential role of elevated O-GlcNAcylation in inducing insulin resistance [5–7,16]. The positive regulation of GSK-3β Ser9 phosphorylation by O-GlcNAcylation also excludes the possibility of GSK-3β O-GlcNAcylation at Ser9. Otherwise, a negative and reciprocal regulation would be expected. The failure of OGT overexpression to induce an increase in GSK-3β Ser9 phosphorylation probably resulted from an O-GlcNAcylation-induced reduction of AKT phosphorylation/activation that could have opposed and diminished the direct effect of O-GlcNAcylation on Ser9 phosphorylation of GSK-3β.
It is surprising to observe no significant changes in phosphorylation of AKT or GSK-3β with either overexpression or knockdown of OGT in HepG2 cells, which were derived from human hepatocellular carcinoma. However, Soesanto et al. observed an increase in AKT phosphorylation at Thr308 and Ser473 and GSK-3β phosphorylation at Ser9 in HepG2 cells after adenoviral-mediated overexpression of OGA [17]. The apparent discrepancy might be that the viral vector induced very high expression of OGA that had modulated O-GlcNAcylation of AKT and GSK-3β to an extent that was not seen in the present study.
Recent studies have suggested that insulin-AKT signaling also regulates glucose metabolism in the brain and plays an important role in neural development and neuronal activities and affects learning and memory [18]. The role of brain insulin dysfunction in AD has been reported [19,20]. AD has, in fact, been referred to as “type 3 diabetes” [4,21,22]. We have recently demonstrated a decrease in brain O-GlcNAcylation in AD and proposed its contribution to neurodegeneration via promoting abnormal hyperphosphorylation of tau [23–26]. Whether and how O-GlcNAcylation regulates insulin-AKT signaling in the neuron has not been reported. By using overexpression and knockdown/inhibition of OGT in both N2a and primary mouse hippocampal neuronal cells, we found in the present study a negative regulation of AKT phosphorylation by O-GlcNAcylation in the neuron.
Negative regulation of AKT phosphorylation/activation by O-GlcNAcylation has been reported in several types of cells. In 3T3-L1 adipocytes, insulin-stimulated O-GlcNAcylation of AKT inhibits its phosphorylation at Thr308, which shuts down its kinase activity and down-regulates its signaling [5,16]. In endothelial cells, the O-GlcNAcylation level of AKT correlates with reduced AKT activity and phosphorylation at Ser473 [27]. In β-pancreatic cells, increased O-GlcNAc and decreased Ser473 phosphorylation of AKT are observed upon glucosamine treatments that increase O-GlcNAcylation levels [28]. In high glucose–exposed mesangial cells following OGT shRNA expression, elevation of Thr308 and Ser473 phosphorylation of AKT is also seen [29]. The present study shows this negative regulation of AKT phosphorylation/activation by O-GlcNAcylation in the kidney cells and neurons, but not in the hepatocytes.
It is interesting to note that although both OGT overexpression and thiamet-G treatment led to a marked increase in global O-GlcNAcylation, thiamet-G–induced elevation of O-GlcNAcylation did not result in any decrease in AKT phosphorylation as OGT overexpression did in HEK293-FT cells. Furthermore, increased global O-GlcNAcylation due to inhibition of OGA with thiamet-G or PUGNAc even increased AKT phosphorylation in neuronal cells. Consistent with the present study, a previous study showed that PUGNAc treatments did not attenuate IGF-1–induced AKT phosphorylation in neuroblastoma SHSY5Y cells [30]. A possible underlying reason for this is that unlike OGT overexpression, inhibition of OGA may not lead to increased O-GlcNAcylation of AKT, although it does for numerous other proteins. This is supported by our observation that OGT overexpression, but not thiamet-G treatment, led to increased AKT O-GlcNAcylation in HEK293-FT cells (Fig. 1A). This possibility is consistent with a probably more regulatory role of OGT than OGA in AKT O-GlcNAcylation, because OGT is recruited together with AKT to the cytoplasmic membrane upon induction of insulin signaling, where OGT has direct access to AKT and catalyzes its O-GlcNAcylation [5]. The differential roles of OGT and OGA in regulation of AKT O-GlcNAcylation might partially explain the contradictory conclusions in the literature of whether elevated O-GlcNAcylation promotes insulin resistance. The OGA inhibitors might also have additional functions that activate the upstream kinase activity of AKT, which in turn might lead to AKT phosphorylation in neuronal cells.
In conclusion, the present study demonstrates protein-specific and cell type–specific regulation of AKT and GSK-3β by O-GlcNAcylation. Considering the diverse roles of insulin-AKT signaling in various organs and cells, we cannot assume that O-GlcNAcylation regulates this signaling in the same fashion. The role of O-GlcNAcylation in insulin resistance should be re-assessed in a tissue- and cell type–specific manner. The role of O-GlcNAcylation in neuronal physiology and neuroplasticity must be investigated in the neuron.
Highlights
AKT and GSK-β are modified by O-GlcNAcylation.
GlcNAcylation regulates AKT and GSK-3β differently in kidney HEK-293FT cells.
GlcNAcylation does not affect AKT and GSK-3β in hepatic HepG2 cells.
GlcNAcylation regulates phosphorylation of AKT negatively in neuronal cells.
Regulation of AKT and GSK-3β by O-GlcNAc is protein- and cell type–specific.
Acknowledgements
This work was supported in part by the New York State Office for People with Developmental Disabilities and Nantong University, as well as grants from the U.S. National Institutes of Health (R01 AG027429, R03 TW008123, R01 AG031969, and R01 AG019158), the Alzheimer's Association of U.S.A. (IIRG-10-170405), the National Natural Science Foundation of China (81030059, 30801202), the Jiangsu Natural Science Foundation (BK2011387), and the Jiangsu Higher Education Institution, China. We thank Ms. J. Murphy for secretarial assistance and Ms. M. Marlow for editorial suggestions.
Footnotes
Publisher's Disclaimer: This is a PDF file of an unedited manuscript that has been accepted for publication. As a service to our customers we are providing this early version of the manuscript. The manuscript will undergo copyediting, typesetting, and review of the resulting proof before it is published in its final citable form. Please note that during the production process errors may be discovered which could affect the content, and all legal disclaimers that apply to the journal pertain.
References
- [1].Hart GW. Dynamic O-linked glycosylation of nuclear and cytoskeletal proteins. Annu Rev Biochem. 1997;66:315–35. doi: 10.1146/annurev.biochem.66.1.315. [DOI] [PubMed] [Google Scholar]
- [2].Zeidan Q, Hart GW. The intersections between O-GlcNAcylation and phosphorylation: implications for multiple signaling pathways. J Cell Sci. 2010;123:13–22. doi: 10.1242/jcs.053678. [DOI] [PMC free article] [PubMed] [Google Scholar]
- [3].Hart GW, Housley MP, Slawson C. Cycling of O-linked beta-N-acetylglucosamine on nucleocytoplasmic proteins. Nature. 2007;446:1017–22. doi: 10.1038/nature05815. [DOI] [PubMed] [Google Scholar]
- [4].Lefebvre T, et al. Dysregulation of the nutrient/stress sensor O-GlcNAcylation is involved in the etiology of cardiovascular disorders, type-2 diabetes and Alzheimer's disease. Biochim Biophys Acta. 2010;1800:67–79. doi: 10.1016/j.bbagen.2009.08.008. [DOI] [PubMed] [Google Scholar]
- [5].Yang X, et al. Phosphoinositide signalling links O-GlcNAc transferase to insulin resistance. Nature. 2008;451:964–9. doi: 10.1038/nature06668. [DOI] [PubMed] [Google Scholar]
- [6].Dentin R, Hedrick S, Xie J, Yates J, 3rd, Montminy M. Hepatic glucose sensing via the CREB coactivator CRTC2. Science. 2008;319:1402–5. doi: 10.1126/science.1151363. [DOI] [PubMed] [Google Scholar]
- [7].McClain DA, Lubas WA, Cooksey RC, Hazel M, Parker GJ, Love DC, Hanover JA. Altered glycan-dependent signaling induces insulin resistance and hyperleptinemia. Proc Natl Acad Sci U S A. 2002;99:10695–9. doi: 10.1073/pnas.152346899. [DOI] [PMC free article] [PubMed] [Google Scholar]
- [8].Robinson KA, Ball LE, Buse MG. Reduction of O-GlcNAc protein modification does not prevent insulin resistance in 3T3-L1 adipocytes. Am J Physiol Endocrinol Metab. 2007;292:E884–90. doi: 10.1152/ajpendo.00569.2006. [DOI] [PMC free article] [PubMed] [Google Scholar]
- [9].Macauley MS, He Y, Gloster TM, Stubbs KA, Davies GJ, Vocadlo DJ. Inhibition of O-GlcNAcase using a potent and cell-permeable inhibitor does not induce insulin resistance in 3T3-L1 adipocytes. Chem Biol. 2010;17:937–48. doi: 10.1016/j.chembiol.2010.07.006. [DOI] [PMC free article] [PubMed] [Google Scholar]
- [10].Macauley MS, Shan X, Yuzwa SA, Gloster TM, Vocadlo DJ. Elevation of Global O-GlcNAc in rodents using a selective O-GlcNAcase inhibitor does not cause insulin resistance or perturb glucohomeostasis. Chem Biol. 2010;17:949–58. doi: 10.1016/j.chembiol.2010.07.005. [DOI] [PMC free article] [PubMed] [Google Scholar]
- [11].Bensadoun A, Weinstein D. Assay of proteins in the presence of interfering materials. Anal Biochem. 1976;70:241–50. doi: 10.1016/s0003-2697(76)80064-4. [DOI] [PubMed] [Google Scholar]
- [12].Brunet A, et al. Akt promotes cell survival by phosphorylating and inhibiting a Forkhead transcription factor. Cell. 1999;96:857–68. doi: 10.1016/s0092-8674(00)80595-4. [DOI] [PubMed] [Google Scholar]
- [13].Yost C, Torres M, Miller JR, Huang E, Kimelman D, Moon RT. The axis-inducing activity, stability, and subcellular distribution of beta-catenin is regulated in Xenopus embryos by glycogen synthase kinase 3. Genes Dev. 1996;10:1443–54. doi: 10.1101/gad.10.12.1443. [DOI] [PubMed] [Google Scholar]
- [14].Park SY, Ryu J, Lee W. O-GlcNAc modification on IRS-1 and Akt2 by PUGNAc inhibits their phosphorylation and induces insulin resistance in rat primary adipocytes. Exp Mol Med. 2005;37:220–9. doi: 10.1038/emm.2005.30. [DOI] [PubMed] [Google Scholar]
- [15].Wang Z, Pandey A, Hart GW. Dynamic interplay between O-linked N-acetylglucosaminylation and glycogen synthase kinase-3-dependent phosphorylation. Mol Cell Proteomics. 2007;6:1365–79. doi: 10.1074/mcp.M600453-MCP200. [DOI] [PubMed] [Google Scholar]
- [16].Vosseller K, Wells L, Lane MD, Hart GW. Elevated nucleocytoplasmic glycosylation by O-GlcNAc results in insulin resistance associated with defects in Akt activation in 3T3-L1 adipocytes. Proc Natl Acad Sci U S A. 2002;99:5313–8. doi: 10.1073/pnas.072072399. [DOI] [PMC free article] [PubMed] [Google Scholar]
- [17].Soesanto YA, Luo B, Jones D, Taylor R, Gabrielsen JS, Parker G, McClain DA. Regulation of Akt signaling by O-GlcNAc in euglycemia. Am J Physiol Endocrinol Metab. 2008;295:E974–80. doi: 10.1152/ajpendo.90366.2008. [DOI] [PMC free article] [PubMed] [Google Scholar]
- [18].Gerozissis K. Brain insulin, energy and glucose homeostasis; genes, environment and metabolic pathologies. Eur J Pharmacol. 2008;585:38–49. doi: 10.1016/j.ejphar.2008.01.050. [DOI] [PubMed] [Google Scholar]
- [19].Liu Y, Liu F, Grundke-Iqbal I, Iqbal K, Gong CX. Deficient brain insulin signalling pathway in Alzheimer's disease and diabetes. J Pathol. 2011;225:54–62. doi: 10.1002/path.2912. [DOI] [PMC free article] [PubMed] [Google Scholar]
- [20].Deng Y, Li B, Liu Y, Iqbal K, Grundke-Iqbal I, Gong CX. Dysregulation of insulin signaling, glucose transporters, O-GlcNAcylation, and phosphorylation of tau and neurofilaments in the brain: Implication for Alzheimer's disease. Am J Pathol. 2009;175:2089–98. doi: 10.2353/ajpath.2009.090157. [DOI] [PMC free article] [PubMed] [Google Scholar]
- [21].Kroner Z. The relationship between Alzheimer's disease and diabetes: Type 3 diabetes? Altern Med Rev. 2009;14:373–9. [PubMed] [Google Scholar]
- [22].Pilcher H. Alzheimer's disease could be “type 3 diabetes”. Lancet Neurol. 2006;5:388–9. doi: 10.1016/s1474-4422(06)70434-3. [DOI] [PubMed] [Google Scholar]
- [23].Liu Y, Liu F, Grundke-Iqbal I, Iqbal K, Gong CX. Brain glucose transporters, O-GlcNAcylation and phosphorylation of tau in diabetes and Alzheimer's disease. J Neurochem. 2009;111:242–9. doi: 10.1111/j.1471-4159.2009.06320.x. [DOI] [PMC free article] [PubMed] [Google Scholar]
- [24].Gong CX, Liu F, Grundke-Iqbal I, Iqbal K. Impaired brain glucose metabolism leads to Alzheimer neurofibrillary degeneration through a decrease in tau O-GlcNAcylation. J Alzheimers Dis. 2006;9:1–12. doi: 10.3233/jad-2006-9101. [DOI] [PubMed] [Google Scholar]
- [25].Liu F, Iqbal K, Grundke-Iqbal I, Hart GW, Gong CX. O-GlcNAcylation regulates phosphorylation of tau: a mechanism involved in Alzheimer's disease. Proc Natl Acad Sci U S A. 2004;101:10804–9. doi: 10.1073/pnas.0400348101. [DOI] [PMC free article] [PubMed] [Google Scholar]
- [26].Liu F, Shi J, Tanimukai H, Gu J, Grundke-Iqbal I, Iqbal K, Gong CX. Reduced O-GlcNAcylation links lower brain glucose metabolism and tau pathology in Alzheimer's disease. Brain. 2009;132:1820–32. doi: 10.1093/brain/awp099. [DOI] [PMC free article] [PubMed] [Google Scholar]
- [27].Luo B, Soesanto Y, McClain DA. Protein modification by O-linked GlcNAc reduces angiogenesis by inhibiting Akt activity in endothelial cells. Arterioscler Thromb Vasc Biol. 2008;28:651–7. doi: 10.1161/ATVBAHA.107.159533. [DOI] [PMC free article] [PubMed] [Google Scholar]
- [28].Kang ES, et al. O-GlcNAc modulation at Akt1 Ser473 correlates with apoptosis of murine pancreatic beta cells. Exp Cell Res. 2008;314:2238–48. doi: 10.1016/j.yexcr.2008.04.014. [DOI] [PubMed] [Google Scholar]
- [29].Goldberg H, Whiteside C, Fantus IG. O-linked {beta}-N-acetylglucosamine (O-GlcNAc) supports p38 MAPK activation by high glucose in glomerular mesangial cells. Am J Physiol Endocrinol Metab. 2011 doi: 10.1152/ajpendo.00108.2011. [DOI] [PubMed] [Google Scholar]
- [30].Gandy JC, Rountree AE, Bijur GN. Akt1 is dynamically modified with O-GlcNAc following treatments with PUGNAc and insulin-like growth factor-1. FEBS Lett. 2006;580:3051–8. doi: 10.1016/j.febslet.2006.04.051. [DOI] [PMC free article] [PubMed] [Google Scholar]


