

Abstract
Soluble epoxide hydrolase (sEH) quickly inactivates anti-inflammatory epoxyeicosatrienoic acids (EETs) by converting them to dihydroxyeicosatrienoic acids (DHETs). Inhibition of sEH has shown effects against inflammation, but little is studied about the role of sEH in inflammatory bowel disease (IBD) and its induced carcinogenesis. In the present study, the effect of sEH gene deficiency on the development of IBD-induced tumor development was determined in IL-10 knockout mice combined with sEH gene deficiency. Tumor development in the bowel was examined at the age of 25 weeks for male mice and 35 weeks for female mice. Compared to IL-10(−/−) mice, sEH (−/−)/IL-10 (−/−) mice exhibited a significant decrease of tumor multiplicity (2 ± 0.9 vs. 1 ± 0.3 tumors/mouse) and tumor size (344.55±71.73 vs. 126.94±23.18 mm3), as well as a marked decrease of precancerous dysplasia. The significantly lower inflammatory scores were further observed in the bowel in sEH(−/−)/IL-10(−/−) mice as compared to IL-10(−/−) mice, including parameters of inflammation-involved area (0.70±0.16 vs 1.4±0.18), inflammation cell infiltration (1.55±0.35 vs 2.15±0.18), and epithelial hyperplasia (0.95±0.21 vs 1.45±0.18), as well as larger ulcer formation. qPCR and western blotting assays demonstrated a significant down-regulation of cytokines/chemokines (TNFα, MCP1, and IL-12, 17 and 23) and NF-kB signals. Eicosanoid acid metabolic profiling revealed a significant increase of ratios of EETs to DHETs and EpOMEs to DiOMEs. These results indicate that sEH plays an important role in IBD and its-induced carcinogenesis and could serve as a highly potential target of chemoprevention and treatment for IBD.
Keywords: Inflammatory bowel disease, Carcinogenesis, Soluble epoxide hydrolase, IL-10, Eicosanoid acid metabolic profiling
Introduction
Inflammatory bowel disease (IBD), including ulcerative colitis and Crohn’s disease, is a longstanding chronic active inflammatory process with an increased risk for the development of cancer in the intestinal tract. Aberrant metabolites of arachidonic acid in the process of long-term inflammation play a crucial role in inflammation-induced carcinogenesis [1, 2]. Three key metabolic pathways are involved in arachidonic acid metabolism, including cyclooxygenase (COX)-mediated prostaglandins, lipoxygenase (LOX)-mediated leukotrienes and hydroxyeicosatetraenoic acids (HETEs), and cytochrome P450-mediated epoxyeicosatrienoic acids (EETs)[1]. There are numerous studies that indicate the COX- and LOX-mediated products promoting carcinogenesis[2]. But the third pathway of P450-mediated epoxyeicosatrienoic acids (EETs) is under study.
The role of P450-EETs-soluble epoxide hydrolase (sEH) pathway in inflammation has been assessed in rodent models [3–9]. The first finding for anti-inflammatory activity by EETs was reported in 1999 and showed that physiological concentrations of EETs or over-expression of p450-2J2 (that transformed arachidonic acid to EETs) inhibits inflammation through decreasing tumor necrosis factor-α (TNF-α)-induced vascular cell adhesion molecule expression (VCAM-1) and reducing leukocyte adhesion and infiltration to the vascular wall and inflamed tissues, and suppresses transcription factor NF-kB and IKK kinase [10]. Under physiologic condition, EETs are quickly inactivated by sEH that converts them to their corresponding dihydroxyeicosatrienoic acids (DHETs) [7]. It has been demonstrated that sEH inhibition or gene knockout stabilizes EETs and increases EETs to DHETs ratio [11, 12], resulting in dramatically anti-inflammatory function [3–9, 13]. Using LPS-induced systematic inflammation in mice, treatment with sEH inhibitor reduces the production of nitric oxide, cytokines, and proinflammatory lipid mediators and significantly improves survival [7, 14]. In the smoking induced bronchitis model in rats, sEH inhibitor shows a significant decrease of total bronchoalveolar inflammatory cells by 37% in tobacco smoke-exposed rats [8]. A combination of sEH inhibitor and EETs exhibits more significant effect on reducing tobacco smoking-induced inflammation [8]. sEH knock-out mice (disruption of Epx2 gene which encodes sEH) are phenotypically normal with only minimally decreased body weight in males, but have an altered arachidonic acid metabolism [15]. sEH knockout in mice results in a significant shift of the epoxy-fatty acid to diol ratio, led to protection against myocardial ischemia-reperfusion injury, modulation of the inflammatory response to cerebral ischemia, and improvement of glucose homeostasis[16–18]. However, there is no study on investigating the role of sEH gene deficiency in long-term inflammation-induced carcinogenesis.
A spontaneous IBD and its induced carcinogenesis in IL-10 knockout [IL-10(−/−)] mice serves as a representative model of IBD[2]. Typically, IL-10(−/−) mice spontaneously develop chronic enterocolitis with the transmural inflammation pattern in the small and large bowel which is phenotypically mimicking human Crohn’s disease[19]. But the occurrence of IBD greatly varies from 3 to 12 months. Synchronizing the development of IBD has been achieved through the short-period administration of piroxicam (one week treatment) [20]. Development of cancer in intestinal tract, mainly in the cecum and proximal small bowel, has been observed in IL-10(−/−) mice with long-term IBD [21].
Our short-term animal experiment has showed that sEH gene deficiency in IL-10(−/−) mice results in a significant attenuation of inflammatory activity in the gastrointestinal tract (published separately). In the present study, development of tumors and dysplasia in intestinal tracts was analyzed histopathologically and immunohistochemically in the long-term survival IL-10 (−/−) mice and double knockout IL-10(−/−)/sEH(−/−) mice. Inflammation activity and its correlation with tumor development were investigated. qPCR and western blotting assays were performed to analyze key inflammatory cytokines/chemokines and NF-kB signals. The eicosanoid metabolic profile was analyzed using a liquid chromatography/mass spectrometry (LC/MS-MS) method.
Materials and Methods
Animal Breeding and Genotyping
All animal experiments were approved by the Institutional Animal Care and Use Committee at Northwestern University. IL-10(−/−) mice in a C57BL/6J background were purchased from Jackson Laboratory, and sEH(−/−) mice in a C57BL/6J background were provided by Dr. Hammock at the University of California in Davis, CA. To produce homozygous double knockout sEH(−/−)/IL-10(−/−)mice, female IL-10 (−/−) mice were first crossed with male sEH (−/−) mice to generate IL-10(+/−)/sEH(+/−) double heterozygous litters (F1 colonies). Then, sEH(−/−)/IL-10(−/−) mice were produced by further cross-breeding IL-10(+/−)/sEH(+/−) mice (F2 colonies). Genotyping was performed based on the protocol from Jackson Laboratory. All mice were housed in micro-isolator cages (3–5 mice/cage) in a room illuminated with 12-h/12-h light-dark cycle and with free access to water and chow in the animal facilities at the Center for Comparative Medicine at Northwestern University (Chicago, IL).
Animal Experiments and Tissue Processing
IL-10(−/−), sEH(−/−)/IL-10(−/−), sEH(−/−), and C57BL/6J wild type mice (equal number of each gender per group) were used. Since the occurrence of inflammatory bowel disease varies greatly in IL-10(−/−) mice, all mice at the age of 4 weeks were treated with 200ppm piroxicam in AIN 93M diet for a week. At age 5 weeks, AIN 93 M diet was administered to the mice until the end of experiment. Food and water consumption were monitored daily, and body weights were recorded every week. For examination of the tumor development, male mice were scarified at age 25 weeks due to the exhibition of more than 20% loss of body weight; and female animals were sacrificed at age 38 weeks.
Blood and plasma were collected via heart acupuncture and stored in a −80°C freezer until analysis. All of the key organs including entire gastrointestinal tract, liver, spleen, kidney, etc were collected. Briefly, small and large intestines were inflated by in situ intra-luminal perfusion with chilled normal saline solution and opened longitudinally. The number, size and distribution of intestinal lesions (ulcer and tumor) were determined. Tumor volume was determined using the equation V=4/3πr3, where r was the average tumor radius obtained from the two diameter measurements. Mucosa tissue from half of entire gastrointestinal tract was collected freshly in RNA later for biochemical assay including protein extraction for western blot and RNA extraction for qPCR. The other half of the entire gastrointestinal tract (including stomach, small bowel and colon) were fixed in a 10% buffered formalin, prepared as “Swiss” rolls, and processed for paraffin sections for histopathological and immunohistochemical analyses.
Histopathological Analysis
Intestinal tumor was analyzed based on the established criteria [22, 23]. Adenocarcinoma was diagnosed by the invasion of neoplastic cells through the basement membrane into laminar propria and submucosa, and further classified as polypoid well, moderate or poorly differentiated pattern based on formation of glandular structure and mucinous carcinoma with mucin production in more than 75% tumor. Dysplasia was characterized by the partial loss of cell polarity and maturation, nuclear atypia, and an increase in mitotic figures[24].
The grading of IBD was based on the established criteria, including the parameters of: 1) the portion of area involved by inflammation, 2) intensity of inflammatory cell infiltration, 3) reactive/regenerative epithelial hyperplasia, and 4) ulcer formation [22]. Briefly, the inflammation involved area was scored from 0–3. 0: no inflammation in intestine 1: < 25% of intestine involved by inflammation; 2: 25 – 50%; and 3: more than 50%. The inflammatory cell infiltration was scored from 0–3: 0, minimal inflammatory cell infiltration in the mucosa of intestinal tract, mainly are plasma cells and lymphocytes; 1: focal intense inflammatory cell infiltration (<30% inflammatory cells in total cells counted in the inflamed areas) with occasional neutrophils (<10% of inflammatory cells are neutrophils highlighted by myeloperoxidase immunostaining); 2: focal highly intense inflammatory cells ( 30%–60% inflammatory cells in the inflamed areas with 10–20% MPO positive-stained neutrophils) and epithelial injury and mucosal erosion, and 3: ulcer formation with intense and more than 60% inflammatory cells infiltration (>20% MPO positive-stained neutrophils) in the inflamed areas. Epithelial hyperplasia was scored as 0–3 according to the ratio of the mucosal thickness to the entire intestinal wall, 0: the ratio is less than 1/3; 1: 1/3–1/2; 2: 1/2–3/4; and 3: more than 3/4. The score for ulcer was 0: no ulcer and 1: with ulcer formation. The total inflammation index will be the sum of all parameters.
Immunohistochemistry
Immunohistochemical staining was performed using avidin-biotin-peroxidase complex method on paraffin-embedded intestinal sections as previously described [22]. The primary antibodies are myeloperoxidase antibody (Rabbit pAb, 60µg/µl, Abcam, Cambridge, MA) and Ki67 antibody (Rabbit mAb, 1:100 diluted, Vector Laboratories Inc, Burlingame, CA). Biotinyted anti-rabbit IgG secondary antibody (1:200) and ABC complex (Avidin-Biotin-Complex) were purchased from Vector Laboratories Inc, Burlingame, CA. Diaminobenzadine (Sigma-Aldrich, St.Louis, MO) was used as the chromogen. Slides were washed with 1XTBST buffer between incubations and counterstained with Mayer’s hemotoxylin for 1½ minutes. The number of myeloperoxidase positive-stained inflammatory cells per high power (40X objective lense) was counted for each specimen. Cell proliferation was analyzed by Ki67-labeled cells and proliferation index was the percentage of Ki67 positive cells in the total number of cells counted.
Quantitative Real-time PCR
Total RNA was extracted from the colonic mucosa using the RNeasy kit (Qiagen, Inc., Valencia, CA). The concentration was determined using a SmartSpec Plus Spectrophotometer (BioRad, Hercules, CA). First-strand cDNA was synthesized using 1 µg of total RNA in a 20 µl reverse transcriptase reaction mixture using SuperScript III Platinum Two-Step q-RT-PCR Kit with SYBR Green (Invitrogen, Carlsbad, CA) according to the manufacturer’s instructions. The region of IFN-γ, TNF-α, and MCP-1 mRNA were amplified using primers: IFN-γ (Forward 5’-TCAAGTGGCATAGATGTGGAAGAA; Reverse 5’-TGGCTCTGCAGGATTTTCATG), TNF-α (Forward 5’-CCAACGGCATGGATCTCAAAGACA; Reverse 5’-TGAGATAGCAAATCGGCTGACGGT), MCP-1 (Forward 5’-ACTGAAGCCAGC TCTCTCTTCCTC; Reverse 5’-TTCCTTCTTGGG GTCAGCACAGAC) as described in literatures [25, 26]. The region of IL-12, IL-17, and IL-23 mRNA were amplified using primers IL-12 (Forward 5′-CAGATAGCCCATCACCCTGT; Reverse 5’-ACGGCCAGAGAAAAACTGAA), IL-17 (Forward 5’- TCTCTGATGCTGTTGCTGCT; Reverse 5’-CGTGGAACGGTTGAGGTAGT), and IL-23 (Forward 5’-AATAATGTGCCCCGTATCCA, Reverse 5’- CTGGAGGAGTTGGCTGAGTC). GAPDH (Glyceraldehyde-3-phosphate dehydrogenase) was used as internal control (Forward 5’-GCACAGTCAAGGCCGAGAAT; Reverse 5’-GCCTTCTCCATGGTGGTGAA). All Real-Time PCR reactions were performed in a 25 µl mixture containing 1/10 volume of cDNA preparation (2.5 µl), 12.5µl SYBR Green buffer (Invitrogen, Carlsbad, CA), 0.5 µM of each primer, 8.5µl DEPC (diethylprocarbonate) (EMD Chemicals, Gibbstown, NJ). Real-time quantitation was performed using the MiniOpticon Real-Time PCR System (BioRad, Hercules, CA). PCR conditions were: 50°C for 2 minutes, 95°C for 2 minutes, followed by 40 cycles of 95°C, 15 seconds; 58°C, 3 seconds; 50°C, 1 second. Data of each mRNA expression were shown as the relative fold of change normalized by that of GAPDH.
Western Blotting
150ul of whole tissue/cell lysate of intestinal mucosa (n= 3 mice per group ) was separated by 10% SDS-PAGE and protein expression was analyzed using the following antibodies: Rabbit anti-NF-κB mAb P65 and anti-phosphorylated NF-κB p65 (S276) mAb P65 (1:1000, Cell Signaling Technology, Danvers, MA), rabbit anti-IKK-α (1:1000,Cell Signaling Technology, Danvers, MA), goat anti-VCAM-1IgG Ab (1:750, R&D Sytem, Minneapolis, MN) and mouse anti-β-actin mAb (1:2000, Sigma-Aldrich Co., Saint Louis, MO). Signals were visualized with SuperSignal West Pico Chemiluminescent Substrate (Thermo Scientific).
Analysis of Arachidonic Acid Metabolic Profile Using LC/MS-MS Method
Serum specimens were spiked with 10 µL of 50 nM internal standard I (d4-6-keto-PGF1a, d4-PGE2, d4-TXB2, d4-LTB4, d11-14,15-DiHETrE,d4-9-HODE, d8-5-HETE, d11-11(12)-EpETrE) and were extracted by solid phase extraction using Oasis HLB cartridges (3cc 60mg, Waters, Milford, MA). The HLB cartridges were first washed with 2 mL ethyl acetate, 2 mL methanol twice, and 2 mL 95:5 v/v water/methanol with 0.1% acetic acid. Then, 200 µL serum samples were loaded onto the cartridges, washed with 6 mL 95:5 v/v water/methanol with 0.1% acetic acid, and dried for 20 min with low vacuum. The target analytes were eluted with 0.5 mL methanol, followed by 2 mL of ethyl acetate into the tubes with 6 µL 30% glycerol in methanol as the trap solution. The volatile solvents were evaporated using vacuum centrifugation (Speed-Vac) until 2 µL trap solution remained in the tube. The residues were dissolved in 50 µL of methanol containing 200 nM internal standards II (1-cyclohexyl-dodecanoic acid urea, CUDA). The samples were mixed with a vortex mixer for 2 min, centrifuged at 14000 × g for 5 min and then transferred to auto sampler vials with 150 µL inserts for LC/MS/MS analysis.
Liquid chromatography/tandem mass spectrometry (LC/MS/MS) analysis of oxylipids was performed using a modified method based on the previous publication [27]. An Agilent 1200 SL liquid chromatography series (Agilent Corporation, Palo Alto, CA) with an Agilent Eclipse Plus C18 2.1 × 150 mm, 1.8 µm column were used for the oxylipins separation. The mobile phase A was water with 0.1% acetic acid while the mobile phase B was composed of acetonitrile/methanol (80/15, v/v) and 0.1% acetic acid. Gradient elution was performed at a flow rate of 250 µL/min and the gradient used is described in the attached table. The injection volume was 10 µL and the samples were kept at 4°C in the auto sampler. Analytes were detected by negative MRM mode using a 4000 QTrap tandem mass spectrometer (Applied Biosystems Instrument Corporation, Foster City, CA) equipped with an electrospray ionization source (Turbo V). The QTrap was set as follows: CUR = 20 psi, TEM = 500 °C, GS1 = 50 psi, GS2 = 30 psi, CAD = High, IS = −4500 V, DP = −60 V, EP = −10 V. Calibration curves were generated by 10 µL injections of seven standards containing each analyte, internal standard I, and internal standard II for quantification purpose.
Statistical Analysis
Each analyzed parameter was expressed as Mean ± SD, unless otherwise stated, with at least three independent measurements. Continuous variables were compared with the Student’s t-test, whereas categorical variables were compared with Chi-square test. All statistical tests were two-sided, statistical significance was taken as p<0.05.
Result
Effect of sEH Gene Deficiency on IBD-Induced Carcinogenesis in the Bowel
All of the mice including wild type, sEH(−/−), IL-10(−/−), and sEH(−/−)/IL-10(−/−) mice were monitored daily. In order to synchronize the development of IBD, the mice were fed an AIN93M diet containing 200ppm of piroxicam for one week (at age 4 weeks [28]. Early mucosal injury in the bowel was observed 10 days after piroxicam use; IL-10(−/−) mice, sEH(−/−)/IL-10(−/−) mice, sEH(−/−) mice, and wild-type control animals all exhibited mild mucosal ulcer formation in the cecum and proximal small bowl. sEH(−/−)/IL-10(−/−) and sEH(−/−) mice showed much milder ulcerations as compared to the IL-10(−/−) mice. While the sEH(−/−) and wild-type control mice showed a full recovery from the erosion and ulceration 4 weeks after piroxicam use, the sEH(−/−)/IL-10(−/−) and IL-10(−/−) mice continued to display chronic active IBD (n=3 mice each strain each gender mice). Thus, the IBD process was synchronically induced in the sEH(−/−)/IL-10(−/−) and IL-10(−/−) mice at four weeks post-piroxicam treatment.
At age 17 weeks, male IL-10(−/−) and sEH(−/−)/IL-10(−/−) mice started to display loss of body weight and progression worsened. At age 25 weeks, more than 50% male IL-10(−/−) mice and sEH(−/−)/IL-10(−/−) mice showed >20% decrease of body weight as compared to male wild type mice. Male IL-10(−/−) mice displayed more severe diarrhea and bowel inflammation than male sEH(−/−)/IL-10(−/−) mice. But male sEH(−/−)/IL-10(−/−) mice exhibited smaller prostate and testicles, indicating deduction of body weight probably due to alteration of testosterone [29]. Female sEH (−/−)/IL-10(−/−) mice did not exhibited any gross abnormalities until age 38 weeks.
Extensive pathological analysis was performed for the entire gastrointestinal tract of all mice. In wild type and sEH(−/−) mice, no tumor or inflammation was observed. In IL-10(−/−) mice, 85% mice (17/20) developed polypoid tumor masses (Fig. 1A), 53% tumors located in duodenal/proximal small bowel and 47% in cecum/right colon with average 2 ± 0.9 tumors/mouse (tumor multiplicity) and average tumor volume 344.55 ± 71.73mm3. Histopathology revealed that most tumors were polypoid well to moderately-differentiated adenocarcinoma with invasion into laminar propria or submucosa (Fig. 1B), and only one mouse developed an invasive mucinous carcinoma (Fig. 1C and 1D). Compared to IL-10 (−/−) mice, a significant decrease of tumor multiplicity and volume was observed in sEH(−/−)/IL-10(−/−) mice that had average 1 ± 0.3 tumor/mouse (Fig.1E) and average tumor volume 126 ± 23.18mm3 (Fig.1F, p=0.028). In sEH(−/−)/IL-10(−/−) mice, 33% tumors occurred in the duodenum/proximal small bowel and 67% in the cecum and right colon; but no statistical difference was observed for tumor location as well as for genders, as compared to IL-10(−/−) mice. Histopathology revealed that all of the intestinal tumors in sEH(−/−)/IL-10(−/−) mice were polypoid well differentiated adenocarcinoma, and no invasive mucinous carcinoma was seen.
Fig. 1. Morphology of colitis-induced adenocarcinoma and histograms of tumor number and size in IL-10(−/−) and sEH(−/−)/IL-10(−/−) mice.

(A) A polypoid well-differentiated adenocarcinoma was observed in the intestinal mucosa under low-power field (125X), and (B) high magnification (500X) of square area of (A), showing adenocarcinoma invading into laminar propria in the colonic mucosa in IL-10(−/−) mice. (C) low-power view of transmural invasion of mucinous carcinoma in the colon in IL-10(−/−) mice (125X), and (D) high magnification (250X) of square area of (C), showing well-differentiated mucinous carcinoma invading into muscularis propria. (E) Histogram of tumor multiplicity (number of tumor/mouse): showing a significant decrease of tumor multiplicity in sEH(−/−)/IL-10(−/−) mice (n=20) as compared to IL-10 (−/−) mice (n=19, P=0.01). (F) Distribution of tumor size: the tumor size in sEH(−/−)/IL-10(−/−) mice (n=20) was significantly smaller than that in IL-10(−/−) mice (n=19). Results were reported as mean ± SD. The statistical difference between sEH(−/−)/IL-10(−/−) and IL-10 (−/−) animals was calculated and labeled in the figure.
IBD-induced dysplasia in the bowel was analyzed histopathologically and further characterized with Ki-67-labeld proliferative cells. Morphologically, IBD-induced dysplasia was characterized as the partial loss of nuclear polarity and cell maturation with nuclear atypia, and an increase in mitotic figures, as seen in Fig.2A and 2B. Ki-67-labeled proliferative cells were observed in the crypt epithelium and extended to the luminal surface in the dysplastic lesion, as shown in Fig.2C and 2D. In non-dysplastic mucosa, Ki-67-labeld proliferative cells were only observed in the crypt epithelium. As summarized in histogram in Fig. 2E, 90% (18/20) of IL-10(−/−) mice had average 3 ± 1.19 dysplasia/mouse; and only 60% of sEH(−/−)/IL-10(−/−) mice carried dysplasia with average 2 ± 1.15 dysplasia/mouse. Ki-67 labeled cell proliferation was further semi-quantitatively analyzed and showed a significant decrease of cell proliferation in inflammation-induced epithelial hyperplasia, dysplasia and adenocarcinoma, as seen in Fig. 2F.
Fig. 2. Dysplastic lesions and cell proliferation labeled with Ki-67 immunohistochemistry.

(A) Representative dysplastic lesion in IL-10(−/−) mice. (B) Representative dysplastic lesion in sEH(−/−)/IL-10(−/−) mice. (C) Dysplastic lesion, showing Ki-67-labeled proliferative cells diffusely distributed throughout the crypts to the luminal surface epithelium in the colon in IL-10(−/−) mice. (D) The proliferative cells labeled with Ki-67 were fewer and predominantly limited within the crypts and focally extend to the luminal surface of colon in sEH(−/−)/IL-10(−/−) mice. (E) Histogram of the number of dysplasia (counted throughout the entire colon): showing a marked decrease of the number of dysplasia in sEH(−/−)/IL-10(−/−) mice (n=19) as compared to that in IL-10 (−/−) (n=20); but not reached statistical significance (P>0.05). (F) Histogram of the average percentage of Ki67-labeld proliferative cells: showing a significant decrease of Ki67-labeld proliferative cells in sEH(−/−)/IL-10(−/−) mice (n=10) as compared to IL-10(−/−) mice (n=7) in lesions of inflammation (P=0.05), dysplasia (P=0.03), and adenocarcinoma (P=0.05). Results represented as mean ± SD. Percentage of positive stained Ki-67 cells in total cells counted in different lesions in the colon was analyzed by three randomly chosen areas of each lesion under 40X HPF.
Effect of sEH Gene Deficiency on Intestinal Chronic Active Inflammation
Inflammatory activity in the intestinal tract was semi-quantitatively analyzed histopathologically, including the parameters of inflammation-involved area, inflammatory cell infiltration, inflammation-caused reactive epithelial hyperplasia, and ulcer formation according to our established criteria [22]. In IL-10(−/−) mice, 90% (18/20) displayed extensive and intense inflammation with ulcer formation in the bowel (Fig. 3A), and the average inflammatory scores were 1.40 ± 0.18 for inflammation-involved area, 2.15 ± 0.18 inflammation cell infiltration, and 1.45 ± 0.18 for inflammation-caused reactive epithelial hyperplasia, furthermore 35% IL-10(−/−) mice had large active ulcer (Fig. 3A) with extensive myeloperoxidase-labled neutrophil infiltration (Fig.3C). Compared to IL-10(−/−) mice, only 45% (9/20) of sEH(−/−)/IL-10(−/−) mice showed focal mild inflammation (Fig.3B), and the average inflammatory scores were 0.70 ± 0.16 for inflammation-involved area (p=0.007), 1.55 ± 0.35 for inflammation cell infiltration (p=0.032), and 0.95±0.21 for inflammation-caused reactive epithelial hyperplasia (p=0.044), as summarized in histogram in Fig. 3E. Only 10% sEH(−/−)/IL-10(−/−) mice developed small active ulcers (10% vs 35%, p<0.05). Myeoperoxidase (MPO) immunohistochemical staining was performed to analyze active neutrophil infiltration in the inflamed areas. Compared to that of IL-10(−/−) mice (Fig.3C), a much significant decrease of MPO-positive neutrophils in the inflamed areas was observed in sEH(−/−)/IL-10(−/−) mice (Fig. 3D). Overall inflammatory index (sum of each parameter) was significantly decreased in sEH(−/−)/IL-10(−/−) mice compared to that of IL-10(−/−) mice (3.3 ± 0.74 vs. 5.35 ± 0.46, p=0.003, Fig. 3E).
Fig. 3. Morphological analysis and semi-quantification of inflammatory activity and ulcer formation in IL-10(−/−) and sEH(−/−)/IL-10(−/−) mice.

(A) The colon of IL-10(−/−) mouse exhibits a large ulcer with adjacent hyperplastic epithelial changes and extensive inflammatory cell infiltration. (B) The colon of sEH(−/−)/IL-10(−/−) mouse showed a small healed ulcer with mild hyperplastic epithelium and less inflammatory cell infiltration. (C) Immunohistochemistry of myeloperoxidase (MPO), a square area in photo A shows intense MPO-positive neutrophil infiltration; and D) MPO Immunohistochemistry, a square area in photo B displays much significant less MPO-positive neutrophil infiltration. E) Histogram of inflammatory severity in IBD: showing a semi-quantification of inflammatory severity, ulcer, hyperplasia, and lesion area involved in sEH(−/−)/IL-10(−/−) mice (n=20) and in IL-10(−/−) mice (n=19).
The statistically significant difference was observed between sEH(−/−)/IL-10(−/−) and IL-10(−/−) mice in inflammatory severity (P=0.03), hyperplasia (P=0.04), extent of that involved (P=0.007), and total inflammatory index (P=0.003). Results were reported as mean ± SE.
Analysis of Key Inflammatory Cytokines and Chemokines as well as NF-kB and VCAM-1 Signals with Quantitative real time-PCR and Western Blot Approaches
Transcriptional expressions of inflammatory cytokines and chemokines were analyzed quantitatively using real time-PCR approach for freshly collected colonic mucosa (n=6 mice/group). As seen in Fig.4, all of wild type mice showed minimal expression of IFN-γ, TNF-α, MCP1, IL-12, IL-17 and IL-23, By setting the value of each cytokine expression in wild type mice as 1, a minimal increase of MCP1, IL-17 and IL-23 was seen in sEH(−/−), but did not reach a statistical significance. A significant increase of the mRNA expressions in these cytokines/chemokines was found in IL-10(−/−) mice as compared to wild-type animals, including 13 folds increase in TNF-α, 5 folds increase in IFN-γ, 10 folds increase in MCP1, 5 folds increase in IL-12, and 4 folds increase in both IL-17 and IL-23. Compared to IL-10(−/−) mice, a highly significant decrease of the mRNA expression in these inflammatory cytokines and chemokines was observed in sEH(−/−)/IL-10(−/−) mice and showed 7 folds decrease in TNF-α, 3 folds decrease in IFN-γ, 8 folds decrease in MCP-1, 4 folds decrease in IL-12, 1 fold decrease in IL-17, and 2 folds decrease in IL-23 as compared to IL-10(−/−) mice, as seen in Fig. 4 (p<0.01).
Fig. 4. Quantitative real-time PCR analysis of TNF-α, IFN- γ, MCP-1, IL-12, IL-17 and IL-23 mRNA expressions in the colon in wild type, sEH(−/−). IL-10(−/−), sEH(−/−)/IL-10(−/−) mice.

The statistically significant difference of these cytokines and chemokines was observed between IL-10(−/−) and sEH(−/−)/IL-10(−/−) mice. (n=6/group, mucosa specimens from 3 males and 3 females chosen randomly from each group). Results were reported as mean ± SE.
Expressions of total and phosphorylated NF-kB, as well Ikka and VCAM-1 were measured using the western blotting approach and densitometry analysis for whole tissue/cell lysates of freshly collected colonic mucosa (n=6/group). As showed in Fig. 5A and 5B, all of these inflammatory signals were significantly decreased in sEH(−/−)/IL-10(−/−) mice as compared to those in IL-10(−/−) mice.
Fig. 5. Western blot and densitometry analysis for NF-κB p65, phosphorylated NF-κB p65 (S276), IKK-α, and VCAM-1 for freshly collected colon mucosa from IL-10(−/−) and sEH(−/−)/IL-10(−/−) mice.

(A) Western blot assay, and (B) Histogram of densitometry analysis. Specimens from male and female animals were pooled together within each group (n=6/group, 3 males and 3 females chosen randomly from each group). The significant decreases of NF-κB p65, phosphorylated NF-κB p65 (S276), IKK-α, and VCAM-1 were seen in sEH(−/−)/IL-10(−/−) mice as compared with IL-10(−/−) mice. β-actin was used as internal control.
Plasma Levels of Eicosanoid Profile Analyzed with A Liquid Chromatography-Tandem Mass Spectrometry (LC/MS-MS) Assay
Quantitative analysis of eicosanoids profiles is far more significant than individual biomarker/s for evaluating arachidonic acid metabolic pathways. Simply, the ratios of fatty acid epoxides (EpOMEs) to their corresponding diols (DiHOMEs) and EETs to DHETs are the most crucial biomarkers for determining sEH activity. With LC/MS-MS approach, we analyzed plasma levels of eicosanoid profile in these animals. Compared to wild type mice, sEH(−/−) exhibited a significant increase of EETs, including 11(12)-, 14(15)-EET, and the fatty acid epoxides (EpOME), including 9(10)- and 12(13)-EpOME, as well as a significantly decrease of corresponding fatty acid diols, including 9(11)-DHOME and 12(13)-DHOME, and the DHETs, including 11(12)-DHET, and 14(15)-DHET, as seen in Fig. 6. As expected, ratios of EETs to DHETs and EpOMEs to DiHOMEs were significantly increased in sEH(−/−) mice.
Fig. 6. Metabolites of eicosanoid profile in plasma specimens analyzed using a LC/MS-MS method.
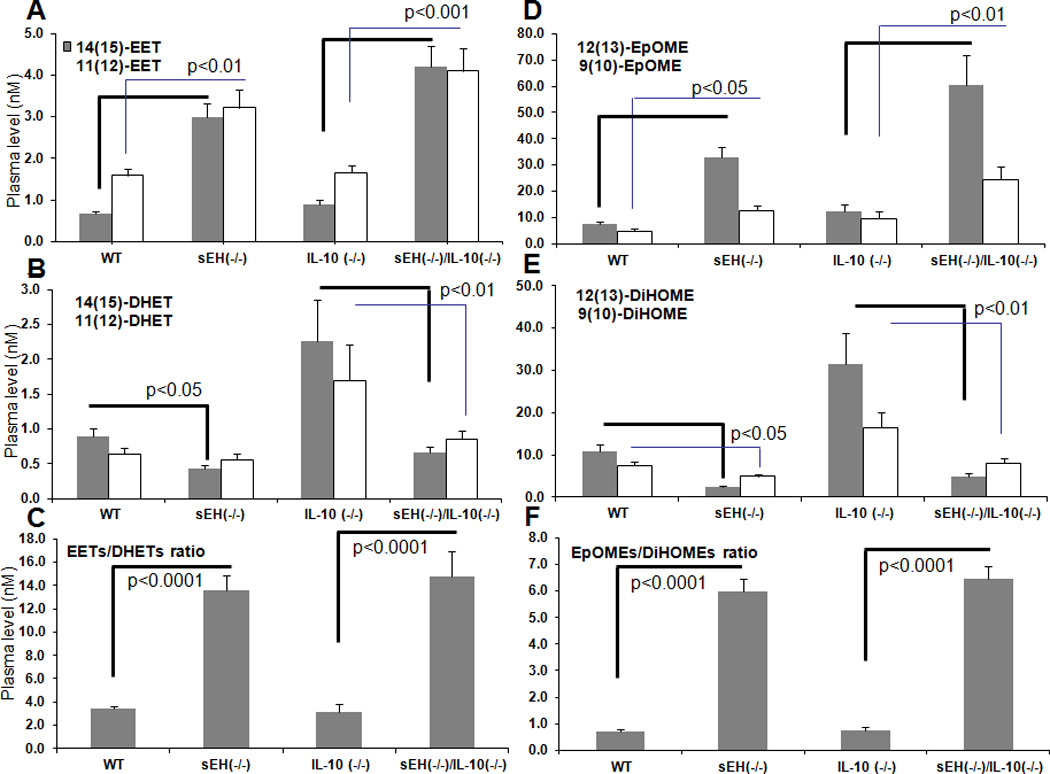
The levels of epoxygenase-dependent metabolites in plasma (A) EETs (including 11(12)-, 14(15)-EET), (B) DHETs (including 11(12)-DHET, and 14(15)-DHET), and (C) the ratio of total EETs to DHETs. (D) EpOMEs (including 9(10)-, 11(12)-EpOME), (E) DiHOMEs (including 9(10)-DiHOME, and 11(12)-DiHOME), and (F) the ratio of total EpOME to DiHOME.
The statistically significant difference was labeld in the figures in comparison between wild type mice and sEH (−/−) mice and between sEH(−/−)/IL-10(−/−) mice and IL-10(−/−) mice. Especially, both EETs and EpOMEs were significantly increased, while DHETs and DiHOME were significantly decreased in sEH(−/−)/IL-10(−/−) mice compared to IL-10(−/−) mice (n=20 per group), therefore, the ratios of EETs/DHETs and EpOMEs/DiHOME were much more significantly increased. Results were reported as mean ± SE.
In IL-10(−/−) mice (IBD mice), a significant increase of fatty acid diols, including 9(11)-DHOME and 12(13)-DHOME, and the DHETs, including 11(12)-DHET, and 14(15)-DHET was observed as compared to wild type mice (p<0.05, Fig.6) But no change was seen in the levels of EETs (including 11(12)-, 14(15)-EET) and the fatty acid epoxides (EpOME) (including 9(10)- and 12(13)-EpOME), nor the ratios of EETs to DHETs and EpOMEs to DiHOMEs (Fig.6). Compared to IL-10(−/−) mice, sEH(−/−)/IL-10(−/−) mice displayed a significant elevation of the levels of EETs (including 11(12)-, 14(15)-EET) and fatty acid epoxides (EpOME, including 9(10)- and 12(13)-EpOME), and a significant decrease of the levels of corresponding fatty acid diols (including 9(11)-DHOME and 12(13)-DHOME) and DHETs (including 11(12)-DHETand 14(15)-DHET), as seen in Fig.6. sEH(−/−)/IL-10(−/−) mice exhibited a much more significant increase in the ratios of EETs to DHETs and EpOMEs to DiHOMEs as compared to IL-10(−/−)mice (Fig. 6).
To investigate if there was an effect of sEH gene deficiency on modulating other pathways of arachidonic acid metabolism, the key cyclooxygenase (COX2) and lipoxygenase (LOX)-mediated metabolites were analyzed, including PGE2 (prostaglandin E2), PGD2 (prostaglandin D2) and TXB2 (thromboxane B2) as products of COX2 pathway, and LTB4 (Leukotriene B4) and 5-HETE (5-hydroxyeicosatetraenoic acid) as metabolites of LOX pathway. As shown in Fig.7, the level of PGE2 was significantly increased in IBD mice (both IL-10(−/−) and sEH(−/−)/IL-10(−/−) mice) as compared to wild type and sEH(−/−) mice; but a slight decrease of PGE2 was seen sEH(−/−)/IL-10(−/−) mice as compared to IL-10(−/−) mice (no statistically significant). The level of LTB4 was significantly increased in sEH knockout mice (both sEH(−/−) mice and sEH(−/−)/IL-10(−/−) mice) as compared to wild type and IL-10(−/−) mice (Fig.7). PGD2 was markedly increased in sEH(−/−)/IL-10(−/−) mice as compared to IL-10(−/−) mice (Fig.7, no statistically significant). TXB2 and 5-HETE was mildly increased in sEH knockout mice (both sEH(−/−) mice and sEH(−/−)/IL-10(−/−) mice) as compared to wild type and IL-10(−/−) mice (Fig.7, no statistically significant).
Fig. 7. Representative metabolites of eicosanoid profile in COX and LOX pathways analyzed using a LC/MS-MS method.

The levels of COX-dependent metabolites in plasma (A) PGE2, and PGD2, and (B) TXB2. The levels of LOX-dependent metabolites in plasma (C) LTB4 and (D) 5-HETE. Results were reported as mean ± SE. The statistically significant difference was labeled in the figure.
Discussion
The studies have demonstrated the beneficial effects of sEH gene deficiency on protection against myocardial ischemia-reperfusion injury, the inflammatory response to cerebral ischemia, and on improvement of glucose homeostasis using a powerful sEH gene knockout model in mice [16–18]. In the present study, we have first reported that sEH gene deficiency in IL-10 knockout mice led to the reduction of IBD inflammatory activity and IBD-induced tumor development in the bowel.
Long-standing chronic active inflammatory bowel disease is at high risk for cancer development. Several molecular events involved in chronic active inflammatory processes contribute to cancer development, including the overproduction of reactive oxygen and nitrogen species, aberrant metabolites of key arachidonic acid metabolism, overproduction of cytokines/chemokines, and dysfunction of immunity system[2]. Inflammatory cells (including neutrophils, macrophages, lymphocytes and plasma cells, as well as eosinophils and mast cells) play a central role in these molecular events. Reduction of inflammatory cell infiltration is crucial for suppressing inflammatory activity and inhibiting inflammation-induced carcinogenesis. sEH gene deficiency in IL-10(−/−) mice resulted in a significant decrease of inflammatory cell infiltration (mainly including neutrophils and macrophages) in the inflamed areas of bowel which was correlated with the reduction of IBD-induced tumor development. A simple mechanism involved in inhibiting inflammatory cell infiltration in sEH(−/−)/IL-10(−/−) mice directly links to abolish the hydrolysis of EETs by sEH knockout that results in an increase of EETs and further leads to inhibit NF-kB and IKK signals, VCAM-1expression, and inflammatory cell infiltration [10].
Our qPCR analysis further revealed a significant decrease of mRNA expression of several key cytokines and chemokines including TNF-α, MCP1, IL-12, IL-17, and IL-23. Although the mechanism for inhibition of these cytokines and chemokines by sEH knockout is not known, these inflammatory mediators play an important role in IBD. Studies in clinical and experimental IBD have shown the up-regulation of various chemokines including TNF-α and monocyte chemoattractant protein (MCP)-1 in the colonic mucosal tissue. There are a significant attenuation of colitis and reduction of mortality in TNF-α and MCP-1-deficient mice. IL-12 is a well-studied proinflammatory cytokine that drives the pathogenic CD4 T cells responding against the bacterial microflora[30]. IL-23 is an additional member of IL-12 family [31]. Studies in animal models of IBD have revealed that IL-23 plays a key role in chronic intestinal inflammation. Selective depletion of IL-23 using monoclonal antibodies specific for the p19 subunit or by genetic ablation of the p19 gene greatly attenuates T cell-dependent colitis in T cell transfer model in mice [32] [33] and inhibits spontaneous IBD development in IL-10 (−/−) mice [34]. IL-23 drives an increased production of IL-17 and interferon (IFN)-r by both T cells and non-T cells. In IBD, the major action of IL-17 is to promote additional inflammatory cascades by stimulating the production of chemokines leading to activate granulocytes[35] [36], and to promote development of IBD-associated colorectal cancer[37].
NF-kB has been proposed to be a main molecular link between inflammation and carcinogenesis. NF-kB is not only a key signal transmitting cytokine signal cascade to the targeted cells such as endothelial cells for recruiting inflammatory cells into inflamed tissues, but also involved in driving tumor invasion and metastasis, particularly via its downstream products of matrix metalloproteinases and serine proteases, as well as anti-apoptotic factors such as Bcl-2 and Bcl-XL, etc[38]. Thus, down-regulation of NF-kB and IKK signals in IBD in sEH deficient mice may play a critical role in IBD and its induced tumor development [39].
In addition to stabilization of EETs by abolishing sEH function through its gene knockout, whether or not there is any effect on modulating other pathways in arachidonic acid metabolism is an important concern. Our result revealed that LOX-mediated pathway was mildly regulated by sEH gene knockout and showed a mild increase of LTB4 and 5-HETE in sEH(−/−) mice and sEH(−/−)/IL-10(−/−) mice. This finding may represent a feedback regulation of inflammatory metabolites of arachidonic acid metabolism. However, COX mediated key product PGE2 appears no change between wild type mice and sEH(−/−) mice. PGE2 production via COX-1 and COX-2 is a key event to promote inflammation-induced carcinogenesis [40, 41] and PGE2 production via COX-1 promotes intestinal stem cell survival and proliferation [42]. Our finding showed that the high elevation of PGE2 in IBD in IL-10(−/−) mice was mildly decreased in IL-10(−/−) mice with sEH gene deficiency.
A recent report indicates that endothelium-derived EETs and its induced VEGF appear to promote angiogenesis and tumor metastasis [43], which is contradictory to our findings. However, several studies in the literatures and our present results indicate that targeting sEH may be more beneficial for preventing inflammation-induced carcinogenesis rather than promoting it. Evidence includes 1) at least one third of human cancer are associated with chronic inflammatory process in which active inflammatory cells (neutrophils and macrophages) play a central role in generating nitro-oxidative stress and inflammatory cytokines (such as TNF-α). Increase of EETs leads to decrease a production of proinflammatory cytokines and reduce an infiltration of inflammatory cells, which appears an important step for preventing inflammation-induced cancer. 2) Endothelium-derived EETs and its associated angiogenesis are also important for the process of regeneration to repair inflammation-induced injury, particularly for IBD-induced erosion and ulceration. 3) Targeting TNF-α-induced VCAM-1 expression in endothelial cells by EETs is through inhibition of transcriptional factor NF-kB and Ikk kinase [10]. Activation of NF-kB and Ikk kinase is commonly observed in tumorigenesis [38]. Inhibition of NF-kB and Ikk kinase by EETs or sEH knockout is a crucial mechanism for preventing tumor development. 4) Sorafenib is a multikinase inhibitor, including sEH [44]. It has been demonstrated the beneficial effects of sorafenib on treating highly angiogenic malignances such as renal cell carcinoma, as well the effect on blocking tumour growth, angiogenesis and metastatic potential in preclinical models [45, 46]. 5) In the present study, using IBD-induced carcinogenesis in mice, we have observed a significant reduction of IBD-induced tumor development and no metastasis observed through extensively histopathological analysis for all key organs in IL-10(−/−) mice with sEH deficiency.
In conclusion, our results imply that sEH plays an important role in IBD and its-induced carcinogenesis. Simply, a increase of EETs to DHETs ratio including the stabilization of EETs and reduction of DHETs, is a key function for sEH gene deficiency. These functional changes in sEH knockout mice lead to attenuation of IBD inflammatory activities and its induced carcinogenesis, mechanistically via down-regulation of cytokines and chemokines, NF-kB signals and VCAM1. Our results may have brought up a new direction of investigation on preventive and therapeutic strategy for IBD via targeting sEH.
Acknowledgement
This study was supported by NIH R01 CA137467 to GYY. Partial supports were provided by NIEHS R01 ES002710 and NIEHS Superfund Program P42 ES004699 to BDH. BDH is a George and Judy Marcus Senior Fellow of The American Asthma Foundation.
References
- 1.Norwood S, Liao J, Hammock BD, Yang GY. Epoxyeicosatrienoic acids and soluble epoxide hydrolase: potential therapeutic targets for inflammation and its induced carcinogenesis. Am J Transl Res. 2010;2(4):447–457. [PMC free article] [PubMed] [Google Scholar]
- 2.Yang GY, Taboada S, Liao J. Inflammatory bowel disease: a model of chronic inflammation-induced cancer. Methods Mol Biol. 2009;511:193–233. doi: 10.1007/978-1-59745-447-6_9. [DOI] [PubMed] [Google Scholar]
- 3.Chiamvimonvat N, Ho CM, Tsai HJ, Hammock BD. The soluble epoxide hydrolase as a pharmaceutical target for hypertension. J Cardiovasc Pharmacol. 2007;50(3):225–237. doi: 10.1097/FJC.0b013e3181506445. [DOI] [PubMed] [Google Scholar]
- 4.Huang H, Morisseau C, Wang J, Yang T, Falck JR, Hammock BD, Wang MH. Increasing or stabilizing renal epoxyeicosatrienoic acid production attenuates abnormal renal function and hypertension in obese rats. Am J Physiol Renal Physiol. 2007;293(1):F342–F349. doi: 10.1152/ajprenal.00004.2007. [DOI] [PubMed] [Google Scholar]
- 5.Zhang W, Koerner IP, Noppens R, Grafe M, Tsai HJ, Morisseau C, Luria A, Hammock BD, Falck JR, Alkayed NJ. Soluble epoxide hydrolase: a novel therapeutic target in stroke. J Cereb Blood Flow Metab. 2007;27(12):1931–1940. doi: 10.1038/sj.jcbfm.9600494. [DOI] [PMC free article] [PubMed] [Google Scholar]
- 6.Inceoglu B, Schmelzer KR, Morisseau C, Jinks SL, Hammock BD. Soluble epoxide hydrolase inhibition reveals novel biological functions of epoxyeicosatrienoic acids (EETs) Prostaglandins Other Lipid Mediat. 2007;82(1–4):42–49. doi: 10.1016/j.prostaglandins.2006.05.004. [DOI] [PMC free article] [PubMed] [Google Scholar]
- 7.Schmelzer KR, Kubala L, Newman JW, Kim IH, Eiserich JP, Hammock BD. Soluble epoxide hydrolase is a therapeutic target for acute inflammation. Proc Natl Acad Sci U S A. 2005;102(28):9772–9777. doi: 10.1073/pnas.0503279102. [DOI] [PMC free article] [PubMed] [Google Scholar]
- 8.Smith KR, Pinkerton KE, Watanabe T, Pedersen TL, Ma SJ, Hammock BD. Attenuation of tobacco smoke-induced lung inflammation by treatment with a soluble epoxide hydrolase inhibitor. Proc Natl Acad Sci U S A. 2005;102(6):2186–2191. doi: 10.1073/pnas.0409591102. [DOI] [PMC free article] [PubMed] [Google Scholar]
- 9.Zhao X, Yamamoto T, Newman JW, Kim IH, Watanabe T, Hammock BD, Stewart J, Pollock JS, Pollock DM, Imig JD. Soluble epoxide hydrolase inhibition protects the kidney from hypertension-induced damage. J Am Soc Nephrol. 2004;15(5):1244–1253. [PubMed] [Google Scholar]
- 10.Node K, Huo Y, Ruan X, Yang B, Spiecker M, Ley K, Zeldin DC, Liao JK. Anti-inflammatory properties of cytochrome P450 epoxygenase-derived eicosanoids. Science. 1999;285(5431):1276–1279. doi: 10.1126/science.285.5431.1276. [DOI] [PMC free article] [PubMed] [Google Scholar]
- 11.Newman JW, Morisseau C, Hammock BD. Epoxide hydrolases: their roles and interactions with lipid metabolism. Prog Lipid Res. 2005;44(1):1–51. doi: 10.1016/j.plipres.2004.10.001. [DOI] [PubMed] [Google Scholar]
- 12.Morisseau C, Hammock BD. Epoxide hydrolases: mechanisms, inhibitor designs, and biological roles. Annu Rev Pharmacol Toxicol. 2005;45:311–333. doi: 10.1146/annurev.pharmtox.45.120403.095920. [DOI] [PubMed] [Google Scholar]
- 13.Fleming I. DiscrEET regulators of homeostasis: epoxyeicosatrienoic acids, cytochrome P450 epoxygenases and vascular inflammation. Trends Pharmacol Sci. 2007;28(9):448–452. doi: 10.1016/j.tips.2007.08.002. [DOI] [PubMed] [Google Scholar]
- 14.Inceoglu B, Jinks SL, Schmelzer KR, Waite T, Kim IH, Hammock BD. Inhibition of soluble epoxide hydrolase reduces LPS-induced thermal hyperalgesia and mechanical allodynia in a rat model of inflammatory pain. Life Sci. 2006;79(24):2311–2319. doi: 10.1016/j.lfs.2006.07.031. [DOI] [PMC free article] [PubMed] [Google Scholar]
- 15.Sinal CJ, Miyata M, Tohkin M, Nagata K, Bend JR, Gonzalez FJ. Targeted disruption of soluble epoxide hydrolase reveals a role in blood pressure regulation. J Biol Chem. 2000;275(51):40504–40510. doi: 10.1074/jbc.M008106200. [DOI] [PubMed] [Google Scholar]
- 16.Manhiani M, Quigley JE, Knight SF, Tasoobshirazi S, Moore T, Brands MW, Hammock BD, Imig JD. Soluble epoxide hydrolase gene deletion attenuates renal injury and inflammation with DOCA-salt hypertension. Am J Physiol Renal Physiol. 2009;297(3):F740–F748. doi: 10.1152/ajprenal.00098.2009. [DOI] [PMC free article] [PubMed] [Google Scholar]
- 17.Motoki A, Merkel MJ, Packwood WH, Cao Z, Liu L, Iliff J, Alkayed NJ, Van Winkle DM. Soluble epoxide hydrolase inhibition and gene deletion are protective against myocardial ischemia-reperfusion injury in vivo. Am J Physiol Heart Circ Physiol. 2008;295(5):H2128–H2134. doi: 10.1152/ajpheart.00428.2008. [DOI] [PMC free article] [PubMed] [Google Scholar]
- 18.Luria A, Bettaieb A, Xi Y, Shieh GJ, Liu HC, Inoue H, Tsai HJ, Imig JD, Haj FG, Hammock BD. Soluble epoxide hydrolase deficiency alters pancreatic islet size and improves glucose homeostasis in a model of insulin resistance. Proc Natl Acad Sci U S A. 108(22):9038–9043. doi: 10.1073/pnas.1103482108. [DOI] [PMC free article] [PubMed] [Google Scholar]
- 19.Kuhn R, Lohler J, Rennick D, Rajewsky K, Muller W. Interleukin-10-deficient mice develop chronic enterocolitis. Cell. 1993;75(2):263–274. doi: 10.1016/0092-8674(93)80068-p. [DOI] [PubMed] [Google Scholar]
- 20.Berg DJ, Zhang J, Weinstock JV, Ismail HF, Earle KA, Alila H, Pamukcu R, Moore S, Lynch RG. Rapid development of colitis in NSAID-treated IL-10-deficient mice. Gastroenterology. 2002;123(5):1527–1542. doi: 10.1053/gast.2002.1231527. [DOI] [PubMed] [Google Scholar]
- 21.Berg DJ, Davidson N, Kuhn R, Muller W, Menon S, Holland G, Thompson-Snipes L, Leach MW, Rennick D. Enterocolitis and colon cancer in interleukin-10-deficient mice are associated with aberrant cytokine production and CD4(+) TH1-like responses. J Clin Invest. 1996;98(4):1010–1020. doi: 10.1172/JCI118861. [DOI] [PMC free article] [PubMed] [Google Scholar]
- 22.Seril DNLJ, Lu G, Yang CS, Yang G-Y. Increased susceptibility of ulcerative colitis-associated carcinoma development in Ogg1 knockout mice; The Proceeding of 96th AACR Annual Meeting; 2005. [Google Scholar]
- 23.Seril DN, Liao J, Yang CS, Yang GY. Systemic iron supplementation replenishes iron stores without enhancing colon carcinogenesis in murine models of ulcerative colitis: comparison with iron-enriched diet. Dig Dis Sci. 2005;50(4):696–707. doi: 10.1007/s10620-005-2560-6. [DOI] [PubMed] [Google Scholar]
- 24.Mahler M, Bristol IJ, Leiter EH, Workman AE, Birkenmeier EH, Elson CO, Sundberg JP. Differential susceptibility of inbred mouse strains to dextran sulfate sodium-induced colitis. Am J Physiol. 1998;274(3 Pt 1) doi: 10.1152/ajpgi.1998.274.3.G544. G544-451. [DOI] [PubMed] [Google Scholar]
- 25.Vogel CF, Nishimura N, Sciullo E, Wong P, Li W, Matsumura F. Modulation of the chemokines KC and MCP-1 by 2,3,7,8-tetrachlorodibenzo-p-dioxin (TCDD) in mice. Arch Biochem Biophys. 2007;461(2):169–175. doi: 10.1016/j.abb.2007.01.015. [DOI] [PubMed] [Google Scholar]
- 26.Deng X, Li H, Tang YW. Cytokine expression in respiratory syncytial virus-infected mice as measured by quantitative reverse-transcriptase PCR. J Virol Methods. 2003;107(2):141–146. doi: 10.1016/s0166-0934(02)00211-2. [DOI] [PubMed] [Google Scholar]
- 27.Yang J, Schmelzer K, Georgi K, Hammock BD. Quantitative Profiling Method for Oxylipin Metabolome by Liquid Chromatography Electrospray Ionization Tandem Mass Spectrometry. Anal Chem. 2009;81(19):8085–8093. doi: 10.1021/ac901282n. [DOI] [PMC free article] [PubMed] [Google Scholar]
- 28.Narushima S, Spitz DR, Oberley LW, Toyokuni S, Miyata T, Gunnett CA, Buettner GR, Zhang J, Ismail H, Lynch RG, et al. Evidence for oxidative stress in NSAID-induced colitis in IL10−/−mice. Free Radic Biol Med. 2003;34(9):1153–1166. doi: 10.1016/s0891-5849(03)00065-0. [DOI] [PubMed] [Google Scholar]
- 29.Luria A, Morisseau C, Tsai HJ, Yang J, Inceoglu B, De Taeye B, Watkins SM, Wiest MM, German JB, Hammock BD. Alteration in plasma testosterone levels in male mice lacking soluble epoxide hydrolase. Am J Physiol Endocrinol Metab. 2009;297(2):E375–E383. doi: 10.1152/ajpendo.00131.2009. [DOI] [PMC free article] [PubMed] [Google Scholar]
- 30.Bouma G, Strober W. The immunological and genetic basis of inflammatory bowel disease. Nature reviews Immunology. 2003;3(7):521–533. doi: 10.1038/nri1132. [DOI] [PubMed] [Google Scholar]
- 31.Hunter CA. New IL-12-family members: IL-23 and IL-27, cytokines with divergent functions. Nature reviews Immunology. 2005;5(7):521–531. doi: 10.1038/nri1648. [DOI] [PubMed] [Google Scholar]
- 32.Hue S, Ahern P, Buonocore S, Kullberg MC, Cua DJ, McKenzie BS, Powrie F, Maloy KJ. Interleukin-23 drives innate and T cell-mediated intestinal inflammation. The Journal of experimental medicine. 2006;203(11):2473–2483. doi: 10.1084/jem.20061099. [DOI] [PMC free article] [PubMed] [Google Scholar]
- 33.Kullberg MC, Jankovic D, Feng CG, Hue S, Gorelick PL, McKenzie BS, Cua DJ, Powrie F, Cheever AW, Maloy KJ, et al. IL-23 plays a key role in Helicobacter hepaticus-induced T cell-dependent colitis. The Journal of experimental medicine. 2006;203(11):2485–2494. doi: 10.1084/jem.20061082. [DOI] [PMC free article] [PubMed] [Google Scholar]
- 34.Yen D, Cheung J, Scheerens H, Poulet F, McClanahan T, McKenzie B, Kleinschek MA, Owyang A, Mattson J, Blumenschein W, et al. IL-23 is essential for T cell-mediated colitis and promotes inflammation via IL-17 and IL-6. J Clin Invest. 2006;116(5):1310–1316. doi: 10.1172/JCI21404. [DOI] [PMC free article] [PubMed] [Google Scholar]
- 35.Alsabti EA. Serum alphafetoprotein in bladder carcinoma. Oncology. 1977;34(2):78–79. doi: 10.1159/000225188. [DOI] [PubMed] [Google Scholar]
- 36.Ljujic B, Radosavljevic G, Jovanovic I, Pavlovic S, Zdravkovic N, Milovanovic M, Acimovic L, Knezevic M, Bankovic D, Zdravkovic D et al, et al. Elevated serum level of IL-23 correlates with expression of VEGF in human colorectal carcinoma. Archives of medical research. 2010;41(3):182–189. doi: 10.1016/j.arcmed.2010.02.009. [DOI] [PubMed] [Google Scholar]
- 37.Fantini MC, Pallone F. Cytokines: from gut inflammation to colorectal cancer. Current drug targets. 2008;9(5):375–380. doi: 10.2174/138945008784221206. [DOI] [PubMed] [Google Scholar]
- 38.Karin M, Lin A. NF-kappaB at the crossroads of life and death. Nature immunology. 2002;3(3):221–227. doi: 10.1038/ni0302-221. [DOI] [PubMed] [Google Scholar]
- 39.Karin M, Greten FR. NF-kappaB: linking inflammation and immunity to cancer development and progression. Nature reviews Immunology. 2005;5(10):749–759. doi: 10.1038/nri1703. [DOI] [PubMed] [Google Scholar]
- 40.Boolbol SK, Dannenberg AJ, Chadburn A, Martucci C, Guo XJ, Ramonetti JT, Abreu-Goris M, Newmark HL, Lipkin ML, DeCosse JJ, et al. Cyclooxygenase-2 overexpression and tumor formation are blocked by sulindac in a murine model of familial adenomatous polyposis. Cancer Res. 1996;56(11):2556–2560. [PubMed] [Google Scholar]
- 41.Williams CS, Luongo C, Radhika A, Zhang T, Lamps LW, Nanney LB, Beauchamp RD, DuBois RN. Elevated cyclooxygenase-2 levels in Min mouse adenomas. Gastroenterology. 1996;111(4):1134–1140. doi: 10.1016/s0016-5085(96)70083-5. [DOI] [PubMed] [Google Scholar]
- 42.Cohn SM, Schloemann S, Tessner T, Seibert K, Stenson WF. Crypt stem cell survival in the mouse intestinal epithelium is regulated by prostaglandins synthesized through cyclooxygenase-1. J Clin Invest. 1997;99(6):1367–1379. doi: 10.1172/JCI119296. [DOI] [PMC free article] [PubMed] [Google Scholar]
- 43.Panigrahy D, Edin ML, Lee CR, Huang S, Bielenberg DR, Butterfield CE, Barnes CM, Mammoto A, Mammoto T, Luria A, et al. Epoxyeicosanoids stimulate multiorgan metastasis and tumor dormancy escape in mice. J Clin Invest. 2012;122(1):178–191. doi: 10.1172/JCI58128. [DOI] [PMC free article] [PubMed] [Google Scholar]
- 44.Liu JY, Park SH, Morisseau C, Hwang SH, Hammock BD, Weiss RH. Sorafenib has soluble epoxide hydrolase inhibitory activity, which contributes to its effect profile in vivo. Molecular cancer therapeutics. 2009;8(8):2193–2203. doi: 10.1158/1535-7163.MCT-09-0119. [DOI] [PMC free article] [PubMed] [Google Scholar]
- 45.Hutson TE, Figlin RA, Kuhn JG, Motzer RJ. Targeted therapies for metastatic renal cell carcinoma: an overview of toxicity and dosing strategies. The oncologist. 2008;13(10):1084–1096. doi: 10.1634/theoncologist.2008-0120. [DOI] [PubMed] [Google Scholar]
- 46.Pignochino Y, Grignani G, Cavalloni G, Motta M, Tapparo M, Bruno S, Bottos A, Gammaitoni L, Migliardi G, Camussi G, et al. Sorafenib blocks tumour growth, angiogenesis and metastatic potential in preclinical models of osteosarcoma through a mechanism potentially involving the inhibition of ERK1/2, MCL-1 and ezrin pathways. Molecular cancer. 2009;8:118. doi: 10.1186/1476-4598-8-118. [DOI] [PMC free article] [PubMed] [Google Scholar]