

Abstract
The magnetically driven rotation of 300 nm diameter rods shows the surface viscosity of albumin at an air-water interface increases from 10−9 to 10−5 Ns/m over two hours while the surface pressure saturates in minutes. The increase in surface viscosity is not accompanied by a corresponding increase in elasticity, suggesting that the protein film anneals with time, resulting in a more densely packed film leading to increased resistance to shear. The nanometer dimensions of the rods provide the same sensitivity as passive microrheology with an improved ability to measure more viscous films.
The rheological properties of protein and surfactant monolayers play a critical role in dynamic processes in the food, pharmaceutical, and biomedical industries, and in the human body [1–12]. Rheology is intimately coupled to the organization and interactions of the molecules making up these monolayers [4–13]. However, monolayer shear viscosity, especially during adsorption, remains largely unexplored due to the difficulty of decoupling the properties of the two-dimensional interfacial film from those of the three-dimensional fluid [9, 14].
This decoupling is quantified by B, the Boussinesq number, which is the ratio of surface to bulk drag on a probe of characteristic dimension, a:
| (1) |
ηs is the surface viscosity; ηw and ηa are the bulk viscosities of water and air. As ηa << ηw, (ηw + ηa) ~ ηw ~ 10−3 Ns/m2. To unambiguously measure the surface viscosity, B >> 1. Current surface rheometers using macroscopic probes [3, 4, 6, 16–18] have a resolution of ηs ~ 10−6 Ns/m. However, surface viscosities can be as low as 10−9 Ns/m for soluble adsorbed monolayers [2, 9, 11]; as a result, measurements of the surface shear viscosity of absorbed protein or surfactant films are rare. To investigate these films, we employed probes of nanometer dimensions (Fig. 1a), thereby reducing a and increasing B for a given set of surface and bulk viscosities [3, 5–8, 15].
Figure 1.

(a): Magnetic nanorod (black cylinder next to white arrows) re-orients from perpendicular to parallel to the applied magnetic field, H. (b): tan φ(t) vs. t for the re-orientation of the nanorods at the interface of a 2 mg/ml albumin solution for various aging times. The nanorods reorient with an exponential response (dotted lines are fit to Eqn. 3, inset shows that ln(tan φ(t) vs. t is linear). The scatter in the data is due to the error in manual tracking (up to 1 degree). The inductance time of our magnetic coils ~ 0.02 s.
While one and two particle passive microrheology [9, 11] are also sensitive to surface viscosities as low as 10−9 Ns/m, the thermal motion of the probe is difficult to follow for ηs ≥ 10−6 Ns/m [5, 12, 19]. Actively driving a ferromagnetic nanorod of length 3μm and diameter 300 nm (Fig. 1a) with a known torque applied by an external magnetic field maintains the necessary sensitivity while expanding the measurable range (Fig. 1b). The nanorod is sensitive to ηs ~ 10−9 Ns/m (Fig. 2) and shows quantitative agreement with passive microrheology [9]. Active microrheology reduces the time needed to do individual measurements, allowing us to follow changes in surface viscosity of adsorbed albumin films over a range of time scales, including the initial stages of adsorption.
Figure 2.
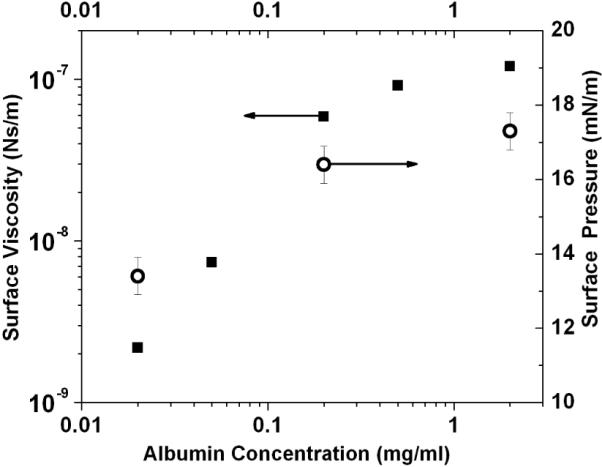
The surface viscosity (closed squares) of an albumin solution 20 minutes after the initial adsorption as a function of the solution concentration. The surface pressure (open circles) shows a similar saturation with increasing concentration.
Albumin is the most abundant, surface-active protein in the blood and forms a disordered monolayer on absorption to the air-water interface [20–23]. The surface viscosity 20 minutes after adsorption increases from 10−9 to 10−7 Ns/m with increasing bulk albumin concentration up to the same concentration at which the surface pressure saturates (Fig. 2). However, for each bulk concentration, the surface viscosity increased by orders of magnitude as the film aged (Fig. 3,4). The four orders of magnitude change on aging reported here had previously been undetected due to the sensitivity limit of macro-scale surface rheometers [4, 6, 17]. The change in surface pressure was surprising as much of the change occurred after a stable surface pressure was reached (Fig. 3,4), and spectroscopic techniques such as FTIR showed little change in the secondary structure of albumin at the interface [21, 24]. What is equally surprising is that the surface viscosity increased without a corresponding increase in the elasticity; both passive and active microrheology show that the albumin film is primarily viscous [9]. This suggests that the increased viscosity is not due to chemical crosslinking or gelation of the protein, but may be due to a gradual annealing of defects in the film, eliminating weak zones in the film and promoting jamming of albumin molecules, which occurs long after the surface pressure saturates [24, 25]. The aging effects are independent of the ionic strength of the bulk solution, ruling out electrostatic ordering between the charged proteins as the origin of the increased viscosity.
Figure 3.
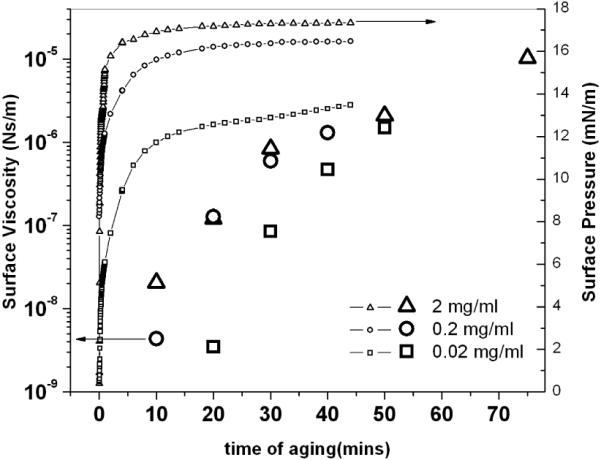
Surface viscosity (large symbols) and surface pressure (small symbols) for 2, 0.2 and 0.02 mg/ml albumin concentrations as a function of time after mixing. The surface viscosity changes by orders of magnitude over hours, while the surface pressure reaches an equilibrium value within minutes.
Figure 4.
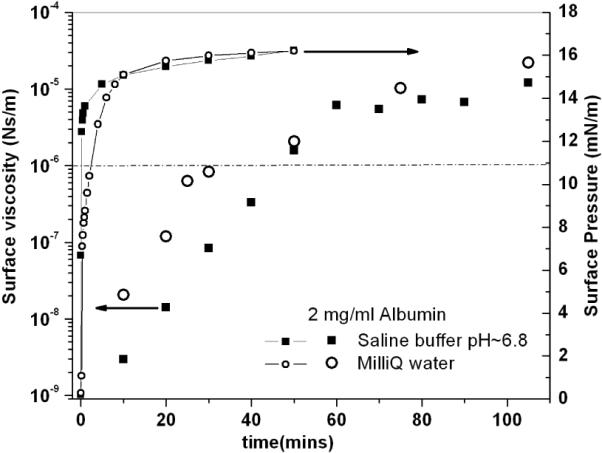
Surface viscosity (large symbols) and surface pressure (small symbol) vs. time of aging of the film for low (Milli-Q water) and high (saline buffer: 150 mM NaCl, 2 mM CaCl2, 0.2 mM NaHCO3, pH~7.0) salt concentrations, for a bulk protein concentration of 2 mg/ml. The dashed line indicates the maximum surface viscosity that can be measured with passive microrheology assuming a measurement time of 103 seconds.
Nanorods 3μm long and 300 nm in diameter (Fig. 1a) were synthesized by electrochemical deposition of nickel into alumina templates as described previously [26]. The magnetized [8, 10, 11] nickel nanorods were dispersed in a 90% isopropyl alcohol, 10% water solution and deposited at the air/water interface with a syringe. The isopropyl alcohol was allowed to evaporate for 30 minutes; the nanorods were retained at the interface by capillary forces. To initiate each experiment, a fixed concentration of albumin (bovine serum albumin, Sigma, St. Louis, Mo., 98% purity) was mixed into water (Millipore Gradient System, Billerica, MA, resistivity 18.2 MΩ/cm) or 150 mM saline to final concentrations ranging from 0.02–2 mg/ml. A magnetic field (10 G – 120 G) was applied through home-built electromagnetic coils to orient the nanorods. Individual rods were visualized with a Nikon E3800 microscope using a 50× long working distance objective. Videos of the rod reorientations were recorded with a CCD camera connected to a personal computer and digitized for analysis.
The rod is described by the angle, φ(t), between the long axis of the rod and the direction of the applied magnetic field, H (Fig. 1a). A balance of the magnetic and viscous torques describes the reorientation of the rod at a viscous interface:
| (2) |
the solution to which is:
| (3) |
The relaxation time, τ = frηwl3/μomH, gives the dimensionless drag coefficient of the rod, fr = fw + fs is which is a sum of the bulk (fw) and surface (fs) drag. H is the magnitude of the applied magnetic field, and μom is the magnetic moment of the nanorod of length, l. The bulk drag, fw, is constant and taken to be half that of the drag on a rod of diameter d and length l (l/d = 10) rotating in a viscous fluid: fw = π 6(ln(2d/l)−0.8)=0.24 [27]. However, fs ≫ fw, so the details are unimportant. The value of B for a given surface drag coefficient, fs, was determined in Ref. [11] and was used to calculate the surface viscosity.
The nanorods were aligned using a second magnetic field perpendicular to H. At t=0, H was applied (and the alignment field turned off so that φ(t = 0) = 90°, Fig. 1a). The rod gradually re-oriented to align its long axis with the applied field such that φ →0°. Fig. 1b shows tan(φ / 2) as a function of time for the rod re-orientation for three different aging times of the albumin film. Eqn. 2 provides an excellent fit to the data (inset to Fig. 2), which gives τ, from which the surface drag coefficient, fs = fr − fw, acting on the rod was calculated (Eqn. 4). Using our analytical results, B was determined from fs [11], and the surface viscosity of the interface was obtained from Eqn. 1. If there was a substantial elastic component to the film [9], the simple exponential response (Eqn. 3) would not fit the data, and the rods would not rotate completely to align with the applied field as is observed (φ > 0° for t →∞ in Fig. 1b) [28].
Figure 2 shows the surface shear viscosity of albumin and the surface pressure (the surface pressure, Π, is defined as the reduction in surface tension from a clean interface, Π=γo−γ, with γo =72 mN/m for water) as a function of the bulk protein concentration 20 minutes after the addition of albumin. With increasing protein concentration, the surface viscosity increased by two orders of magnitude until it saturated at bulk concentrations > 0.2 mg/ml. This is the same concentration range at which the surface pressure saturated (Fig. 2) [29]. The surface pressure of albumin, like many soluble proteins and surfactants, increases with the logarithm of the concentration up to a saturation concentration [29]. For albumin, the maximum surface pressure (18–20 mN/m) is reached for concentrations > 0.1 mg/ml [29]. Neutron [21] and X-ray reflectivity [23] measurements of albumin monolayers at the saturation concentration show that the protein, which is a 4 × 4 × 14 nm ellipsoid, is disordered, but orients with its long axis parallel to the interface. At higher bulk concentrations, a partial second layer has been detected [21–23].
Figure 3 shows that surface viscosity evolved differently than the surface pressure. As the film aged, the surface viscosity of the monolayer increased by up to four orders of magnitude, from 10−9 to 10−5 Ns/m, over one hour while the surface pressure reached a steady value within minutes, especially at higher concentrations. This suggests that the interactions leading to the surface pressure are quite different than those that determine the surface viscosity. FTIR [30], neutron [21] and X-ray reflectivity[23] of albumin films show that albumin molecules retain their globular form during adsorption to the air-water interface and that the increase in surface pressure is likely due to the resistance to compression of the globular proteins [31, 32]. However these techniques are unable to detect subtle changes in the tertiary structure or interactions of the protein that must occur over hours to anneal packing defects in the film, which likely induce the changes in surface viscosity. While the surface pressure is independent of the tertiary structure, interfacial viscosity appears to be more sensitive to the interfacial organization [25]. Disordered proteins at the interface give rise to weak resistance to shear, while organized structures are associated with increasing surface viscosity. The dramatic increase in surface shear viscosity implies significant structural changes to the adsorbed protein film with time that are difficult to detect by other means.
In the absence of any alterations to the primary structure of the protein, this increase in viscosity must result either from hydrophobic interactions between the protein molecules, electrostatic interactions, or some form of annealing of defects in the monolayer. The formation of a partial second layer with increased concentration [21] is not likely to increase the surface viscosity by orders of magnitude. Proteins at the interface can partially rearrange to expose their hydrophobic parts to the air while retaining their primary structure, thus leading to slow conformational changes [20, 24]. Partial conformational changes during film aging may lead to non-covalent inter-protein bridges (disulphide links or hydrogen bonds) to occur between protein molecules at the interface [24]; this gradual evolution could lead to the slow formation of a network or gelation [6, 24]. However, in the absence of any detectable increase in the elasticity of the film [9], the initial increase in viscosity is inconsistent with the formation of a two-dimensional gel [6]. Spectroscopy does not show significant breaking or formation of disulphide bonds.
It has been suggested that long-range electrostatic interactions between charged “colloidal” proteins may enhance ordering [33] at the air-water interface, which could result in a corresponding increase in surface viscosity. Fig. 4 shows that both the surface viscosity and the surface pressure of BSA are independent of ionic strength of the bulk phase. Albumin films reached similar values of surface viscosity within 40 minutes on both subphases, and the surface pressure reached the same saturation value within 10 minutes. Evolution of any two-dimensional structure in the protein film is not due to electrostatic repulsion between the proteins. Therefore, we attribute the four orders of magnitude change in surface viscosity of the films to the formation of an annealed film as a result of non-covalent inter-protein interactions.
In conclusion, we present a new active microrheology method of measuring the surface shear viscosity of adsorbed films at the air-water interface. This new technique has the same sensitivity as one and two particle microrheology, can measure more viscous films, and is in quantitative agreement for similar films [9, 11]. The increased sensitivity and range of the nanorods allows us to detect the four orders of magnitude increase in the surface viscosity during the first two hours of film aging, from 10−9 to 10− 5 Ns/m, which occurred long after the film attained a saturation surface pressure. This dramatic change in the surface viscosity with aging shows that the structure of the albumin films evolve over long times, suggesting changes in the inter-protein interactions that lead to an annealing of the initial film. Previous attempts to use larger magnetic rods to measure an equivalent “surface viscosity” of 30 – 150 nm thick films of silicone oil on water [8] showed that the rod dynamics were inconsistent with the results expected for monolayer films [15]. A film of silicon oil on a glycerol/water subphase showed the hydrodynamic effects of an effective two-dimensional compressibility and deviated significantly from the incompressible two-dimensional protein films examined here.
This evolution of surface viscosity may have interesting implications in both science and technology. Inhibition of lung surfactants by serum proteins, including albumin, accompanies lung injury, which can result in adult respiratory distress syndrome, an often fatal disease [22, 23]. The dramatic increase in surface viscosity of albumin with time may help explain the progression of surfactant inhibition and possible new treatments. Albumin is also widely used in food processing, as a stabilizer for foams, etc; in these applications, the evolution of surface viscosity and albumin structure plays a key role. The maximum surface viscosity that may be obtained by passive microrheology, assuming a response time of probe particles ~ 103 s, is of order 10−6 Ns/m, which is an more than an order of magnitude less than that we have measured for the albumin films. Our results show that the nanorod viscometer provides a uniquely sensitive and practical tool for surface rheological studies.
Acknowledgements
We thank Prof. T. Mallouk for providing the magnetic nanorods and S. Y. Choi, I. Sheih and the Physics Machine shop for help in building the experimental set-up. PD and JAZ were supported by NIH Grant HL-51177.
References
- 1.Edwards DA, Brenner H, Wasan DT. Interfacial Transport Processes and Rheology. Boston, MA: 1991. [Google Scholar]
- 2.Schwartz D, Knobler CM, Bruinsma R. Phys. Rev. Lett. 1994;73:2841. doi: 10.1103/PhysRevLett.73.2841. [DOI] [PubMed] [Google Scholar]
- 3.Brooks CF, et al. Langmuir. 1999;15:2450. [Google Scholar]
- 4.Bos MA, van Vliet T. Adv. Coll. Int. Sci. 2001;91:437. doi: 10.1016/s0001-8686(00)00077-4. [DOI] [PubMed] [Google Scholar]
- 5.Ding JQ, Warriner HE, Zasadzinski JA. Phys. Rev. Lett. 2002;88 doi: 10.1103/PhysRevLett.88.168102. [DOI] [PubMed] [Google Scholar]
- 6.Bantchev GB, Schwartz DK. Langmuir. 2003;19:2673. [Google Scholar]
- 7.Fischer TM, Fluid J. Mech. 2004;498:123. [Google Scholar]
- 8.Anguelouch A, Leheny RL, Reich DH. Appl. Phys. Lett. 2006;89:3. [Google Scholar]
- 9.Prasad V, Koehler SA, Weeks ER. Phys. Rev. Lett. 2006;97:176001. doi: 10.1103/PhysRevLett.97.176001. [DOI] [PubMed] [Google Scholar]
- 10.Dhar P, et al. J. Phys. Chem. C. 2007;111:3607. [Google Scholar]
- 11.Dhar P, et al. Nano Lett. 2006;6:66. doi: 10.1021/nl052027s. [DOI] [PubMed] [Google Scholar]
- 12.Alonso C, Waring A, Zasadzinski JA. Biophys. J. 2005;89:266. doi: 10.1529/biophysj.104.052092. [DOI] [PMC free article] [PubMed] [Google Scholar]
- 13.Cascao Pereira LG, et al. Langmuir. 2003;19:2349. [Google Scholar]
- 14.Saffman PG, Delbruck M. Proc. Nat. Acad. Sci. USA. 1975;72:311. doi: 10.1073/pnas.72.8.3111. [DOI] [PMC free article] [PubMed] [Google Scholar]
- 15.Lee MH, et al. Langmuir. 2009;25:7976. doi: 10.1021/la900408y. [DOI] [PubMed] [Google Scholar]
- 16.Ding JQ, et al. Langmuir. 2002;18:2800. [Google Scholar]
- 17.Graham DE, Phillips MC. J. Coll. Int. Sci. 1980;76:240. [Google Scholar]
- 18.Reynaert S, et al. J. Rheol. 2008;51:261. [Google Scholar]
- 19.Alonso C, et al. Biophys. J. 2004;87:4188. doi: 10.1529/biophysj.104.051201. [DOI] [PMC free article] [PubMed] [Google Scholar]
- 20.Graham DE, Phillips MC. J. Coll. Int. Sci. 1979;70:427. [Google Scholar]
- 21.Lu JR, Su TJ, Thomas RK. J. Coll. Int. Sci. 1999;213:426. doi: 10.1006/jcis.1999.6157. [DOI] [PubMed] [Google Scholar]
- 22.Fernsler JG, Zasadzinski JA. Langmuir. 2009;25:8131. doi: 10.1021/la8039434. [DOI] [PMC free article] [PubMed] [Google Scholar]
- 23.Stenger PC, et al. Biophys J. 2009;97:777. doi: 10.1016/j.bpj.2009.05.017. [DOI] [PMC free article] [PubMed] [Google Scholar]
- 24.de Jongh HHJ, Wierenga PA. Biopolymers. 2006;82:384. doi: 10.1002/bip.20519. [DOI] [PubMed] [Google Scholar]
- 25.Stratford K, et al. Science. 2005;309:2198. doi: 10.1126/science.1116589. [DOI] [PubMed] [Google Scholar]
- 26.Paxton WF, et al. J. Am. Chem. Soc. 2004;126:13424. doi: 10.1021/ja047697z. [DOI] [PubMed] [Google Scholar]
- 27.Burgers JM. Second Report on Viscosity and Plasticity. North-Holland Publ. Co; Amsterdam: 1938. [Google Scholar]
- 28.An appreciable elasticity, Es, in the film would add a term proportional to -Esπ to the right hand side of Eqn. 2 which would cause the rods to stop rotating at a value of π > 0.
- 29.Warriner HE, et al. Biophys. J. 2002;82:835. doi: 10.1016/S0006-3495(02)75445-3. [DOI] [PMC free article] [PubMed] [Google Scholar]
- 30.Lad MD, et al. Phys. Chem. Chem. Phys. 2006;8:2179. doi: 10.1039/b515934b. [DOI] [PubMed] [Google Scholar]
- 31.Lu JR, Su TJ, Penfold J. Langmuir. 1999;15:6975. [Google Scholar]
- 32.Pereira LGC, et al. Langmuir. 2003;19:2349. [Google Scholar]
- 33.Nikolaides MG, et al. Nature. 2002;420:299. doi: 10.1038/nature01113. [DOI] [PubMed] [Google Scholar]