

Abstract
Microglia represent the main cellular targets of HIV-1 in the brain. Infected and/or activated microglia play a pathogenic role in HIV-associated neurocognitive disorders (HAND) by instigating primary dysfunction and subsequent death of neurons. Although microglia are known to secrete neurotoxins when infected with HIV-1, the detailed mechanism of neurotoxicity remains unclear. Using a human microglia primary culture system and macrophage-tropic HIV-1 strains, we have now demonstrated that HIV-1 infection of microglia resulted in a significant increase in extracellular glutamate concentrations and elevated levels of neurotoxicity. RNA and protein analysis revealed upregulation of the glutamate-generating enzyme glutaminase isoform glutaminase C in HIV-1-infected microglia. The clinical relevance of these findings was further corroborated with investigation of postmortem brain tissues. The glutaminase C levels in the brain tissues of HIV dementia individuals were significantly higher than HIV serum-negative control and correlated with elevated concentrations of glutamate. When glutaminase was subsequently inhibited by siRNA or by a small molecular inhibitor, the HIV-induced glutamate production and the neuronal loss was diminished. In conclusion, these findings support glutaminase as a potential component of the HAND pathogenic process as well as a novel therapeutic target in their treatment.
Introduction
HIV-1 invasion of the CNS frequently causes chronic brain inflammation and progressive neurologic impairments, which are collectively termed HIV-associated neurocognitive disorders (HAND). Critical cellular components of HAND pathogenesis include macrophages and microglia, which are the main targets of HIV-1 infection in the brain. Specifically, HIV-1-infected macrophages and microglia induce neuronal injury through the production and release of various soluble neurotoxic factors including glutamate (Giulian et al., 1993; Pulliam et al., 1994; Zink et al., 1999; Belmadani et al., 2001; Jiang et al., 2001). While glutamate mediates numerous vital physiologic processes (Cutler and Dudzinski, 1974; Fonnum, 1984; Orrego and Villanueva, 1993), in high concentrations, it has been found to induce neuronal damage (Olney, 1971; McCall et al., 1979; Choi, 1988; Newcomb et al., 1997). In HIV-1-infected patients, CSF glutamate levels are correlated with the severity of the dementia and with the degree of brain atrophy (Ferrarese et al., 2001). Although HIV-1 infected macrophages have been suggested to increase extracellular glutamate (Jiang et al., 2001), the potential sources of CSF glutamate remain elusive.
Phosphate-activated glutaminase is the primary enzyme responsible for the generation of glutamate in the CNS; it localizes to the inner membrane of mitochondria and produces glutamate by catalyzing the deamination of glutamine (Ward et al., 1983; Shapiro et al., 1985; Nicklas et al., 1987; Shapiro et al., 1991; Würdig and Kugler, 1991; Curthoys and Watford, 1995; Laake et al., 1999). Two different phosphate-activated glutaminase, GLS1 (kidney-type) and GLS2 (liver-type), exist in mammals and are encoded by separate genes on different chromosomes (for review, see Erdmann et al., 2006). Specifically, the GLS1 gene is located on chromosome 2 in humans (Mock et al., 1989) and has various isoforms generated through tissue-specific alternative splicing. Two of the GLS1 isoforms, glutaminase C (GAC) and kidney-type glutaminase (KGA), are present in brain tissue (Elgadi et al., 1999), and shares much of the functional GLS1 regions but each possesses a unique 3′ tail (Porter et al., 2002). Because glutaminase is the predominant glutamine-using enzyme of the brain, research has suggested its relevance to glutamate production and excitotoxicity (Kvamme et al., 1982; Curthoys and Watford, 1995; Holcomb et al., 2000). In a previous study, we have identified glutamate production by HIV-1 infected human monocyte-derived macrophage (MDM) (Zhao et al., 2004). Furthermore, this increase in glutamate by MDM was found to be neurotoxic and dependent on productive HIV infection as well as the presence of glutamine and glutaminase activity (Zhao et al., 2004; Erdmann et al., 2007, 2009; Tian et al., 2008). Despite these research advances, the glutaminase regulation and function as well as the mechanism responsible for the excess glutamate generation by HIV-1-infected microglia remains unclear.
Increased expression of GLS1 in microglia has been suggested to contribute to neurotoxicity in a recent mouse model (Maezawa and Jin, 2010). To determine whether microglia GLS1 contributes to HIV-1-associated neurotoxicity, in this study, we characterized the expression of the different glutaminase isoforms in microglia during HIV infection. Furthermore, we targeted microglia glutaminase by using specific siRNA and a small molecule glutaminase inhibitor, and identified GAC, one of the GLS1 isoforms, as a possible cause of excess levels of excitotoxic glutamate during HIV-infection.
Materials and Methods
Isolation, culture, and HIV-1 infection of human fetal microglia.
Human fetal microglia culture was prepared from fetal brain tissue-derived microglia-astrocytes mixed culture as previously described (Chao et al., 1994; Ghorpade et al., 1998). Enriched microglia were plated and cultured in the presence of M-CSF (macrophage colony stimulating factor; a generous gift from Genetics Institute) for an additional 7 d before experiments. All tissues were screened and found negative for endotoxin (< 10 pg/ml; Associates of Cape Cod) and mycoplasma contamination (Gen-probe II; Gen-probe Inc.). Laboratory HIV-1ADA strain was used at a multiplicity of infection of 0.05 virus/target cell. Clade B primary viruses [D02-2562 BG (basal ganglia) and G0048 CPx (choroid plexus)] were isolated from the basal ganglia or choroid plexus in the trigone of the lateral ventricle of infected patients with HIV encephalitis (Burkala et al., 2005). Clade C primary isolate (2669I) was isolated from peripheral blood mononuclear cells of HIV-1 infected infant pairs in Africa (Zhang et al., 2005, 2006). The 50% tissue culture infective dose (TCID50) of each viral stock was determined by monitoring infection of TZM-bl cells obtained through NIH AIDS Research and Reference Reagent Program, and all primary viruses were infected with 800 TCID50/ml.
Measurements of reverse transcriptase activity.
HIV-1 replication levels were determined by reverse transcriptase (RT) activity assay as described previously (Huang et al., 2009).
RNA extraction and TaqMan real-time RT-PCR.
Total RNA was isolated with TRIzol Reagent (Invitrogen Corp) and RNeasy Kit according to the manufacturer's protocol (Qiagen Inc.). Primers used for real-time RT-PCR include GAC (ID #528445: the forward sequence was 5-TATGGAAAAAAGTGTCACCTGAGTCA-3, the reverse sequence was 5-GCTTTTCTCTCCCAGACTTTCCATT-3, and the probe sequence was 5′-AATGAGGACATCTCTACAACTGTA-3), KGA (ID #489954: the forward sequence was 5-CGAAGATTTGCTTTGTCAGCTATGG-3, the reverse sequence was 5-CTCTGCAGCAGCTACATGGA-3, and the probe sequence was 5-CAGCGGGACTATGATTC-3), GLS1 (ID #Hs00248163_m1*) and GAPDH (part #4310884E) from Applied Biosystems Inc. Real-time RT-PCR was performed using the one-step quantitative TaqMan assay in a StepOne Real-Time PCR system (Applied Biosystems Inc.). Relative KGA, GAC, and GLS1 mRNA levels were determined and standardized with a GAPDH internal control using comparative ΔΔCT method. All primers used in the study were tested for amplification efficiencies and the results were similar.
Western blot.
The brain tissues used in the study were acquired from Manhattan HIV Brain Bank (Dr. Susan Morgello) and Center for Neurovirology and Neurodegenerative Disorders Brain Bank (University of Nebraska Medical Center, Omaha, NE). Brain tissues were cut into 0.5 g in weight and homogenized by a Microson Ultrasonic Cell Disruptor. The resulting homogenates were centrifuged and supernatants were saved as protein lysates. Proteins from lysates were separated by SDS-PAGE. After electrophoretic transfer to polyvinyldifluoridene (PVDF) membranes (Millipore and Bio-Rad), proteins were treated with purified primary antibodies MAP-2 (monoclonal mouse, Millipore Bioscience Research Reagents), Caspase 3, and STAT1 (Cell Signaling Technology), polyclonal antibody for GAC and KGA (Dr. N. Curthoys, Colorado State University, Fort Collins, CO), HIV-1 p24 (monoclonal mouse anti-p24, IgG, DAKO Corp), or β-actin (Sigma-Aldrich) overnight at 4°C followed by a horseradish peroxidase-linked secondary anti-rabbit or anti-mouse antibody (Cell Signaling Technology). Antigen-antibody complexes were visualized by Pierce ECL Western Blotting Substrate. For data quantification, films were scanned with a CanonScan 9950F scanner; the acquired images were then analyzed on a Macintosh computer using the public domain NIH ImageJ program (developed at the U.S. National Institutes of Health and available on the internet at http://rsb.info.nih.gov/nih-image/).
siRNA knockdown of glutaminase.
siRNA knockdown in microglia was performed as previously described (Peng et al., 2006). Briefly, siRNA duplex targeted against GAC was custom synthesized by Dharmacon (Thermo Scientific), the 19-base targeting region was GGACATCTCTACAACTGTA. Predesigned GLS1 siRNA (Assay ID #s5840) was purchased from Applied Biosystems. At 2 d post-HIV-1 infection, microglia were transfected with 100 nm siRNA duplex for 24 h in the presence of siIMPORTER (Millipore) according to the manufacturer's instructions. Nonspecific control siRNA from Dharmacon (part #D-001210-01-02) and Applied Biosystems Inc. (part #AM4635) were also transfected at the same concentration as controls to GAC and GLS1 siRNA, respectively.
Analyses of glutamate and glutamine by RP-HPLC.
HPLC analysis was performed using an Agilent 1200 liquid chromatograph and fluorescence detector as previously described (Zhao et al., 2004) with a few modifications. Briefly, each 5 μl sample or standard solution was derived with ortho-phthalaldehyde (OPA, Agilent) for fluorescence detection. For each experiment, 250 μl of sample was used and was mixed with equal volumes of 3% perchloric acid (Aldrich). This mixture was then immediately neutralized with 11.5 μl of saturated potassium carbonate (Aldrich). Samples were centrifuged at 14,000 rpm for 15 min at 4°C. Samples were then injected into the HPLC system. The experiments used 4.6 × 150 mm, 3.5 μm ZORBAX Eclipse AAA analytical columns (Agilent). Glutamate detection was monitored using a fluorescence detector with wavelengths of excitation at 340 nm and emission at 450 nm. A gradient elution program was optimized for glutamate measurement with a flow rate 1.5 ml/min. This program began at 100% mobile phase A, containing 40 mm sodium dihydrogen phosphate (the solution was adjusted to pH 7.8 with 10N sodium hydroxide). At 17 min, 60% mobile phase B was used containing 45% acetonitrile and 45% methanol. Total analysis time was 30 min.
Analyses of glutamate by Amplex Red Glutamic Acid/Glutamate Oxidase Assay Kit.
Glutamate levels in the brain tissues were determined by Amplex Red Glutamic Acid/Glutamate Oxidase Assay Kit (Invitrogen) based on the manufacturer's instruction. Brain tissue lysates were diluted to the same protein concentration before entering the assay.
Assays of recombinant glutaminase activity.
Full human GAC amino acid coding region was cloned into the pGEX-4t-1 vector and the protein was expressed with an N-terminal glutathione S-transferase (GST)-tag. The GST-tagged protein was purified by a GST.Bind Kit (Novagen). Glutaminase enzyme activity of recombinant human glutaminase was assessed by glutaminase activity assay as described previously (Erdmann et al., 2007).
MTT reduction assay.
Cell viability was assessed by MTT reduction as described previously (Jiang et al., 2001; Zhao et al., 2004).
MAP2 ELISA.
Primary rat cortical neuron (RCN) cultures were plated in poly-l-lysine-coated 96-well plates at concentrations of 4 × 10⁴ cells per well. MAP-2 neuronal antigen was determined in RCNs using colorimetric ELISA as described previously (Zheng et al., 2001; Constantino et al., 2011). Briefly, fixed RCNs were blocked with 3% normal goat serum in PBS and incubated for 1 h with antibodies against MAP-2 (Millipore Bioscience Research Reagents), followed by anti-mouse biotinylated antibody (Vector Laboratories) for 30 min. Avidin/biotin complex solution (Vector Laboratories) was added for 30 min, then color was developed using TMB substrate (Sigma-Aldrich) and terminated with 1 m H2SO4 (Sigma-Aldrich). The absorbance was read at 450 nm using a microplate reader (Bio-Rad Laboratories). Glutamate (50 μm, Sigma-Aldrich) was used as a positive neurotoxicity control. RCN culture wells in the same plate that had undergone the same procedure but were incubated without anti-MAP-2 primary antibody were used as negative control and for background subtraction.
Immunocytochemical assays.
Human microglia were plated on 12 mm coverslips in 24-well plates. Five days after infection with HIV-1, cells were fixed with 4% paraformaldehyde at room temperature then incubated with methanol for 20 min at −20°C. Fixed cells were blocked with 3% bovine serum albumin in PBS and then incubated with primary antibodies to glutaminase 1 mixed with an antibody to CD163 or p24 (DAKO) at 4°C overnight. Normal mouse or rabbit IgG with matched isotype were used as negative controls for the staining. Cultures were washed and then secondary antibodies, anti-mouse IgG (coupled with green dye, Alexa Flour 488, Invitrogen) or anti-rabbit IgG (coupled with a info-red dye, Alexa Fluor 647, Invitrogen), were added for 1 h at room temperature. Nuclear DNA were labeled with Hoechst 33342 (Sigma-Aldrich) for 10 min after the secondary antibody at room temperature. Coverslips were mounted on glass slides with mounting medium (Sigma-Aldrich). Triple immunostaining was examined by a Bio-Rad MRC1024ES confocal laser scanning microscope using a triple laser line and simultaneous triple display mode of the Bio-Rad LaserSharp imaging program. For morphological data that demonstrated neuronal damage after exposed to supernatant of HIV-1-infected microglia, MAP2 immunostaining was examined by a Nikon Eclipse TE2000E fluorescent microscope and photographed by a digital camera (CoolSNAP EZ, Photometrics). All obtained images were imported into Image-ProPlus, version 7.0 (Media Cybernetics) for quantifying levels of MAP2 staining. The assessors were blinded during image acquisition or quantification.
Statistical analysis.
Data were analyzed as means ± SEM unless otherwise specified. The data were evaluated statistically by the ANOVA, followed by the Tukey test for paired observations. Significance was considered with a p value <0.05. All experiments were performed with at least three donors to account for any donor-specific differences. Assays were performed at least three times in triplicate or quadruplicate.
Results
HIV-1-infected microglia mediate neurotoxicity
Human fetal microglia were differentiated in adherent culture for 7 d in the presence of M-CSF and then were infected with HIV-1ADA. Uninfected microglia appeared to retain their characteristic spindle-shaped morphology (Fig. 1Aa–c), while infected microglia became larger in size due to cell fusion (Fig. 1Ad–f) as the infection progressed from day 1 through day 7. The HIV-1 replication levels, assessed by the HIV-1 RT activity assay, continued to increase (Fig. 1B) throughout this time period in the infected microglia as well. At 1, 4, and 7 d of infection, microglia were washed and incubated in serum-free Neurobasal media for 24 h. Supernatants collected from control and HIV-infected microglia were subsequently applied to RCN culture to test their neurotoxic potential. The supernatants of microglia cultures collected from 4 and 7 d post-HIV-1 infection dramatically reduced the immunofluorescent staining of the dendritic marker MAP2 (Fig. 1C,D), compared with uninfected control. The neuronal damage was further shown by cell viability assay of the RCNs (Fig. 1E), or a semiquantitative ELISA assay (Fig. 1F) for the MAP2 immunoactivity in the culture. Similar to the morphological changes of dendrites, the viability assay and MAP2 ELISA showed a decrease of cell viability and reduction of MAP2 immunoactivity when exposed to HIV-1-infected microglia supernatant, compared with the uninfected supernatant. To further verify the neurotoxic potential of HIV-1-infected microglia, three primary HIV-1 isolates were used to infect microglia. The primary virus included two clade B and one clade C isolates previously characterized in our lab (Constantino et al., 2011). These primary viruses established infection in microglia, which was demonstrated by the elevated HIV-1 RT activity of the culture supernatants (Fig. 1G). Similar with HIV-1ADA, primary HIV-1 isolate-infected microglia were also neurotoxic, dramatically reducing the cell viability (Fig. 1H) and the MAP2 immunoactivity (Fig. 1I) of RCNs. These data suggest that HIV-1-infected microglia are highly neurotoxic. Because the neurotoxic effect resulted from treatment with culture supernatant of HIV-1-infected microglia, it is likely that one or more soluble factors secreted by the cells are responsible.
Figure 1.

Neurotoxic potential of HIV-1-infected microglia. Human microglia were infected with HIV-1ADA. A, Bright-field pictures of the control (a–c) and HIV-1-infected microglia cultures (d–f) were taken at 1, 4, or 7 d postinfection. B, At 1, 4, or 7 d postinfection, cells were washed and then incubated for 24 h in serum-free Neurobasal medium, cell culture supernatants were collected. HIV replication levels were determined by HIV RT activity assay from the culture supernatants. C–F, Supernatants from microglia was used to treat RCNs to determine the neurotoxic potential. Morphological changes of neurons and dendrites, RCN viability and neuronal loss were determined by MAP2 staining (C, D), MTT (C) and MAP2 ELISA (D), respectively. G–I, Microglia were infected with primary HIV clade B or clade C isolates. HIV infection levels were determined by HIV RT activity assay (G). Neurotoxicity of primary HIV-1-infected microglia was determined by MTT (H) and MAP2 ELISA (I), respectively. Results are representative of four independent experiments. *p < 0.05, **p < 0.01, compared with control.
Neurotoxicity of HIV-1-infected microglia is dependent on glutamate production
As stated previously, high concentrations of extracellular glutamate induce neuronal damage. While it has been established that HIV-1-infected macrophages are an important cellular source of extracellular glutamate, it is unclear whether HIV-1-infected microglia have similar potential. To determine the extracellular glutamate concentration, we used RP-HPLC to quantify the levels in microglia culture supernatants over the course of HIV-1 infection. As the infection progressed from day 1 through day 7, the concentration of extracellular glutamate continued to increase (Fig. 2A). Similarly, primary HIV-1 isolate-infected microglia increased the concentrations of extracellular glutamate, when compared with the uninfected control (Fig. 2B). The RCN viability, as well as MAP2 immunoactivity, was inversely correlated with the glutamate concentration (Fig. 2C,D). Interestingly, the Spearman correlation between neurotoxicity and glutamate (r = −0.8644) was stronger than the correlation between the neurotoxicity and the HIV-1 replication level (r = −0.5439), indicating a critical role of glutamate in the HIV-1-related neurotoxicity.
Figure 2.

Neurotoxic potential of HIV-1-infected microglia is correlated with glutamate production. A, B, Microglia were infected with HIV-1ADA (A) or primary HIV clade B or clade C isolates (B) as indicated. Glutamate concentrations in the culture supernatant were determined by RT-HPLC. C, D, Correlation of neurotoxicity (MTT) with glutamate or HIV RT activity was determined by Spearman correlation. Results are representative of three independent experiments. **p < 0.01 compared with control.
HIV-1-infected microglia mediate neurotoxicity through the NMDA receptor
To further characterize the neurotoxicity mediated by HIV-1-infected microglia, we tested the involvement of NMDA receptor activation and apoptosis. We pretreated RCNs with MK801, an NMDA receptor antagonist, which effectively blocked NMDA receptor activation. Pretreatment with MK801 blocked glutamate-mediated neurotoxicity (Fig. 3A,B, four columns to the right). Furthermore, pretreatment of MK801 blocked the neurotoxicity mediated by HIV-1-infected microglia (Fig. 3A,B, four columns to the left). Similar results were obtained by Western blotting for MAP2 (Fig. 3C), suggesting that HIV-1-infected microglia mediate neurotoxicity through the NMDA receptor. The HIV-1-infected microglia also induced the activation of caspase 3 in RCNs, which indicates the involvement of apoptosis in the neurotoxicity (Fig. 3C). Interestingly, the apoptosis can be blocked by either MK801 (Fig. 3C,D) or a pan-caspase inhibitor (Fig. 3D). Together, these data suggest that HIV-1-infected microglia mediate neurotoxicity through the NMDA receptor, and this neurotoxicity involves, at least in part, neuronal apoptosis.
Figure 3.

HIV-1-infected microglia mediate neurotoxicity through NMDA receptor. A, B, Microglia were infected with HIV-1 for 9 d and supernatants were collected. RCN cultures were treated with 25% control (−) or HIV-infected (+) supernatants in the presence or absence of MK801 (3 μm) for 72 h. Cell viability and neuronal loss were determined by MTT (A) and MAP2 ELISA (B), respectively. Con is the control group for glutamate treatment. C, Whole-cell lysates were collected 48 h after treatment. MAP2 and capase-3 were analyzed by Western blotting. Actin was used as loading control. D, DNA fragmentation induced by supernatants of microglia was determined by Apoptosis ELISA. MK801 (3 μm) or pan caspase inhibitor (10 μm) blocked HIV supernatant-induced DNA fragmentation. **p < 0.01 compared with uninfected microglia, ##p < 0.01 compared with HIV-1-infected microglia.
Glutaminase isoform was upregulated in HIV-1-infected microglia
Since glutaminase is the primary enzyme for glutamate production, it was important to determine whether glutaminase is upregulated in HIV-1-infected microglia. To positively identify the cell population of interest, microglia were initially labeled with CD163, a marker for macrophage and microglia, which revealed that both HIV-1-infected and uninfected microglia had positive CD163 staining under confocal microscopy (Fig. 4A,D). Furthermore, HIV-1-infected cells were also positive for HIV-1 capsid protein p24 (Fig. 4G), and appeared to have formed giant multinucleated cells (Fig. 4D–I). Immunostaining of glutaminase 1 in the same cell cultures revealed that the immunoreactivity of glutaminase was higher in HIV-infected microglia than in the controls (Fig. 4B,E,H). To determine the level of gene expression of glutaminase, real-time RT-PCR was used to evaluate glutaminase 1 and its two isoforms, GAC and KGA. Specifically, mRNA levels of KGA isoform did not increase significantly in HIV-1-infected microglia at all the time points that we examined (Fig. 5A). In contrast, mRNA levels of GAC were upregulated during productive HIV infection at 3 and 7 d postinfection (Fig. 5B). Together, the mRNA levels of glutaminase 1, which includes both KGA and GAC isoforms, were upregulated at 7 d post-HIV infection (Fig. 5C). To confirm the upregulation of GAC, protein levels were quantified through Western blotting using antibodies specific to the C-terminal end of GAC. In the representative donors presented below, there is no significant change in KGA protein levels between control and HIV-infected microglia at any time point (Fig. 5D). In contrast, consistent with the upregulation of GAC mRNA, the protein levels of GAC were upregulated by 32, 54, and 233% at day 1, 4, and 7 postinfection, respectively (Fig. 5D). The p24 levels in HIV-1-infected microglia were detectable by Western blotting at 4 and 7 d postinfection (Fig. 5D), confirming productive replication levels of HIV-1 in the microglia. Together, these data demonstrate glutaminase isoform GAC is dysregulated in HIV-1-infected microglia.
Figure 4.

Increased glutaminase staining in HIV-1-infected microglia. Seven days after infection with HIV-1, microglia from uninfected (control) or infected cultures were fixed and stained with CD163 (A, D), P24 (G), and glutaminase antibodies (B, E, H). A–C, Control uninfected microglia. D–I, HIV-1-infected microglia. HIV-infected microglia had higher amounts of glutaminase compared with uninfected microglia. C, F, and I are merged pictures of A, B; D, E, and G, H, respectively. Images were acquired from a Bio-Rad MRC1024ES LASER scanning confocal microscope. Magnifications (A–I), 600×. Panels are representative of three separate donors.
Figure 5.

Dysregulation of glutaminase during HIV-1 infection. A–C, Microglia were infected by HIV-1 at a multiplicity of infection of 0.05 virus/target cell. At 1, 4, and 7 d postinfection, RNA was collected, and expression of glutaminase isoforms KGA (A), GAC (B), and GLS1(C) was analyzed using real-time RT-PCR. Data were normalized to GAPDH and presented as fold change compared with control. **p < 0.01 compared with day-matched control. D, Lysates were collected at 1, 4, and 7 d postinfection and analyzed by Western blot for KGA, GAC, glutaminase 1, and p24. Actin was used as loading control.
Glutaminase isoform was upregulated in HIV-1-associated dementia
To further corroborate the clinical relevance of the GAC dysregulation, we evaluated the GAC levels in the frontal cortex derived from the HIV-1-infected patients, including four HIV-1 serum-positive individuals with dementia and six HIV-1 serum-positive individuals where no neuropathologic changes were detected (Table 1). Seven HIV serum-negative patients were used as a negative control. Since enhanced expression of STAT1 has been observed in postmortem tissues with HIV-1-associated dementia (Chaudhuri et al., 2008), we first tested whether STAT1 was increased in the HIV dementia group. Indeed, STAT1 was significantly increased in tissues with HIV-1-associated dementia, when compared with HIV-1-infected individuals without dementia or HIV serum-negative controls (Fig. 6A,B). After confirming the innate immune response in tissues with HIV-1 dementia, we went on to determine KGA and GAC levels in the tissues. The KGA levels did not show any significant regulation (Fig. 6C). In contrast, the GAC levels in HIV dementia individuals were significantly higher than HIV-1-infected individual without dementia or HIV serum-negative control (p < 0.05, Fig. 6D). Interestingly, the levels of GAC were correlated with the STAT1 levels (Fig. 6E), indicating the regulation of GAC may be part of an immune response to HIV-1 infection in the CNS. We also detected the glutamate concentrations in the brain tissues through a Glutamic Acid/Glutamate Oxidase Assay Kit. As expected, the glutamate concentrations were higher in HIV-1 serum-positive tissues (Fig. 6F), consistent with previous publication (Ferrarese et al., 2001). More importantly, the glutamate concentrations in the brain tissues were significantly correlated with the GAC levels (p < 0.05, Fig. 6G), indicating that dysregulated glutaminase may be responsible for the elevated glutamate levels in those HIV-1 serum-positive patients.
Table 1.
Clinical data for human brain tissue samples
| Case number | HIV-1 infection | Age (years) | Gender, Race | Viral load (copies/ml) | Drug abuse | Pmi (h) | Other systemic diseases and cause of death |
|---|---|---|---|---|---|---|---|
| 1 | HIVE | 44 | M, White | 389,120 | Current use | 4 | Cachexia, Kaposi sarcoma of lymph nodes, chronic hepatitis and cirrhosis |
| 2 | HIVE | 32 | M, White | 1,098,947 | Current use | 14.5 | Acute bronchopneumonia |
| 3 | HIVE | 41 | M, White | 6,940 | Previous use | 5.5 | Bacterial bronchopneumonia |
| 4 | HIVE | 37 | M, Black | 750,000 | No use | 4 | Aspiration pneumonia and pulmonary abscess with aspergillus |
| 5 | HIV | 41 | M, White | 501 | Previous use | 13 | Advanced adenocarcinoma of the lung with metastases to multiple organs |
| 6 | HIV | 50 | M, White | N/A | Previous use | 18 | Esophagus carcinoma |
| 7 | HIV | 45 | F, White | 1,029 | Previous use | 2.5 | AIDS complications and liver failure |
| 8 | HIV | 33 | M, white | 750,000 | No use | 17 | Lymphoid depletion, pulmonary edema |
| 9 | HIV | 34 | F, Black | N/A | No use | 8.5 | Pneumonia |
| 10 | HIV | 43 | M, Black | 252,604 | No use | 6 | CMV infection in multiple organs |
| 11 | Seronegative control | 66 | F, White | N/A | No use | 12.5 | Severe atherosclerosis, GI bleed |
| 12 | Seronegative control | 73 | M, White | N/A | No use | 10 | Peritonitis, hypertension, and nephrosclerosis |
| 13 | Seronegative control | 55 | M, White | N/A | No use | 16 | Sudden cardiac death, Coronary artery disease |
| 14 | Seronegative control | 70 | M, Black | N/A | No use | 11 | Cardiac failure, coronary artery disease, aortic stenosis |
| 15 | Seronegative control | 37 | F, White | N/A | Current | 18.5 | Interstitial fibrosis of heart, morbid obesity associated with sudden death |
| 16 | Seronegative control | 67 | M, White | N/A | Current | 2 | Chronic obstructive pulmonary disease |
| 17 | Seronegative control | 48 | M, White | N/A | No use | 12 | Cardiac arrhythmias |
M, Male; F, female; N/A, not available; Pmi, postmortem interval.
Figure 6.

Dysregulation of glutaminase in brain tissues of HIV-1-associated dementia. A, Postmortem brain tissue collected from HIV-1-associated dementia patients, HIV serum-positive patients without dementia, and HIV serum-negative patients were lysed and subjected to Western blotting for STAT1, KGA, and GAC. β-Actin levels were used as loading controls. B–D, Levels of STAT1 (B), KGA (C), and GAC (D) were normalized as a ratio to β-actin and shown as fold change relative to the average of HIV serum-negative controls. *p < 0.05, **p < 0.01 compared with HAND patients. E, Correlation of GAC with STAT1 was determined by Spearman correlation. F, Glutamate concentrations in the brain lysates were shown. G, Correlation of GAC with glutamate levels was determined by Spearman correlation.
siRNA knockdown or inhibitor of the GAC isoform reduced neurotoxicity induced by HIV-1-infected microglia
To test the functional significance of glutaminase upregulation in HIV-1-infected microglia, we applied siRNA to the culture. Microglia were infected with HIV-1ADA for 2 d before being transfected with either nonspecific siRNA or siRNA targeting the GLS1. A siRNA targeting a coding region of GLS1 shared by its isoforms, including GAC and KGA, was initially used. Four days post-siRNA transfection, RNA was collected and real-time RT-PCR analysis demonstrated a decrease in glutaminase 1 (Fig. 7A), GAC (Fig. 7B), and KGA (Fig. 7C) mRNA. Glutamate levels in the culture supernatants of HIV-1-infected microglia were also significantly decreased by GLS1 siRNA compared with nonspecific siRNA-transfected HIV-infected cultures (p value <0.01, Fig. 7D). When tested for neurotoxic potential in RCNs, application of supernatant collected from GAC siRNA-transfected HIV-1-infected microglia resulted in higher cell viability (Fig. 7E) and higher MAP2 immunoreactivity (Fig. 7F) than supernatants from nonspecific siRNA-transfected HIV-1-infected microglia, suggesting the neurotoxic potential of microglia glutaminase 1 during HIV-1 infection.
Figure 7.

Reduced neurotoxicity by glutaminase 1 siRNA. Control (−) or HIV-1-infected microglia (+) were transfected with glutaminase 1 or control siRNA, and supernatants, RNA were collected. GAC expression (A), GLS1 expression (B), and KGA expression (C) were determined by real-time RT-PCR. D, Glutamate concentrations in the culture supernatant were determined by RT-HPLC. RCN cultures were treated with supernatants from microglia cultures. E, F, Cell viability and neuronal loss were determined by MTT (E) and MAP2 ELISA (F), respectively. **p < 0.01 compared with control siRNA group. ##p < 0.01 compared with HIV-1-infected microglia transfected with control siRNA.
Since the glutaminase upregulation in HIV-1-infected microglia was found to be predominantly in its GAC isoform, we next tested the relevance of GAC to the neurotoxic potential of HIV-1-infected microglia. In a transfection procedure similar to that of the GLS1 siRNA, HIV-1-infected microglia were transfected with either nonspecific siRNA or siRNA targeting the C terminus of GAC. Real-time RT-PCR analysis demonstrated a decrease in glutaminase 1 and GAC mRNA following transfection with GAC siRNA (Fig. 8A,B), whereas the levels of KGA mRNA were not affected (Fig. 8C). Glutamate levels in the culture supernatants of infected microglia were found to be significantly decreased by GAC siRNA in infected microglia cultures compared with the nonspecific siRNA-transfected HIV culture (p value <0.01, Fig. 8D). Furthermore, supernatant collected from GAC siRNA-transfected HIV-1-infected microglia had higher MAP2 immunoreactivity (Fig. 8E,F,H) and higher cell viability (Fig. 8G) than supernatants from nonspecific siRNA transfected HIV-1-infected microglia, suggesting the neurotoxic potential of microglia GAC during HIV-1 infection.
Figure 8.
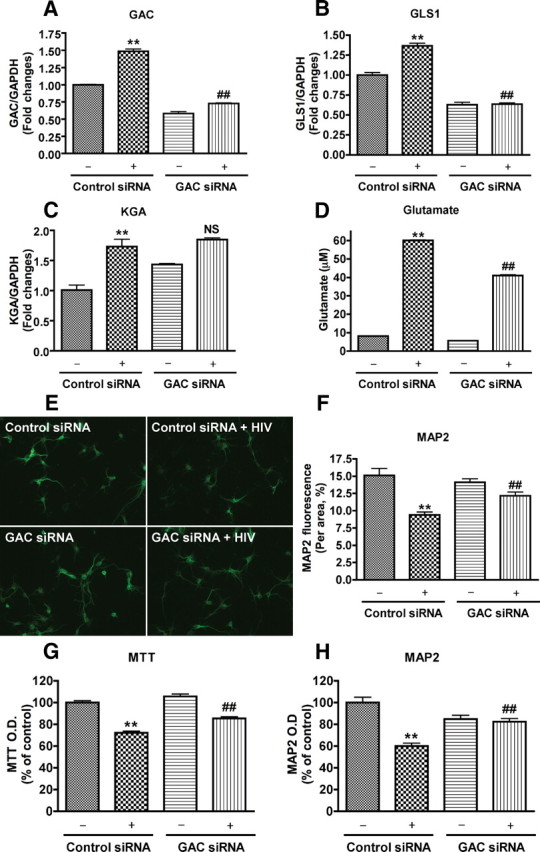
Reduced neurotoxicity by glutaminase C siRNA. Control (−) or HIV-1-infected microglia (+) were transfected with glutaminase C or control siRNA, and supernatants, RNA were collected. GAC expression (A), GLS1 expression (B), and KGA expression (C) were determined by real-time RT-PCR. D, Glutamate concentrations in the culture supernatant were determined by RT-HPLC. RCN cultures were treated with supernatants from microglia cultures. E–H, Morphological changes of neurons and dendrites, cell viability, and neuronal loss were determined by MAP2 staining (E, F), MTT (G) and MAP2 ELISA (H), respectively. **p < 0.01 compared with control siRNA group, ##p < 0.01 compared with HIV-1-infected microglia transfected with control siRNA.
In previous publications, we tested a panel of glutaminase inhibitors, one of which showed an excellent potency with minimal toxicity to neurons or macrophages (Erdmann et al., 2007; Tian et al., 2008). Here we have further tested the inhibitor in the glutaminase activity of recombinant human GAC. The control inhibitor compound showed minimum inhibition of glutaminase activity, whereas the glutaminase inhibitor showed a dose-dependent inhibition of glutaminase activity (Fig. 9A). This specific inhibitor was subsequently used to help determine the role of glutaminase in HIV-1-infected microglia-mediated neurotoxicity. Preincubation with the glutaminase inhibitor for 24 h did not affect HIV-1 replication levels in microglia (Fig. 9B), but significantly reduced the glutamate levels in the supernatant (Fig. 9D). Along with the reduction of glutamate levels, the neurotoxicity was also blocked by the glutaminase inhibitor, indicating a critical role of glutaminase in the production of glutamate during HIV-1 infection of microglia (Fig. 9C,E–G).
Figure 9.

Reduced neurotoxicity by glutaminase Inhibitor. A, Recombinant GAC was treated with various concentrations of glutaminase inhibitor or a control compound. The glutaminase activity were determined by enzyme a activity assay. **p < 0.01 compared with control inhibitor compound. Control or HIV-1-infected microglia were treated with glutaminase inhibitor, control compound, or solvent control (DMSO) and supernatants were collected. B, HIV replication levels were determined by RT activity assay. D, Glutamate concentrations in the culture supernatant were determined by RT-HPLC. C, E–G, RCN cultures were treated with supernatant from microglia culture. Morphological changes of neurons and dendrites, cell viability and neuronal loss were determined by MAP2 staining (C, E), MTT (F) and MAP2 ELISA (G), respectively. *p < 0.05 compared with control compound; **p < 0.01 compared with microglia treated with control compound or solvent control, ##p < 0.01 compared with HIV-1-infected microglia treated with control compound or solvent control.
Discussion
Our previous reports have described elevations in the levels of glutaminase isoform GAC, glutamate, and the neurotoxic potentials in HIV-1-infected MDM (Zhao et al., 2004; Erdmann et al., 2007, 2009; Tian et al., 2008). Despite these studies, little information is currently available describing the contribution of the excess glutamate in the resident brain cells during HAND. In the present study, we used a well characterized human fetal microglia culture. HIV-1 infection in this microglia culture produced significantly higher levels of glutamate in the supernatants and cause greater levels of neurotoxicity through the NMDA receptor when compared with uninfected controls (Figs. 1–3). Furthermore, RNA levels of the glutaminase 1 and its isoform GAC were found to be significantly increased during productive HIV-1 infection (Figs. 4, 5). These findings were supported by Western blotting of glutaminase protein where the GAC were found to be increased (Fig. 5). The relevance of the glutaminase to the neuropathogenesis of HIV-1 infection, particularly with regard to the HIV-1-associated dementia, was further indicated when GAC levels in the postmortem tissues of HIV dementia individuals were significantly higher than HIV-1-infected individual without dementia or HIV serum-negative control (Fig. 6). The GAC levels in the brain tissues were significantly correlated with the glutamate concentrations, indicating that dysregulated glutaminase may be responsible for the elevated glutamate levels in HIV-1 serum-positive patients. Last, both a small molecule GLS inhibitor, as well as siRNA targeting of the GAC isoform in microglia significantly decreased glutamate production and alleviated HIV-1-mediated neurotoxicity (Figs. 7–9). These findings support the hypothesis that HIV-1 infection enhances glutamate generation through GAC, one of the GLS1 isoforms in microglia, and therefore leads to an increase in NMDA receptor-mediated neurotoxicity. Cumulatively, we characterized glutaminase regulation in HIV-1-infected microglia and identified mitochondrial glutaminase as a potential source of excess glutamate production.
Microglia are the resident macrophage in the brain and are associated with the pathogenesis of inflammatory brain disorder such as HAND. Our study extends many previous observations into microglia, which show similar aspects with MDM, includes glutamate production, glutaminase regulation, and neurotoxic potentials. However, the potential differences of HIV-1 infection in MDM versus microglia were highlighted in this study. Our cultured microglia had distinct morphology and were plated in a much less density (0.1 million microglia versus 1.1 millions MDM per well). Although purified microglia have the potential to proliferate and we do see an increase in the cell number over time during the adherent culture of microglia, the number of microglia in the study is by no means close to that of the dense culture of MDM. Despite at a reduced cell density, microglia produce markedly elevated glutamate levels. In this sense, microglia, as resident cells in the CNS, may have greater relevance to glutamate production and the excitotoxicity compared with MDM.
Excitotoxicity through the NMDA receptor is a fundamental component of various neurodegenerative disorders. In HAND, although a variety of factors clearly contribute to HAND pathogenesis, glutamate appears to be a critical component of HAND excitotoxicity. Glutaminase converts glutamine, which is widely available in the CNS in the millimolar range, to glutamate in an energetically favorable process. Identify the cell type specific glutamate production and the underlying mechanisms are important. It has been hypothesized that increased glutamate release, reduced glutamate uptake, increase glutaminase gene expression, enzymatic activity, or release from brain cells could contribute to the excess levels of glutamate. More recently, microglia glutaminase has been suggested to have neurotoxic potentials in MECP2 knock out mice, which underlined the potential pathogenic role of dysregulated glutaminase in the CNS (Maezawa and Jin, 2010).
Little is known about how glutaminase expression is regulated. Recent papers suggest a role for mir-23a/b and NFκB in the regulation of glutamines (Gao et al., 2009). Inflammatory factors, notably TNF-α, also have the ability to increase glutaminase levels in microglia (Yawata et al., 2008). Further, the glutaminase locus is located immediately next to STAT1 on chromosome 2, a predominant pathway of HIV-induced inflammation. Indeed, we have recently identified that type I interferon regulates glutaminase expression through STAT-1 binding (Zhao et al., manuscript in preparation). We have also found that STAT1 phosphorylation is markedly increased in HIV-1 infected microglia (Data not shown), similar to that observed in HIV-1-infected MDM (Huang et al., 2009). It is possible that after HIV-1 infection the innate immune response of the microglia, including the subsequent inflammatory response, leads to the upregulation of glutaminase, particularly the GAC isoform that is seen in this study. In addition, viral infection leads to formation of multinucleated giant cells, as well as the development of mitochondrial stress. This cellular stress has the potential to disrupt membrane stability thereby leading to release of mitochondrial glutaminase. It has yet to be confirmed that HIV-1-infected microglia have a glutaminase release similar to that seen in infected MDM (Erdmann et al., 2009).
Our study identified the enzyme glutaminase was required for the excess glutamate production in HIV-1-infected microglia. Glutaminase protein upregulation was a straightforward hypothesis and was our initial primary focus, but preliminary studies failed to identify any protein regulation of the glutaminase KGA isoform in microglia, similar to that observed with MDM. We were however able to consistently observe GAC upregulation at stages of HIV-1 infection in human microglia. Which component of the HIV-1 infectious process in microglia is responsible for the regulation of glutaminase and the influence of the in vitro environment is not known. The overall significance of the glutaminase isoforms is still unclear, but GAC regulation has recently been observed in a variety of tumors (Szeliga et al., 2008), indicating the GAC isoform is possibly regulated in an active fashion whereas KGA is constitutively expressed. The significant upregulation of GAC mRNA is consistent with the increase in protein levels (Fig. 5). This upregulation is capable of instigating the vast increase in glutamate levels observed in culture, resulting in enhanced cell damage and death (Fig. 8). Despite the dramatic effects of glutaminase in in vitro culture, the relative contribution of glutaminase to neuropathology in vivo is still unclear, as is the importance of the GAC isoform specifically.
Another GLS isoform, live type GLS2 was originally thought to be present only in adult liver tissue, but emerging evidence has revealed that GLS2 expression also occurs in extrahepatic tissues, such as brain. Although GLS2 is present in the brain, the ratio of GLS2 to GLS1 is very small in the brain (Baglietto-Vargas et al., 2004), indicating that most of the brain glutaminase are GLS1, We have test the GLS2 expression in microglia. Notably, while the primers we used had similar amplification efficiency, the GLS2 expression lagged behind GLS1 by at least 10 cycles, putting GLS2 expression at a level close to absent. Thus it is assumed that there is less relevance of GLS2 to HIV-1-infected microglia when compared with GLS1.
Glutaminase may contribute to neuronal damage through glutamate toxicity or enhance oncogenic transformation or growth of cancer cells, the ability to block its function may provide significant therapeutic avenues in a variety of diseases. In HAND, multiple pathways converge to sensitize neuronal populations and generate excitotoxic insults through NDMA Ca2+ influx (Erdmann et al., 2006). Preventing NMDA receptor stimulation with agents such as MK-801 causes serious side effects and therefore is not a viable therapeutic approach. However, partial blockade of NDMA receptors with the drug memantine has shown therapeutic benefit with limited complications (Anderson et al., 2004; Chen and Lipton, 2006). Similarly, targeting all glutaminase will expect significant side effects due to its vital roles in not only generation of glutamate as a neurotransmitter, but also its contribution to cellular metabolism as was evidenced by recent knock-out studies (Masson et al., 2006). However, drugs that modulate glutaminase may be able to control excess glutamate generation and reduce excitotoxicity. Through the determination of the mechanisms involved in this process, and the development of glutaminase inhibitors such as those tested in our previous work (Erdmann et al., 2007; Tian et al., 2008), glutaminase may emerge as a viable therapeutic target of neurodegenerative disorders.
Footnotes
This work was supported in part by the following research grants by the National Institutes of Health: R01 NS 41858-01, R01 NS 061642-01, 3R01NS61642-2S1, R21 MH 083525-01, P01 NS043985, and P20 RR15635-01 (J.C.Z.). It was also supported by National Natural Science Foundation of China Grant 81028007. We kindly thank Dr. Nathan Erdmann, Dr. Changhai Tian, Dr. Hui Peng, Kristin Leland, Dr. Angelique Walstrom, Agnes Constantino, Dr. Xilin Chen, Ling Ye, Matt Beaver, Myhanh Che, Na Ly, and Lynn Taylor (Colorado State University), who provided support for this work. We thank Dr. Yuri Persidsky, Dr. Susan Morgello, and Dr. Anuja Ghorpade, who assisted with the brain tissue specimens. Julie Ditter, Emilie Scoggins, Johna Belling, and Robin Taylor provided outstanding administrative and secretarial support.
The authors declare no competing financial interests.
References
- Anderson ER, Gendelman HE, Xiong H. Memantine protects hippocampal neuronal function in murine human immunodeficiency virus type 1 encephalitis. J Neurosci. 2004;24:7194–7198. doi: 10.1523/JNEUROSCI.1933-04.2004. [DOI] [PMC free article] [PubMed] [Google Scholar]
- Baglietto-Vargas D, Lopez-Tellez JF, Moreno-González I, Gutiérrez A, Aledo JC. Segregation of two glutaminase isoforms in islets of Langerhans. Biochem J. 2004;381:483–487. doi: 10.1042/BJ20040523. [DOI] [PMC free article] [PubMed] [Google Scholar]
- Belmadani A, Zou JY, Schipma MJ, Neafsey EJ, Collins MA. Ethanol pre-exposure suppresses HIV-1 glycoprotein 120-induced neuronal degeneration by abrogating endogenous glutamate/Ca(2+)-mediated neurotoxicity. Neuroscience. 2001;104:769–781. doi: 10.1016/s0306-4522(01)00139-7. [DOI] [PubMed] [Google Scholar]
- Burkala EJ, He J, West JT, Wood C, Petito CK. Compartmentalization of HIV-1 in the central nervous system: role of the choroid plexus. AIDS. 2005;19:675–684. doi: 10.1097/01.aids.0000166090.31693.aa. [DOI] [PubMed] [Google Scholar]
- Chao CC, Gekker G, Hu S, Peterson PK. Human microglial cell defense against Toxoplasma gondii: the role of cytokines. J Immunol. 1994;152:1246–1252. [PubMed] [Google Scholar]
- Chaudhuri A, Yang B, Gendelman HE, Persidsky Y, Kanmogne GD. STAT1 signaling modulates HIV-1-induced inflammatory responses and leukocyte transmigration across the blood-brain barrier. Blood. 2008;111:2062–2072. doi: 10.1182/blood-2007-05-091207. [DOI] [PMC free article] [PubMed] [Google Scholar]
- Chen HS, Lipton SA. The chemical biology of clinically tolerated NMDA receptor antagonists. J Neurochem. 2006;97:1611–1626. doi: 10.1111/j.1471-4159.2006.03991.x. [DOI] [PubMed] [Google Scholar]
- Choi DW. Glutamate neurotoxicity and diseases of the nervous system. Neuron. 1988;1:623–634. doi: 10.1016/0896-6273(88)90162-6. [DOI] [PubMed] [Google Scholar]
- Constantino AA, Huang Y, Zhang H, Wood C, Zheng JC. HIV-1 Clade B and C isolates exhibit differential replication: relevance to macrophage-mediated neurotoxicity. Neurotox Res. 2011;20:277–288. doi: 10.1007/s12640-011-9241-3. [DOI] [PMC free article] [PubMed] [Google Scholar]
- Curthoys NP, Watford M. Regulation of glutaminase activity and glutamine metabolism. Annu Rev Nutr. 1995;15:133–159. doi: 10.1146/annurev.nu.15.070195.001025. [DOI] [PubMed] [Google Scholar]
- Cutler RW, Dudzinski DS. Regional changes in amino acid content in developing rat brain. J Neurochem. 1974;23:1005–1009. doi: 10.1111/j.1471-4159.1974.tb10752.x. [DOI] [PubMed] [Google Scholar]
- Elgadi KM, Meguid RA, Qian M, Souba WW, Abcouwer SF. Cloning and analysis of unique human glutaminase isoforms generated by tissue-specific alternative splicing. Physiol Genomics. 1999;1:51–62. doi: 10.1152/physiolgenomics.1999.1.2.51. [DOI] [PubMed] [Google Scholar]
- Erdmann N, Zhao J, Lopez AL, Herek S, Curthoys N, Hexum TD, Tsukamoto T, Ferraris D, Zheng J. Glutamate production by HIV-1 infected human macrophage is blocked by the inhibition of glutaminase. J Neurochem. 2007;102:539–549. doi: 10.1111/j.1471-4159.2007.04594.x. [DOI] [PMC free article] [PubMed] [Google Scholar]
- Erdmann N, Tian C, Huang Y, Zhao J, Herek S, Curthoys N, Zheng J. In vitro glutaminase regulation and mechanisms of glutamate generation in HIV-1-infected macrophage. J Neurochem. 2009;109:551–561. doi: 10.1111/j.1471-4159.2009.05989.x. [DOI] [PMC free article] [PubMed] [Google Scholar]
- Erdmann NB, Whitney NP, Zheng J. Potentiation of excitotoxicity in HIV-1-associated dementia and the significance of glutaminase. Clin Neurosci Res. 2006;6:315–328. doi: 10.1016/j.cnr.2006.09.009. [DOI] [PMC free article] [PubMed] [Google Scholar]
- Ferrarese C, Aliprandi A, Tremolizzo L, Stanzani L, De Micheli A, Dolara A, Frattola L. Increased glutamate in CSF and plasma of patients with HIV dementia. Neurology. 2001;57:671–675. doi: 10.1212/wnl.57.4.671. [DOI] [PubMed] [Google Scholar]
- Fonnum F. Glutamate: a neurotransmitter in mammalian brain. J Neurochem. 1984;42:1–11. doi: 10.1111/j.1471-4159.1984.tb09689.x. [DOI] [PubMed] [Google Scholar]
- Gao P, Tchernyshyov I, Chang TC, Lee YS, Kita K, Ochi T, Zeller KI, De Marzo AM, Van Eyk JE, Mendell JT, Dang CV. c-Myc suppression of miR-23a/b enhances mitochondrial glutaminase expression and glutamine metabolism. Nature. 2009;458:762–765. doi: 10.1038/nature07823. [DOI] [PMC free article] [PubMed] [Google Scholar]
- Ghorpade A, Nukuna A, Che M, Haggerty S, Persidsky Y, Carter E, Carhart L, Shafer L, Gendelman HE. Human immunodeficiency virus neurotropism: an analysis of viral replication and cytopathicity for divergent strains in monocytes and microglia. J Virol. 1998;72:3340–3350. doi: 10.1128/jvi.72.4.3340-3350.1998. [DOI] [PMC free article] [PubMed] [Google Scholar]
- Giulian D, Wendt E, Vaca K, Noonan CA. The envelope glycoprotein of human immunodeficiency virus type 1 stimulates release of neurotoxins from monocytes. Proc Natl Acad Sci U S A. 1993;90:2769–2773. doi: 10.1073/pnas.90.7.2769. [DOI] [PMC free article] [PubMed] [Google Scholar]
- Holcomb T, Taylor L, Trohkimoinen J, Curthoys NP. Isolation, characterization and expression of a human brain mitochondrial glutaminase cDNA. Brain Res Mol Brain Res. 2000;76:56–63. doi: 10.1016/s0169-328x(99)00331-9. [DOI] [PubMed] [Google Scholar]
- Huang Y, Walstrom A, Zhang L, Zhao Y, Cui M, Ye L, Zheng JC. Type I interferons and interferon regulatory factors regulate TNF-related apoptosis-inducing ligand (TRAIL) in HIV-1-infected macrophages. PLoS ONE. 2009;4:e5397. doi: 10.1371/journal.pone.0005397. [DOI] [PMC free article] [PubMed] [Google Scholar]
- Jiang ZG, Piggee C, Heyes MP, Murphy C, Quearry B, Bauer M, Zheng J, Gendelman HE, Markey SP. Glutamate is a mediator of neurotoxicity in secretions of activated HIV-1-infected macrophages. J Neuroimmunol. 2001;117:97–107. doi: 10.1016/s0165-5728(01)00315-0. [DOI] [PubMed] [Google Scholar]
- Kvamme E, Svenneby G, Hertz L, Schousboe A. Properties of phosphate activated glutaminase in astrocytes cultured from mouse brain. Neurochem Res. 1982;7:761–770. doi: 10.1007/BF00965528. [DOI] [PubMed] [Google Scholar]
- Laake JH, Takumi Y, Eidet J, Torgner IA, Roberg B, Kvamme E, Ottersen OP. Postembedding immunogold labelling reveals subcellular localization and pathway-specific enrichment of phosphate activated glutaminase in rat cerebellum. Neuroscience. 1999;88:1137–1151. doi: 10.1016/s0306-4522(98)00298-x. [DOI] [PubMed] [Google Scholar]
- Maezawa I, Jin LW. Rett syndrome microglia damage dendrites and synapses by the elevated release of glutamate. J Neurosci. 2010;30:5346–5356. doi: 10.1523/JNEUROSCI.5966-09.2010. [DOI] [PMC free article] [PubMed] [Google Scholar]
- Masson J, Darmon M, Conjard A, Chuhma N, Ropert N, Thoby-Brisson M, Foutz AS, Parrot S, Miller GM, Jorisch R, Polan J, Hamon M, Hen R, Rayport S. Mice lacking brain/kidney phosphate-activated glutaminase have impaired glutamatergic synaptic transmission, altered breathing, disorganized goal-directed behavior and die shortly after birth. J Neurosci. 2006;26:4660–4671. doi: 10.1523/JNEUROSCI.4241-05.2006. [DOI] [PMC free article] [PubMed] [Google Scholar]
- McCall A, Glaeser BS, Millington W, Wurtman RJ. Monosodium glutamate neurotoxicity, hyperosmolarity, and blood-brain barrier dysfunction. Neurobehav Toxicol. 1979;1:279–283. [PubMed] [Google Scholar]
- Mock B, Kozak C, Seldin MF, Ruff N, D'Hoostelaere L, Szpirer C, Levan G, Seuanez H, O'Brien S, Banner C. A glutaminase (gis) gene maps to mouse chromosome 1, rat chromosome 9, and human chromosome 2. Genomics. 1989;5:291–297. doi: 10.1016/0888-7543(89)90060-8. [DOI] [PubMed] [Google Scholar]
- Newcomb R, Sun X, Taylor L, Curthoys N, Giffard RG. Increased production of extracellular glutamate by the mitochondrial glutaminase following neuronal death. J Biol Chem. 1997;272:11276–11282. doi: 10.1074/jbc.272.17.11276. [DOI] [PubMed] [Google Scholar]
- Nicklas WJ, Zeevalk G, Hyndman A. Interactions between neurons and glia in glutamate/glutamine compartmentation. Biochem Soc Trans. 1987;15:208–210. doi: 10.1042/bst0150208. [DOI] [PubMed] [Google Scholar]
- Olney JW. Glutamate-induced neuronal necrosis in the infant mouse hypothalamus. An electron microscopic study. J Neuropathol Exp Neurol. 1971;30:75–90. doi: 10.1097/00005072-197101000-00008. [DOI] [PubMed] [Google Scholar]
- Orrego F, Villanueva S. The chemical nature of the main central excitatory transmitter: a critical appraisal based upon release studies and synaptic vesicle localization. Neuroscience. 1993;56:539–555. doi: 10.1016/0306-4522(93)90355-j. [DOI] [PubMed] [Google Scholar]
- Peng H, Erdmann N, Whitney N, Dou H, Gorantla S, Gendelman HE, Ghorpade A, Zheng J. HIV-1-infected and/or immune activated macrophages regulate astrocyte SDF-1 production through IL-1beta. Glia. 2006;54:619–629. doi: 10.1002/glia.20409. [DOI] [PMC free article] [PubMed] [Google Scholar]
- Porter LD, Ibrahim H, Taylor L, Curthoys NP. Complexity and species variation of the kidney-type glutaminase gene. Physiol Genomics. 2002;9:157–166. doi: 10.1152/physiolgenomics.00017.2002. [DOI] [PubMed] [Google Scholar]
- Pulliam L, Clarke JA, McGuire D, McGrath MS. Investigation of HIV-infected macrophage neurotoxin production from patients with AIDS dementia. Adv Neuroimmunol. 1994;4:195–198. doi: 10.1016/s0960-5428(06)80257-3. [DOI] [PubMed] [Google Scholar]
- Shapiro RA, Haser WG, Curthoys NP. The orientation of phosphate-dependent glutaminase on the inner membrane of rat renal mitochondria. Arch Biochem Biophys. 1985;243:1–7. doi: 10.1016/0003-9861(85)90767-2. [DOI] [PubMed] [Google Scholar]
- Shapiro RA, Farrell L, Srinivasan M, Curthoys NP. Isolation, characterization, and in vitro expression of a cDNA that encodes the kidney isoenzyme of the mitochondrial glutaminase. J Biol Chem. 1991;266:18792–18796. [PubMed] [Google Scholar]
- Szeliga M, Matyja E, Obara M, Grajkowska W, Czernicki T, Albrecht J. Relative expression of mRNAS coding for glutaminase isoforms in CNS tissues and CNS tumors. Neurochem Res. 2008;33:808–813. doi: 10.1007/s11064-007-9507-6. [DOI] [PubMed] [Google Scholar]
- Tian C, Erdmann N, Zhao J, Cao Z, Peng H, Zheng J. HIV-infected macrophages mediate neuronal apoptosis through mitochondrial glutaminase. J Neurochem. 2008;105:994–1005. doi: 10.1111/j.1471-4159.2007.05197.x. [DOI] [PMC free article] [PubMed] [Google Scholar]
- Ward HK, Thanki CM, Bradford HF. Glutamine and glucose as precursors of transmitter amino acids: ex vivo studies. J Neurochem. 1983;40:855–860. doi: 10.1111/j.1471-4159.1983.tb08058.x. [DOI] [PubMed] [Google Scholar]
- Würdig S, Kugler P. Histochemistry of glutamate metabolizing enzymes in the rat cerebellar cortex. Neurosci Lett. 1991;130:165–168. doi: 10.1016/0304-3940(91)90388-a. [DOI] [PubMed] [Google Scholar]
- Yawata I, Takeuchi H, Doi Y, Liang J, Mizuno T, Suzumura A. Macrophage-induced neurotoxicity is mediated by glutamate and attenuated by glutaminase inhibitors and gap junction inhibitors. Life Sci. 2008;82:1111–1116. doi: 10.1016/j.lfs.2008.03.010. [DOI] [PubMed] [Google Scholar]
- Zhang H, Hoffmann F, He J, He X, Kankasa C, Ruprecht R, West JT, Orti G, Wood C. Evolution of subtype C HIV-1 Env in a slowly progressing Zambian infant. Retrovirology. 2005;2:67. doi: 10.1186/1742-4690-2-67. [DOI] [PMC free article] [PubMed] [Google Scholar]
- Zhang H, Hoffmann F, He J, He X, Kankasa C, West JT, Mitchell CD, Ruprecht RM, Orti G, Wood C. Characterization of HIV-1 subtype C envelope glycoproteins from perinatally infected children with different courses of disease. Retrovirology. 2006;3:73. doi: 10.1186/1742-4690-3-73. [DOI] [PMC free article] [PubMed] [Google Scholar]
- Zhao J, Lopez AL, Erichsen D, Herek S, Cotter RL, Curthoys NP, Zheng J. Mitochondrial glutaminase enhances extracellular glutamate production in HIV-1-infected macrophages: linkage to HIV-1 associated dementia. J Neurochem. 2004;88:169–180. doi: 10.1046/j.1471-4159.2003.02146.x. [DOI] [PubMed] [Google Scholar]
- Zheng J, Thylin MR, Cotter RL, Lopez AL, Ghorpade A, Persidsky Y, Xiong H, Leisman GB, Che MH, Gendelman HE. HIV-1 infected and immune competent mononuclear phagocytes induce quantitative alterations in neuronal dendritic arbor: relevance for HIV-1-associated dementia. Neurotox Res. 2001;3:443–459. doi: 10.1007/BF03033203. [DOI] [PubMed] [Google Scholar]
- Zink WE, Zheng J, Persidsky Y, Poluektova L, Gendelman HE. The neuropathogenesis of HIV-1 infection. FEMS Immunol Med Microbiol. 1999;26:233–241. doi: 10.1111/j.1574-695X.1999.tb01394.x. [DOI] [PubMed] [Google Scholar]