

Abstract
Rare protein enrichment and sensitive detection hold great potential in biomedical studies and clinical practice. This work describes using aptamer-conjugated gold nanorods for the efficient enrichment of rare proteins from buffer solutions and human plasma. Gold nanorod (AuNR) surfaces were modified with a long PEG chain and a 15-mer thrombin aptamer for protein enrichment and detection. Studies of the effect of surface modification on enrichment efficiency of thrombin showed that a change of only one EG6 linker unit, i.e., from 2EG6 to 3EG6, could increase thrombin protein capture efficiency by up to 47%. Furthermore, a 1-ppm sample of thrombin in buffer could be enriched with around 90% efficiency using a low concentration (0.19 nM) of gold nanorod probe modified with 3EG6 spacer, and with the same probe, effective capture was achieved down to 10 ppb (1 ng) thrombin in plasma samples. In addition to α-thrombin enrichment, prothrombin was also efficiently captured from plasma samples via gold nanorods conjugated with 15-mer thrombin aptamer. Our work demonstrates efficient enrichment of rare proteins using aptamer modified nanomaterials, which can be used in biomarker discovery studies.
Keywords: Protein Enrichment, Gold Nanorods, Surface Modification, Electrophoresis
INTRODUCTION
Rare protein enrichment has great significance in clinical applications, biomedical studies, proteomic studies and signal transduction. Because changes in rare protein abundances or structures are often associated with disease pathogenesis, recognition of these indications may lead to early diagnosis.1–5 Previous attempts to capture and detect low-abundance proteins from biological media have met with limited success, generally from the lack of robust, sensitive and specific capturing probes.2 In order to achieve these designer features, surface modification of nanoparticles, as capture scaffolds, plays an essential role.
Specific capturing can be accomplished with affinity tags like proteins6, antibodies7 and aptamers5 that can be conjugated to nanomaterials. Affinity tag proteins can be used as bait for direct detection of their target proteins. However, this type of protein-protein interaction is limited by weak binding, which is further decreased when the bait protein is used outside of the context of the native protein. This weak binding affinity can also lead to nonspecific binding with more abundant proteins in the medium.6 Antibodies are used as affinity tags in immunoprecipitation (IP) experiments, which are usually performed with gel-conjugated antibodies that can specifically bind to their target proteins.7 However, because these agarose or sepharose beads have highly porous structures, large target protein molecules may not be able to diffuse adequately into the pores. In addition, the porous structure can also increase the nonspecific binding of smaller molecules that can easily diffuse into the pores. Another drawback of gel beads is rapid precipitation caused by their large sizes (>1μm), which can cause incomplete interactions with the proteins of interest.8 As an alternative to gel beads, monodispersed, superparamagnetic beads with diameters varying from nm to μm are used to minimize sample loss and facilitate the isolation process via magnetic separation.9–11 However, in order to fabricate magnetic nanoparticles (MNPs) with good size control and narrow size distribution, they are generally synthesized in the presence of hydrophobic surfactants in organic solvents by thermal decomposition of the precursors. For further biological applications in aqueous solutions, hydrophilic polymers should be tethered to the surface of hydrophobic MNPs, which is fairly challenging due to the inert MNP surface.12
Gold nanoparticles (AuNPs) have become attractive choices for biomedical applications because of their unique physical and chemical properties. Gold nanoparticles have been used for the detection of specific DNAs13–15 and proteins,3–5,16 because they can be easily functionalized via simple thiolate chemistry, and they show significant size-dependent color differences. In these “self-assembled monolayer” modifications, the dispersibility of AuNPs in solutions can be increased. For example, after PEG (polyethylene glycol) modification, AuNPs can remain suspended for months.5 Thus, despite the facile isolation of MNPs, AuNPs are preferred over MNPs due to their easy surface functionalization. Moreover, surface-only binding can avoid limitations in the sizes of the target proteins and eliminate the necessity of pore penetration, thereby decreasing nonspecific binding.
Aptamers represent another type of affinity protein tag, consisting of single-stranded oligonucleotides that bind to target molecules, such as small biomolecules and proteins, with affinities equal to those of antibodies. In contrast to other affinity tags, aptamers have many advantages, including small size, nontoxicity, relatively easy preparation and functionalization with no batch-to-batch variations and easy surface immobilization via their functional groups.9–11,17,18
Proteins captured via affinity tag-conjugated nanoparticles can generally be analyzed using 2-D gels, SDS-PAGE or mass spectrometry (MS) techniques.4 Besides the challenges described above for protein capturing probes, even detection of captured proteins is limited, to some extent, by the sensitivity of these analytical tools. In SDS-PAGE, the proteins can be stained with Coomassie Brilliant Blue or silver staining methods, with detection limits of 50 ng and 1 ng, respectively.19,20 On the other hand, MS can achieve detection limits in the femtomole range.21,22 Regardless of the analytical method, existing affinity enrichment techniques for capture of low-abundance proteins from complex biological fluids still need improvement.
Therefore, in this work, we demonstrate the use of surface-modified, aptamer-conjugated gold nanorods (AuNRs) for efficient capture and isolation of target proteins. As a model capturing platform, 15-mer thrombin aptamers are immobilized on the surface of gold nanorods. To increase the binding efficiency, thrombin aptamers are modified with different lengths of hexaethyloxy-glycol (EG6) linker prior to immobilization on the gold nanorod surface.
EXPERIMENTAL SECTION
Materials
Cetyltrimetylammonium bromide (CTAB) ≥ 96.0% was obtained from Fluka (52370), and sodium tetrachloroaurate (III) dihydrate (99%), sodium borohydride (98%), and tris(2-carboxyethyl)phosphine (TCEP) were obtained from Sigma-Aldrich. Ascorbic acid, glycine, Tris, and silver nitrate (99%) were obtained from Fisher Scientific. Thiol-terminated methoxypoly (ethylene glycol) (mPEG-SH, MW 5000) was purchased from Nanocs. Deoxyribonucleotides, spacer phosphoramidite 18, and 5′-thiol modifiers were purchased from Glen Research. The pH value of the solution containing glycine (0.5 M) was adjusted with 2.0 M NaOH to 8.0. 20X of NuPAGE MOPS SDS running buffer, 4X of NuPAGE LDS sample buffer, and 4–12% Bis-Tris SDS-polyacrylamide gel with 10 wells were purchased from Invitrogen. Deionized water (18.2 MΩ·cm) was used to prepare all of the aqueous solutions.
Preparation of AuNR seed solution
Five mL 0.2 M CTAB solution and 5 mL 0.5 mM NaAuCl4 solution were mixed in a 50 mL plastic tube, and then 0.6 mL 0.01 M freshly prepared NaBH4 was added. Following sonication for 3 min, the mixture turned brownish-yellow. This reaction mixture was protected from the light with aluminum foil and placed in a water bath at 25°C for 1 h.
Preparation of AuNR growth solution
Fifty mL 0.2 M CTAB solution and 50 mL 1 mM NaAuCl4 solution were mixed in a 100 mL glass bottle. Then 3.25 mL 0.004 M AgNO3 was added to this mixture, followed by 0.7 mL 0.0788M ascorbic acid. After addition of ascorbic acid, the color of the solution changed from dark yellow to colorless. Then 0.12 mL of the seed solution was added, and the overall mixture was protected from the light with aluminum foil. Finally, the reaction mixture was placed in a water bath at 25°C for 1 h. The solution changed to dark pink within 30 min.
Synthesis of AuNRs
Forty mL 0.5 M Glycine (adjusted pH 8.0) was prepared in a 200 mL glass bottle, and 60 mL DI water was added, followed by 100 mL of the growth solution. The reaction mixture was protected from light with aluminum foil and was placed in a water bath at 25°C for 12 h.
Removing excess CTAB from AuNRs
Aliquots (25 mL) of nanorod solution were added to centrifuge tubes and were centrifuged at 14000 rpm for 8 min. For each fraction, 22.5 mL of the supernatant was removed and replaced with 22.5 mL DI water. The solutions were again centrifuged at 14000 rpm at 25°C for 5 min. Then 22.5 mL of the supernatant was removed from each fraction and replaced with 22.5 mL 0.5 mM CTAB solution. The centrifugation step was repeated with the CTAB solution twice at the same speed and temperature for each fraction, and, finally, 2.5 mL of the solution was collected from each fraction.
Characterization of AuNRs
After removing excess CTAB, all fractions were combined to have approximately 10 times concentrated gold nanorod solution. Then this nanorod solution was diluted 1:20, and the UV/Vis spectrum was taken using a Cary Bio-300 (Varian, Walnut Creek, CA) to find its concentration. Two absorbance peaks were obtained at ca. 530 nm (transverse band) and ca. 860 nm (longitudinal band). TEM images of gold nanorods were obtained with a JEOL TEM 2010F transmission electron microscope on a copper grid. The sizes of gold nanorods were calculated with FemtoScan software as 77.3 ± 5.6 nm and 17.3 ± 1.1 nm in length and width, respectively.
Synthesis of thrombin aptamer
The 15-mer thrombin aptamer was selected as a model capture agent: (SH-2EG6-Apt-FAM): 5′ HS-C6-2(EG)6-GGT TGG TGT GGT TGG-FAM 3′; (SH-3EG6-Apt-FAM): 5′ HS-C6-3(EG)6-GGT TGG TGT GGT TGG-FAM 3′. All aptamers were coupled with 5′-thiol modifier for conjugation to the gold nanorod surface and were labeled with fluorescein at the 3′-end using 3′-(6-fluorescein) CPG to detect and quantify the aptamer modification on the gold nanorod surface. Also, either two or three hexaethyloxy-glycol units (EG6) were added between the thiol and thrombin aptamer sequence as spacers to observe the length effect on thrombin capture. All oligonucleotides were synthesized by solid-state phosphoramidite chemistry at a 1-μmol scale using an ABI3400 DNA/RNA synthesizer (Applied Biosystems, Foster City, CA). The completed sequences were then deprotected in AMA (ammonium hydroxide/40% aqueous methylamine 1:1) at 65 °C for 20 min and further purified using a ProStar HPLC (Varian, Walnut Creek, CA) with a C18 column (Econosil, 5 μm, 250×4.6 mm) from Alltech (Deerfield, IL). A Cary Bio-300 UV spectrometer (Varian, Walnut Creek, CA) was used to measure absorbance to quantify the concentrations of the product sequences.
Aptamer immobilization to the surface of AuNRs
Before aptamer immobilization, 0.1 mM 5′ S-S tagged thrombin aptamers were incubated with 5 mM TCEP in 50 mM Tris/HCl (pH=7.5) buffer for 1 hour at room temperature to reduce S-S to SH groups. 5′ SH-thrombin aptamers were then collected in small portions by eluting the TCEP mixture through a NAP-5 column. Concentrations of these portions were calculated by measuring their absorbance using a Cary Bio-300 UV spectrometer (Varian, Walnut Creek, CA). Then a 100 μL sample of 0.96 nM gold nanorod solution was centrifuged at 14000 rpm at 25°C for 3 min. The supernatant was removed, and the precipitate was resuspended in 100 μL 2 mM CTAB. Then 850 μL of DNA grade water, 50 μL 2mM thiol-PEG (MW 5000) and 0.25 μL 100 μM (25 nM as final concentration) thrombin aptamer were added to the gold nanorod solution. The solution was incubated for 12 hours at room temperature. Then the reaction solution was centrifuged at 14000 rpm at 25°C for 5 minutes to remove the unbound aptamers and SH-PEG as a supernatant. The precipitate was resuspended in 100 μL of DI or DNA grade water. Gold nanorods conjugated with thiol-PEG-only (MW 5000) were prepared in the same manner.
Thrombin capture with aptamer-conjugated AuNRs
Three samples, including 20, 50 and 100 μL of 0.96 nM gold nanorod-thrombin aptamer (2EG6-or 3EG6-modified), and 50 μL 0.96 nM of only SH-PEG-modified gold nanorod were centrifuged at 14000 rpm for 5 minutes, and the supernatants were removed. Then 100 μL of thrombin activation buffer and human plasma samples containing 338 ng, 100 ng or 1ng human α-thrombin were prepared separately for each precipitated gold nanorod solution. The activation buffer solutions also contained 10mg/mL BSA (3000 times more concentrated than α-thrombin in the 338 ng α-thrombin-spiked buffer solutions) to mimic multiplex biological fluids. Thrombin-spiked activation buffer (20 mM Tris- HCl pH=7.4, 140 mM NaCl, 5mM KCl, 1mM CaCl2, 1mM MgCl2) and plasma samples were added to the precipitates of gold nanorod solutions separately, and the mixtures were vortexed, or briefly sonicated, to mix the contents. The mixtures were incubated for 20 minutes at room temperature and were then centrifuged at 14000 rpm for 3 min. The precipitates were washed three times with 200 μL of washing buffer and centrifuged at 14000 rpm for 3 min after each buffer addition; the precipitates were then dispersed in 10 μL of DI water.
One-dimensional Gel Electrophoresis and Gel Staining
A volume of 10 μL of the prepared α-thrombin protein standards and the gold nanorod solutions with α-thrombin captured from human plasma or buffer were mixed with 10 μL gel loading buffer (NuPAGE LDS sample buffer; Invitrogen). The mixtures and 2 μL of the prestained protein marker solution were heated at 95°C for 5 minutes and loaded into the gel (4–12% Bis-Tris SDS-polyacrylamide (Invitrogen)) with a thickness of 1.0 mm. Gel separation in running buffer proceeded at a constant voltage of 200V for 1 hour. After separation, the gels that were loaded with 338 ng or 100 ng thrombin samples were washed with DI water three times at 10 minute increments, and the gels were stained with Coomassie Blue dye (GelCode Blue Stain Reagent, Thermo Scientific) for 1 hour. The gels that were loaded with 1 ng thrombin samples were stained by the silver staining method using a SilverQuest Staining Kit (Invitrogen). Then the stained gels were scanned with a scanner, and the bands in the gels were analyzed by ImageJ software. To determine the thrombin capture efficiency, the peak areas of the protein standard bands were considered to represent 100% yield.
RESULTS AND DISCUSSION
In order to synthesize gold nanorods, a seed-mediated method was used.23–26 The synthesized gold nanorods were characterized by their UV-VIS absorption and by their TEM images, as shown in Figure 1. The prepared gold nanorods showed good uniformity, as indicated by their TEM image. The characteristic transverse and longitudinal bands23 were observed at 530 nm and 860 nm, respectively, in the UV-VIS absorption spectrum (Figure 1).
Figure 1.
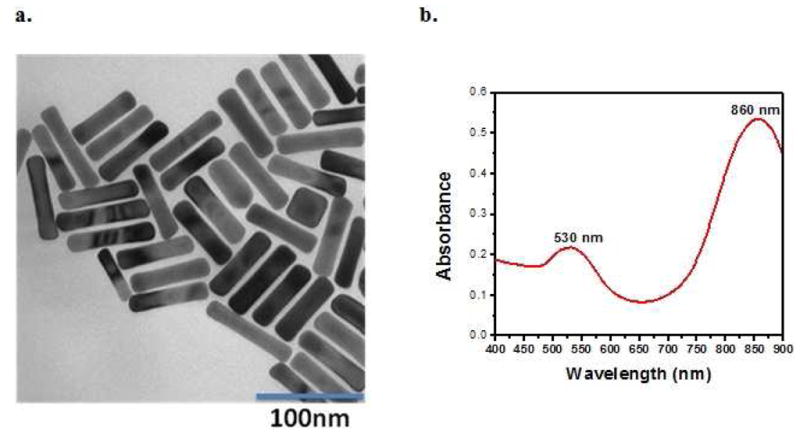
(a) TEM image of the gold nanorods with the dimensions 77.3 ± 5.6 nm and 17.3 ± 1.1 nm; (b) Absorption spectrum of gold nanorods with two absorption maxima at 530 and 860 nm.
Surface modification of gold nanorods utilizing thiolate reaction consisted of PEGylation of the surface using SH-PEG (MW 5000) and immobilization of thiol-labeled 15-mer thrombin aptamers that were previously modified with different hexaethyloxy-glycol (EG6) lengths (Figure 2). Gold nanorods were functionalized with thiol-PEG (MW 5000) to avoid agglomeration and decrease nonspecific binding.5,27–31
Figure 2.

(A) Surface modification design of gold nanorods; (B) Scheme of the α-thrombin capturing protocol: 1, 2, 3 represent 0.19, 0.48 and 0.96 nM gold nanorods conjugated with 3EG6- or 2EG6-modified thrombin aptamers, respectively.
The immobilization of thiol-PEG was optimized by monitoring the fluorescence intensities of the FAM-labeled aptamer-conjugated gold nanorods and the unbound aptamers for different concentrations of SH-PEG. As shown in Figure 3, the highest fluorescence intensity of aptamer- conjugated gold nanorods and the least fluorescence intensity of the unbound aptamers were obtained when 100 μM SH-PEG was used, and that concentration was subsequently used for AuNRs with either 2 or 3 EG6 units. This amount of SH-PEG also led to well-dispersed AuNR solutions (Figure S-1). The average number of aptamers bound on the surface per nanorod was found by dividing the concentration of aptamers bound on the surface by the concentration of the gold nanorods used in conjugation. In order to find the concentration of the bound aptamers, the concentration of the unbound aptamers was subtracted from the overall aptamer concentration that was used in the modification. The concentrations of the aptamers were evaluated using a fluorescence standard calibration curve for standard solutions of the thrombin aptamer.32,33 According to these calculations, approximately 162 and 157 of 2EG6- and 3EG6- modified 15- mer thrombin aptamers were immobilized on each gold nanorod surface, respectively, while using 100 μM SH-PEG (MW 5000) (Figures S-2 and S-3). Since the aptamer immobilization did not differ significantly for either of these modifications, the thrombin capture efficiency can be compared with the change in the linker length.
Figure 3.

The fluorescence intensities of (A) 2EG6-modified aptamers, (B) 3EG6-modified aptamers, (upper figures) aptamer-conjugated AuNRs, (lower figures) unbound aptamers, while varying the concentrations of SH-PEG (MW 5000) in the surface modification of AuNRs.
The aptamer accessibility towards its target can be increased by using linkers, such as Thymidine34 and PEG35. In previous reports, arbitrarily chosen lengths of these linkers were used.31,34 Balamurugan et al. showed that there are two factors affecting the target capture efficiency, surface density and the distance from the immobilization surface of the aptamers. In their study, thymidine linkers in 4 different increments (T0, T5, T10, T20) decreased the surface density of thrombin aptamers immobilized on gold slides, resulting in decreased target capturing efficiency in T5→T10 and T10→T20 increment change, however in the T0 → T5 modification, the distance effect suppressed the surface density decrease, which increased the accessibility of aptamers towards their target.31 In this study, 15-mer thrombin binding aptamers were modified with either 2 or 3 units of hexaethyloxy-glycol to determine which length resulted in more efficient thrombin capture. Instead of a thymidine, hexaethyloxy-glycol was chosen as a linker because it does not affect the surface density of the aptamers.31 On the other hand, one unit of hexaethyloxy-glycol is approximately as long as a T5 linker.
Gold surfaces have a high tendency to quench fluorescence of nearby fluorophores.36,37 Consequently, before starting the thrombin capturing efficiency comparison experiments, it was necessary to estimate the distance between aptamer and AuNR surface. Therefore, the fluorescence quenching percentages of 3EG6- and 2EG6- modified thrombin aptamers having FAM dye on their 3′ ends were compared. The fluorescence quenching percentage of 3EG6- modified aptamers was found to be 10% less than that for aptamers with 2EG6 units, indicating that the 3EG6- modified aptamers were farther away from the AuNR surface (Figure S-4).
Thrombin capturing efficiency comparison experiments were then conducted by an SDS- PAGE technique. Different concentrations (0.19, 0.48 and 0.96 nM) of gold nanorods conjugated with 3EG6- or 2EG6- modified thrombin aptamers were incubated with 338 ng, 100 ng or 1ng human α-thrombin-spiked buffer or human plasma samples. The enriched α-thrombin on these gold nanorods and a standard human α-thrombin sample were loaded in a 4–12% Bis-Tris SDS-polyacrylamide gel for electrophoresis. Also, gold nanorods that were conjugated only to thiol-PEG (MW 5000) were incubated with the samples containing human α-thrombin protein to determine any contribution from nonspecific enrichment.
As shown in Figure 4, an increase in concentration of the AuNRs conjugated with 2EG6-modified thrombin aptamers from 0.19 nM to 0.96 nM resulted in an increase in thrombin capturing efficiency from 48% to 84% for the buffer sample containing 338 ng (~84 nM, 3.38 ppm) of human α-thrombin (Figure 4A, lanes 2–4). However, when the concentration of the AuNRs conjugated with 3EG6-modified thrombin aptamers increased from 0.19 nM to 0.96 nM, the thrombin capturing efficiency decreased from 90% to 28% for the same thrombin standard (Figure 4A, lane 5–7). Therefore, the most efficient capturing occurred with the 0.19 nM 3EG6- modified aptamer-conjugated AuNRs. A similar thrombin capturing trend occurred for the buffer sample containing 100 ng (~25nM, 1.00 ppm) of α–thrombin. In Figure 4B, the thrombin capture efficiency difference between the 0.19 nM 3EG6- and 2EG6-modified thrombin aptamer- conjugated AuNRs is even more evident (lane 5 and lane 4, respectively). Thus, even a one unit change of hexaethyloxy-glycol increased the thrombin capturing efficiency by 47%.
Figure 4.

Upper figures: Gel electrophoresis of enriched α-thrombin (A) from 338 ng of α-thrombin-spiked activation buffer: lane 1, α-thrombin standard; lanes 2, 3, 4, α-thrombin captured, respectively, via 0.19, 0.48 and 0.96 nM aptamer-2EG6-AuNRs; lanes 5, 6, 7, α-thrombin captured, respectively, via 0.19, 0.48 and 0.96 nM aptamer-3EG6-AuNRs; lane 8, α-thrombin captured via 0.48 nM of PEGylated-only gold nanorods and (B) from 100 ng of α-thrombin-spiked activation buffer: lane 1, α-thrombin standard; lanes 2, 3, 4, α-thrombin captured, respectively, via 0.96, 0.48 and 0.19 nM aptamer-2EG6-AuNRs; lanes 5, 6, 7, α-thrombin captured, respectively, via 0.19, 0.48 and 0.96 nM aptamer-3EG6-AuNRs; lane 8, α-thrombin captured via 0.48 nM of PEGylated-only gold nanorods. Figures on the right: Pixel intensity peaks of each band drawn by ImageJ software. Lower Figures: Relative band intensities calculated by ImageJ software for the captured α-thrombin compared to α-thrombin standards to demonstrate the thrombin capture percentage.
As it was reported by Balamurugan et al.31, the thrombin binding capacity was controlled by two different factors, surface density and the distance from the immobilization surface of the aptamers. In this paper, since the numbers of 2EG6- and 3EG6-modified thrombin aptamers immobilized on each gold nanorod surface were close to each other, the distance of aptamers from gold surface became the major effect on thrombin capture efficiency. For AuNRs conjugated with 2EG6- modified thrombin aptamers, which had shorter linkers, the thrombin capture efficiency was greatly affected by the steric effect. Thus, larger concentrations of AuNRs were needed to increase the chance that α-thrombin would come close to the aptamers immobilized on the gold surface. That is the reason for the increase in the thrombin capture efficiency with the increase of the concentration of AuNRs conjugated with 2EG6-modified thrombin aptamers. However, AuNRs conjugated with 3EG6-modified thrombin aptamers, which had longer linkers, showed slight steric effects on thrombin binding to aptamer. Thus, even low concentrations of AuNRs (0.19 nM) conjugated with 3EG6-modified thrombin aptamers could reach up to 90% of thrombin capture efficiency. On the other hand, with the increase of the concentration of AuNRs, the 3EG6-modified thrombin aptamers on the adjacent AuNRs may have twisted around each other due to their flexibility and longer distance from the gold surface. Therefore the effective number of aptamers that can bind to thrombin was reduced. This may be the reasonwhy thrombin capture efficiency was decreased with the concentration increase of AuNRs conjugated with 3EG6-modified thrombin aptamers.
In both Figures 4A and 4B, lane 8 shows the nonspecifically captured α-thrombin from buffer solutions via gold nanorods conjugated only with thiol-PEG (MW 5000).5 Since the band intensities for this nonspecifically captured α-thrombin were so low, it can be concluded that the nonspecific capture of α-thrombin in the absence of the affinity tag conjugation was negligible.
These buffer solutions contained α-thrombin, as well as high concentrations of BSA (10mg/mL), to mimic complex biological fluids. As shown in Figure S-5, thrombin aptamer-conjugated gold nanorods showed some nonspecific binding to BSA (66 kDa), but the band intensities were very low compared to the bands for captured α-thrombin (37kDa), indicating that the nonspecific binding was negligible. The gel in Figure S-5 also shows that the thrombin capture efficiency increased with an increase in the concentration of 2EG6-modified aptamer-conjugated AuNRs, but it decreased with an increase in the concentration of 3EG6-modified aptamer-conjugated AuNRs. Moreover, 0.96 nM aptamer-2EG6-AuNRs and 0.19 nM aptamer- 3EG6-AuNRs again showed similar band intensities for captured α-thrombin, which is an indication of the efficacy of aptamer-3EG6-AuNRs, despite their low concentration.
Thrombin capturing efficiency comparison experiments were also conducted with 1 ng (~250 pM, 10 ppb) human α-thrombin-spiked buffer and human plasma samples. This concentration was chosen since 1ng is close to the detection limit of the silver staining method for proteins after gel electrophoresis.19,20 Significant differences in thrombin capture efficiency for different probes from 1 ng α-thrombin-spiked buffer solutions were not observed, as shown in Figure S-6.
Similarly, the α-thrombin capture efficiency trend observed with thrombin aptamer activation buffer solutions was not observed with the 1ng α-thrombin-spiked human plasma sample (Figure 5). The band intensities of the captured α-thrombin (red dashed lines, Figure 5) via different concentrations of 2EG6- or 3EG6-modified thrombin aptamer-conjugated AuNRs did not differ significantly from each other (except in lane 7, which could have resulted from a staining error), and they even showed slightly higher intensities than thrombin standard (lane 1) by the presence of some α-thrombin in the original plasma sample. Even though one hexaethyloxy-glycol unit change of the spacer in the surface modification of gold nanorods did not affect the thrombin capturing efficiency significantly in plasma samples, 1 ng (10 ppb) of α-thrombin was successfully enriched from human plasma with the aptamer-conjugated gold nanorods. An unexpected band could also be seen in the gel electrophoresis of the α-thrombin standard (blue dashed lines, lane 1, Figure 5). In order to identify this band, MALDI-MS spectrum of the α-thrombin standard was taken. Besides the expected mass-to-charge ratio peak at around 36000 m/z, another peak was obtained at around 72000 m/z (Figure S-7). This was most likely caused by the prothrombin content of the α-thrombin standard solution, since α-thrombin (~37kDa) is generated by proteolysis of two peptide bonds in prothrombin (~72kDa) via prothrombinase enzyme.38,39 The same band (~72 kDa) occurred for the lanes of the captured α-thrombin in Figure 5. This result indicates that 15-mer thrombin aptamer can also bind to prothrombin. This correlates with some previous studies, which found that a 15-mer thrombin aptamer can block the clotting activity of thrombin either by binding to exosite I or prothrombin to inhibit its activation by prothrombinase enzyme, which also leads to the inhibition of thrombin generation.40 The band intensity for prothrombin in the standard (lane 1, Figure 5) did not substantially differ from band intensities recorded for captured prothrombin via aptamer-conjugated gold nanorods modified with different linker lengths (lanes 2–6). Thus, it may be concluded that effective capturing was achieved at ppb levels for prothrombin using 15-mer thrombin aptamer-conjugated gold nanorods.
Figure 5.

Left Figure: Gel electrophoresis of enriched α-thrombin from 1 ng α-thrombin-spiked human plasma: lane 1, α-thrombin standard; lanes 2, 3, 4, α-thrombin captured, respectively, via 0.19, 0.48 and 0.96 nM aptamer-2EG6-AuNRs; lanes 5, 6, 7, α-thrombin captured, respectively, via 0.19, 0.48 and 0.96 nM aptamer-3EG6-AuNRs. Right Figure: Pixel intensity peaks of each lane drawn by ImageJ software; blue dashed lines show the upper bands (72 kDa), and red dashed lines show the lower bands (37kDa).
CONCLUSION
The overall results in this study demonstrate the applicability of the surface-modified, aptamer-conjugated gold nanorods for the enrichment of low-abundance proteins (in ppb range) from plasma samples and the vital role of surface modification to generate robust, sensitive, specific and efficient protein capturing platforms. This new method can enrich proteins at ppb levels using very low amounts of the capturing platform (0.19 nM gold nanorods) and with negligible nonspecificity. The dramatic increase in thrombin capturing efficiency with only one unit change of hexaethyloxy-glycol linker proves the significance of surface modification in protein enrichment techniques. This study also outscores similar, but more complex, methods only capable of enrichment down to 6 ng of captured thrombin.41 In addition to the detection of proteins using gel electrophoresis, this work can also open new avenues for aptamer-conjugated gold nanorods for use as an LDI – MS matrix42 where NIR lasers are used. In this way, aptamer-conjugated gold nanorods can be used as a dual platform for enrichment and detection of rare proteins utilizing MS, as shown in our previous work with aptamer-conjugated graphene oxide.43 It may be concluded that aptamer-conjugated gold nanorods are promising protein capturing platform candidates for biomarker discovery studies involving capture and detection of low-abundance proteins from biological fluids.
Supplementary Material
Acknowledgments
This work is also supported by grants awarded by the National Institutes of Health (GM066137, GM079359 and CA133086).
Footnotes
“Supporting Information Available: This material is available free of charge via the Internet at http://pubs.acs.org.”
References
- 1.Anderson NL, Anderson NG. Mol Cell Proteomics. 2002;1:845–867. doi: 10.1074/mcp.r200007-mcp200. [DOI] [PubMed] [Google Scholar]
- 2.Darmanis S, Nong RY, Hammond M, Gu J, Alderborn A, Vanelid J, Siegbahn A, Gustafsdottir S, Ericsson O, Landegren U, Kamali-Moghaddam M. Mol Cell Proteomics. 2010;9:327–335. doi: 10.1074/mcp.M900248-MCP200. [DOI] [PMC free article] [PubMed] [Google Scholar]
- 3.Kirk JS, Bohn PW. J Am Chem Soc. 2004;126:5920–5926. doi: 10.1021/ja030573m. [DOI] [PubMed] [Google Scholar]
- 4.Wang A, Wu CJ, Chen SH. J Proteome Res. 2006;5:1488–1492. doi: 10.1021/pr0504844. [DOI] [PubMed] [Google Scholar]
- 5.Cheng PC, Chang HK, Chen SH. Mol Cell Proteomics. 2010;9:209–224. doi: 10.1074/mcp.M900183-MCP200. [DOI] [PMC free article] [PubMed] [Google Scholar]
- 6.Schulze WX, Mann M. J Biol Chem. 2004;279:10756–10764. doi: 10.1074/jbc.M309909200. [DOI] [PubMed] [Google Scholar]
- 7.Phizicky EM, Fields S. Microbiol Rev. 1995;59:94–123. doi: 10.1128/mr.59.1.94-123.1995. [DOI] [PMC free article] [PubMed] [Google Scholar]
- 8.Alber F, Dokudovskaya S, Veenhoff LM, Zhang W, Kipper J, Devos D, Suprapto A, Karni-Schmidt O, Williams R, Chait BT, Sali A, Rout MP. Nature. 2007;450:695–701. doi: 10.1038/nature06405. [DOI] [PubMed] [Google Scholar]
- 9.Sefah K, Phillips JA, Xiong X, Meng L, Van Simaeys D, Chen H, Martin J, Tan W. Analyst. 2009;134:1765–1775. doi: 10.1039/b905609m. [DOI] [PubMed] [Google Scholar]
- 10.Meir A, Marks RS, Stojanovic MN. Aptameric Biosensors. In: Cullen DC, Karube I, Lowe CR, Weetal HH, editors. Handbook of Biosensors and Biochips. John Wiley & Sons, Ltd; 2008. [Google Scholar]
- 11.Shangguan D, Tang Z, Mallikaratchy P, Xiao Z, Tan W. ChemBioChem. 2007;8:603–606. doi: 10.1002/cbic.200600532. [DOI] [PubMed] [Google Scholar]
- 12.Tong S, Hou S, Ren B, Zheng Z, Bao G. Nano Lett. 2011;11:3720–3726. doi: 10.1021/nl201978c. [DOI] [PMC free article] [PubMed] [Google Scholar]
- 13.Elghanian R, Storhoff JJ, Mucic RC, Letsinger RL, Mirkin CA. Science. 1997;277:1078–1081. doi: 10.1126/science.277.5329.1078. [DOI] [PubMed] [Google Scholar]
- 14.Storhoff JJ, Elghanian R, Mucic RC, Mirkin CA, Letsinger RL. J Am Chem Soc. 1998;120:1959–1964. [Google Scholar]
- 15.Storhoff JJ, Lazarides AA, Mucic RC, Mirkin CA, Letsinger RL, Schatz GC. J Am Chem Soc. 2000;122:4640–4650. [Google Scholar]
- 16.Teng CH, Ho KC, Lin YS, Chen YC. Anal Chem. 2004;76:4337–4342. doi: 10.1021/ac049963x. [DOI] [PubMed] [Google Scholar]
- 17.Mallikaratchy P, Tang Z, Kwame S, Meng L, Shangguan D, Tan W. Mol Cell Proteomics. 2007;6:2230–2238. doi: 10.1074/mcp.M700026-MCP200. [DOI] [PubMed] [Google Scholar]
- 18.Shangguan D, Cao Z, Meng L, Mallikaratchy P, Sefah K, Wang H, Li Y, Tan W. J Proteome Res. 2008;7:2133–2139. doi: 10.1021/pr700894d. [DOI] [PMC free article] [PubMed] [Google Scholar]
- 19.Williams L. Biotech Histochem. 2001;76:127–132. [PubMed] [Google Scholar]
- 20.Roegener J, Lutter P, Reinhardt R, Blüggel M, Meyer HE, Anselmetti D. Anal Chem. 2003;75:157–159. doi: 10.1021/ac020517o. [DOI] [PubMed] [Google Scholar]
- 21.Aebersold R, Goodlett DR. Chem Rev. 2001;101:269–295. doi: 10.1021/cr990076h. [DOI] [PubMed] [Google Scholar]
- 22.Aebersold R, Mann M. Nature. 2003;422:198–207. doi: 10.1038/nature01511. [DOI] [PubMed] [Google Scholar]
- 23.Nikoobakht B, El-Sayed MA. Chem Mater. 2003;15:1957–1962. [Google Scholar]
- 24.Johnson CJ, Dujardin E, Davis SA, Murphy CJ, Mann S. J Mater Chem. 2002;12:1765–1770. [Google Scholar]
- 25.Gole A, Murphy CJ. Chem Mater. 2004;16:3633–3640. [Google Scholar]
- 26.Gao J, Bender CM, Murphy CJ. Langmuir. 2003;19:9065–9070. [Google Scholar]
- 27.Karakoti AS, Das S, Thevuthasan S, Seal S. Angew Chem, Int Ed Engl. 2011;50:1980–1994. doi: 10.1002/anie.201002969. [DOI] [PubMed] [Google Scholar]
- 28.Liu Z, Robinson JT, Sun X, Dai H. J Am Chem Soc. 2008;130:10876–10877. doi: 10.1021/ja803688x. [DOI] [PMC free article] [PubMed] [Google Scholar]
- 29.Jokerst JV, Lobovkina T, Zare RN, Gambhir SS. Nanomedicine (Lond) 2011;6:715–728. doi: 10.2217/nnm.11.19. [DOI] [PMC free article] [PubMed] [Google Scholar]
- 30.Suh J, Choy KL, Lai SK, Suk JS, Tang BC, Prabhu S, Hanes J. Int J Nanomed. 2007;2:735–741. [PMC free article] [PubMed] [Google Scholar]
- 31.Balamurugan S, Obubuafo A, McCarley RL, Soper SA, Spivak DA. Anal Chem. 2008;80:9630–9634. doi: 10.1021/ac8009559. [DOI] [PMC free article] [PubMed] [Google Scholar]
- 32.Huang YF, Sefah K, Bamrungsap S, Chang HT, Tan W. Langmuir. 2008;24:11860–11865. doi: 10.1021/la801969c. [DOI] [PubMed] [Google Scholar]
- 33.Huang YF, Chang HT, Tan W. Anal Chem. 2008;80:567–572. doi: 10.1021/ac702322j. [DOI] [PubMed] [Google Scholar]
- 34.Balamurugan S, Obubuafo A, Soper SA, Spivak DA. Anal Bioanal Chem. 2008;390:1009–1021. doi: 10.1007/s00216-007-1587-2. [DOI] [PubMed] [Google Scholar]
- 35.Balamurugan S, Obubuafo A, Soper SA, McCarley RL, Spivak DA. Langmuir. 2006;22:6446–6453. doi: 10.1021/la060222w. [DOI] [PubMed] [Google Scholar]
- 36.Lakowicz JR. Anal Biochem. 2004;324:153–169. doi: 10.1016/j.ab.2003.09.039. [DOI] [PMC free article] [PubMed] [Google Scholar]
- 37.Swierczewska M, Lee S, Chen X. Phys Chem Chem Phys. 2011;13:9929–9941. doi: 10.1039/c0cp02967j. [DOI] [PMC free article] [PubMed] [Google Scholar]
- 38.Lundblad RL, Kingdon HS, Mann KG. [14] Thrombin. In: Laszlo L, editor. Methods in Enzymology. Vol. 45. Academic Press; 1976. pp. 156–176. [DOI] [PubMed] [Google Scholar]
- 39.Michael E, Nesheim KGM. J Biol Chem. 1983;258:5386–5391. [PubMed] [Google Scholar]
- 40.Kretz CA, Cuddy KK, Stafford AR, Fredenburgh JC, Roberts R, Weitz JI. Thromb Haemostasis. 2010;103:83–93. doi: 10.1160/TH09-04-0237. [DOI] [PubMed] [Google Scholar]
- 41.Li F, Li J, Wang C, Zhang J, Li XF, Le XC. Anal Chem. 2011;83:6464–6467. doi: 10.1021/ac201801k. [DOI] [PubMed] [Google Scholar]
- 42.Castellana ET, Gamez RC, Gomez ME, Russell DH. Langmuir. 2010;26:6066–6070. doi: 10.1021/la904467b. [DOI] [PubMed] [Google Scholar]
- 43.Gulbakan B, Yasun E, Shukoor MI, Zhu Z, You M, Tan X, Sanchez H, Powell DH, Dai H, Tan W. J Am Chem Soc. 2010;132:17408–17410. doi: 10.1021/ja109042w. [DOI] [PMC free article] [PubMed] [Google Scholar]
Associated Data
This section collects any data citations, data availability statements, or supplementary materials included in this article.