

Abstract
The integration of physicochemical profiling screens such as Log P into natural products drug discovery programs is emerging as an approach to front-load drug-like properties of natural product libraries for high-throughput screening. In this study a fast-gradient HPLC method using a polystyrene-divinylbenzene PRP-1 column was developed to estimate the lipophilicity of marine natural products. An excellent correlation was found between the results of the experimental determined and the literature log P values for a diverse set of commercially available drugs using the PRP-1 column. The log P of a series of 24 marine natural products were evaluated using the new method and a good correlation was observed between the experimentally determined and software calculated log P values. Some discrepancies were observed between the measured value of log P and the software calculations of the natural products containing halogens atoms. The method is rapid, insensitive to impurities, and requires very little compound and is amenable for integration into a natural products drug discovery research program.
Keywords: Lipophilicity, Natural Products, Drug discovery, Polystyrene-divinylbenzene, Reversed-phase HPLC
INTRODUCTION
Lipophilicity, expressed as the logarithmic value of the octanol/water partition coefficient (log Poct), is a fundamental parameter that models the biological partition behavior of drug molecules.[1] For example, drug absorption and log Poct are directly related because of passive diffusion across the cell membrane. We can estimate absorption, even permeability and distribution of drug candidates in body by log Poct. If the Log P value is below 0 or above 5, drug candidates usually have intestinal and central nervous system (CNS) permeability problems or low solubility and poor oral bioavailability. Actually, the log Poct corresponding to the 90th percentile of drug candidates that reached phase II clinical trails is between 0 and 5. [2] Therefore consideration of Log Poct in the process of drug development can prioritize leads from high-throughput screening and reduce the failure rate of drug candidates during development.[3, 4]
Reversed-phase liquid chromatography (RP-HPLC) has been widely used to estimate Log Poct.[4, 5, 6] All of these methods achieve satisfactory correlations with Log Poct, even for very hydrophobic compounds (Log Poct > 6). Valkó et al. proposed a rapid method for measurement of Log P via reversed-phase HPLC and established a general solvention equation for Log P values and Chromatographic Hydrophobicity Indices with acetonitrile (CHIACN).[7, 8, 9] The main advantage of an HPLC-based lipophilicity measurement is that the partition coefficients can be obtained from time measurements instead of concentration determination. The result of this is that retention time (tR) is independent of the compound concentration/amount injected into the chromatographic system. Consequently, impurities do not affect the measurements, and the low solubility of some compounds does not affect the measurements. Another important feature of this method is that very little compound is required and the Log P of a mixture of several compounds can be obtained from a single injection. These characteristics make HPLC a practical method to determine drug lipophilicity in the early stages of drug discovery. HPLC-based methods suffer some disadvantages such as short linear range of Log Poct and retention time, and the lipophilicity assessment of charged compounds such as basic drugs are unreliable. The discrepancies of log P measurements of charged compounds have been attributed to silanophilic interactions with free silanol groups on silica based C18 columns, which results in increases in retention times.[10]
The integration of physicochemical profiling screens such as Log P into natural products drug discovery programs is emerging as an approach to front-load lead-like properties of natural product libraries for high-throughput screening.[11] We have been utilizing polystyrene-divinylbenzene (PS-DVB) chromatographic stationary phases (Diaion HP-20 and PRP-1) for the initial fractionation of crude extracts and the isolation and purification of marine natural products.[12] Unlike silica based stationary phases such as C8 or C18, the polymer-based chromatographic resins have no stationary phase coating, is a rigid, macroporous, cross-linked polymer that lacks any polar sites and so does not suffer from irreversible binding of polar solutes. In addition polymeric resins are also chemically inert in most organic solvents, can be used at a wide range of pH values (pH 1-13), and has been found to afford improved separation of basic compounds.[13] These characteristics make PS-DVB based separation media a versatile stationary phase for the separation of a broad range of compound classes in a wide range of applications.[14] Although polymeric stationary phases such as octadecyl-poly(vinyl alcohol) (ODP), and PS-DVB based stationary phases (ACT-1, PRP-1, and PLRP-S) have been used to estimate lipophilicity (Log P) using isocratic HPLC methods with varied success, there is no rapid gradient method available to estimate lipophilicity (Log Poct) of compounds using a PRP-1 column.[10, 15, 16]
In this study we have developed a fast-gradient HPLC method using a polystyrene-divinylbenzene PRP-1 column to estimate the lipophilicity of natural products. We believe that the evaluation of log P in natural products chemistry will be useful to optimize the generation of drug-like natural product screening libraries, to prioritize leads and improve the success rate of natural products at the later stages of the drug discovery process.
EXPERIMENTAL
Materials
All solvents were HPLC grade and were supplied by Sigma-Aldrich. Water used throughout the study was purified with a Milli-Q water purification system from Millipore (Millipore, Bedford, MA, USA). All reference compounds were obtained from Sigma (St. Louis, MO, USA) and Aldrich (Milwaukee, WI, USA) with high purity (>98%). The marine natural products were isolated from marine organisms collected from the coast of Florida and the Bahamas.
Instrumentation
A Shimadzu (Kyoto, Japan) quaternary low pressure gradient system was used for the HPLC measurements. The solvents were degassed using a DGU-20AT degassing unit and mixed in an FCV-20AL mixer. An LC-20AT pump equipped with a Shimadzu SCL-20AT System controller, permitting automated operation, was used to deliver the mobile phase to the analytical column. Sample injection was performed using a Rheodyne 7725i injection valve (Rheodyne, Cotati California, U.S.A) equipped with a 20 μL sample loop. Detection was achieved using an UV-SPD-M20A diode array detector and a Shimadzu ELSD-LTII detector. Data acquisition was performed using EZStart chromatography software package version 7.4.
Chromatographic Conditions
Samples were prepared by dissolving 0.1 mg/mL of the solute in 50% (v/v) acetonitrile and 50 % (v/v) 50 mM ammonium acetate buffer. An aliquot of the solution (20 μL) was injected onto the HPLC system. The stationary phase consisted of a Hamilton PRP-1 column (5 μm, 150 mm × 4.6 mm). The flow rate was 1 mL/min. The mobile phase was filtered through a 0.5 μm Fluoropore membrane filter (Millipore, USA) membrane before use. Retention times tr were measured at least from three separate injections, dead time t0 was the retention time of sodium nitrate. For the isocratic mode, the mobile phase consisted of different mixtures of acetonitrile and 25 mM AcONH4 adjusted at pH 4.5, 7.2, 9.8 in the range 0 – 100%. For the fast gradient mode, the following gradient program was applied: 0 – 1.5 min, 0% acetonitrile; 1.5 – 16.5 min, 0 –100% acetonitrile; 16.5 – 18.5 min, 100% acetonitrile; 18.5 – 23.0 min, 100 – 0% acetonitrile; 23.0 – 25.0 min, 0% acetonitrile. The dead time (t0) was measured by injecting sodium nitrate together with the sample.
Measurement of the hydrophobicity index (φ0) of the reference compounds in isocratic mode
Theophylline, 5-phenyl-1H-tetrazole, benzimidazole, colchicine, 8-phenyltheophylline, indole, acetophenone, propiophenone, butyrophenone, and valerophenone were used as reference compounds that covers the log Poct range from -0.02 – 3.26. These compounds are not ionized at pH 7.4, so their distribution coefficient is equivalent to their log Poct values. The standard solutions were injected onto the system and their retention times were recorded. The standard mixture contains reference compounds at a concentration of approximately 0.1 mg/mL in acetonitrile:buffer, (50:50) (v/v). The retention times of some of the components varied with pH. This is because some of the components are charged at low or high pH. The retention time of the acetophenone, propiophenone, butyrophenone and the valerophenone should be constant, respectively at all pH values. We used longest tR under mobile phase at pH 4.5, 7.2, 9.8 to measure hydrophobicity index (φ0).
For each reference compound, the average retention time (tR) of three consecutive injections of 20 μL of sample was used to calculate the log k’ values (log k’ = log[(tR - t0)/t0]).
At least 5 mobile phases with different organic-phase concentrations were applied for each reference compounds. Then the log k’ values were plotted against the applied acetonitrile concentration. The slope (S) and the intercept (log k’w) value were calculated based on log k’ values obtained by a minimum of five organic-phase concentrations. The correlation coefficients of the linear fit were always higher than 0.99. The isocratic chromatographic hydrophobicity index (φ0) was calculated as log k’w/S.
Setup CHI-tR standard curve in gradient mode with reference compounds
Reference compounds were dissolved in an acetonitrile/buffer mixture described above. With gradient chromatography, the retention times (tR) were measured with mobile phases with three different pH values described above. We used the longest retention times (tR) of each compound to calculate CHI. A standard curve was created by plotting the highest tR of each reference compound against its isocratic hydrophobicity index, φ0, obtained above. An equation relating tR to φ0 is also generated from the standard curve. The slope and the intercept of the standard curve were used to convert the gradient retention times of each reference compound to CHI values, φ0 (predicted value).
Log Poct calculation
According to the equation:[9]
| (1) |
Where HBC is hydrogen bond count. The log P was calculated.
Validation of the Method
The fast-gradient HPLC method using the PRP-1 column was validated using a set of 21 commercially available drugs with diverse structures. Using the gradient chromatographic run described above, we used the standard curve to convert tR measured to CHI value, then we used equation 4 to calculate log Poct. We also obtain the literature log Poct value of the 21 compounds from Drug Bank (http://www.drugbank.ca/). The comparison and correlation analysis between calculated and literature Log Poct were performed.
Estimating the lipophilicity of Marine Natural Products
The log P of 24 marine natural products were assessed by the fast-gradient HPLC method using the PRP-1 column. Evaporative Light scattering detection (ELSD) was used to detect compounds that did not contain a strong UV chromophore. We also used software ChemBioDraw Ultra (CambridgeSoft Corporation) to calculate Log Poct.
RESULTS AND DISCUSSION
According to the HPLC theory, the phase preference of a single solute can be expressed by the capacity factor k (k = (tr −t0)/t0). The sample k values are also related to the volume fraction, φ, of the organic solvent in the mobile phase as:
| (2) |
The intercept log kw corresponds to the retention in pure water as a mobile phase and represents the commonly employed chromatographic hydrophobicity parameter. S is a solute dependent solvent strength parameter specific to the organic modifier on the stationary phase under consideration. Another retention-related parameter has been introduced recently, the chromatographic hydrophobicity index (CHI), φ0.8, 17 The φ0 value represents the volume fraction of the organic solvent in the mobile phase for which the amount of solute in the mobile phase is equal to that in the stationary phase, i.e. the capacity factor is 1 (log k = 0):
| (3) |
where φ0 is equal to the ratio of the intercept and slope of equation 2. In addition to determining the log P-values experimentally, they can also be predicted by using a number of log Poct calculation methods.
The isocratic retention times were measured by using various volume percents of acetonitrile in the mobile phase, preferably bracketing the retention when log k’ = 0 (that is the retention time was close to the double of the dead time). The isocratic hydrophobicity index, φ0, was calculated from the slope (S) and the intercept (log k’w) values of the straight lines obtained by plotting log k’ vs φ (φ 0 = intercept/slope), based on minimum three points and r > 0.99. (Shown in Table 1)
Table 1.
The CHI and Log P values of 10 reference compounds for the gradient HPLC calibration for CHI measurement using an acetonitrile gradient.
| Reference Compound | φ0 | tr (gradient) | CHI | HBC | Log Poct (calc.) | Log Poct (literature) |
|---|---|---|---|---|---|---|
| Theophylline | 12.57 | 5.89 | 11.46 | 1 | -0.2 | -0.05 |
| 5-Phenyl-1H-Tetrazole | 14.29 | 6.04 | 12.79 | 1 | -0.14 | 1.42 |
| Benzimidazole | 24.26 | 7.32 | 24.03 | 1 | 0.39 | 1.38 |
| Colchicine | 32.86 | 8.61 | 35.46 | 1 | 0.93 | 0.92 |
| 8-Phenyltheophylline | 43.88 | 9.82 | 46.13 | 2 | 1.79 | 2.05 |
| Acetophenone | 64.67 | 12.03 | 65.62 | 0 | 1.98 | 1.66 |
| Indole | 77.94 | 13.16 | 75.59 | 1 | 2.81 | 2.14 |
| Propiophenone | 81.45 | 13.79 | 81.15 | 0 | 2.71 | 2.19 |
| Butyrophenone | 93.18 | 14.95 | 91.38 | 0 | 3.19 | 2.73 |
| Valerophenone | 98.76 | 15.95 | 100.2 | 0 | 3.61 | 3.28 |
The gradient retention time (tR) (Shown in Table 1) was measured under the gradient profile, which included a 15 min linear acetonitrile gradient from 0 to 100%. The chromatographic hydrophobicity index (CHI) method used fast-gradient reversed phase HPLC to model octanol/water partitioning of a compound by correlating the retention time with the percentage of acetonitrile required to achieve an equal distribution of the compound between the mobile and stationary phases. By plotting φ0 (obtained in isocratic mode) against tR (obtained in gradient mode), a standard curve (Figure 1) and equation (Equation 4) were generated. Based on this equation, CHI of each reference compound was calculated (Shown in Table 1).
| (4) |
Figure 1.

Calibration plot for the measurements of the Chromatographic Hydrophobicity Index (CHI) of 10 reference compounds.
We used 21 commercially available drugs (Table 2) to validate the method. The set represents a wide range of chemical structures and lipophilicities. The plot of the calculated and literature Log Poct values can be seen in Figure 2. The correlation coefficient is 0.9664.
Table 2.
Log Poct values of 21 drug compounds calculated from Gradient retention times (tR), CHI values and hydrogen bond count (HBC) using gradient elution on a PRP-1 column and literature log Poct values.
| Drug | tr (min) | CHI | HBC | Log Poct | Log Poct (literature) |
|---|---|---|---|---|---|
| Adenine | 5.21 | 5.12 | 2 | -0.14 | -0.45 |
| Caffeine | 5.66 | 9.43 | 2 | 0.06 | -0.07 |
| Cimetidine | 6.87 | 19.80 | 3 | 0.91 | 0.46 |
| Acetaminophen | 7.06 | 21.76 | 2 | 0.64 | 0.9 |
| Sumatriptan | 7.31 | 23.83 | 3 | 1.09 | 1.1 |
| Hydrocortisone | 9.12 | 39.78 | 3 | 1.85 | 1.69 |
| Bendroflumethiazide | 10.12 | 48.76 | 3 | 2.27 | 2.09 |
| Lidocaine | 11.31 | 59.03 | 2 | 2.40 | 2.48 |
| Diazepam | 12.07 | 65.16 | 2 | 2.71 | 2.8 |
| Dibucaine | 16.38 | 104.15 | 1 | 4.15 | 4.29 |
| Tinidazole | 7.95 | 29.41 | 0 | 0.28 | 0.12 |
| Trimethoprim | 8.46 | 33.93 | 2 | 1.21 | 1.36 |
| Triamterene | 8.11 | 30.83 | 3 | 1.43 | 1.24 |
| Terbutaline | 6.52 | 16.73 | 4 | 1.13 | 1.57 |
| Tripelennamine | 14.5 | 87.48 | 0 | 3.01 | 2.65 |
| Tolazoline | 10.21 | 49.45 | 1 | 1.59 | 1.21 |
| Benzthiazide | 11.20 | 58.22 | 3 | 2.72 | 2.92 |
| Oxybutynin | 16.36 | 103.97 | 2 | 4.51 | 4.68 |
| Atropine | 9.9 | 46.70 | 2 | 1.81 | 1.83 |
| Hetacillin | 7.59 | 17.35 | 4 | 1.52 | 1.86 |
| Scopolamine | 8.73 | 36.33 | 3 | 1.69 | 1.66 |
Figure 2.
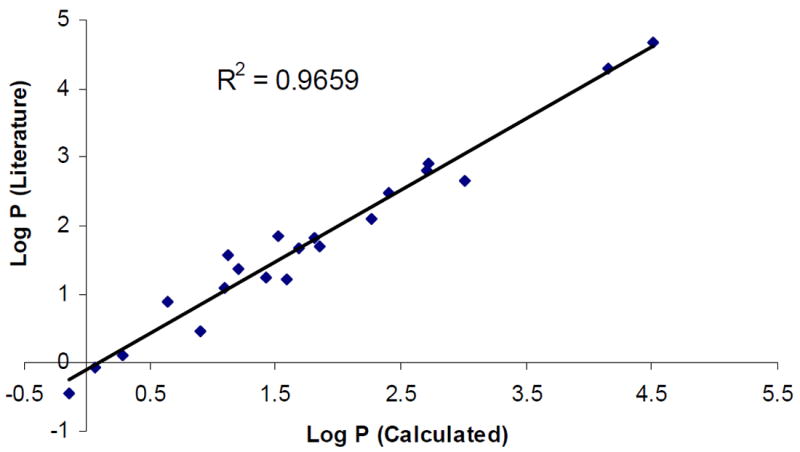
Correlation between calculated and literature Log Poct for 21 drugs.
The difference between the calculated and literature Log Poct values are considered to be not statistically significant. It can be seen that an excellent correlation was found and it provided experimental confirmation of the hypothesis that a linear gradient retention time can be used as a measure of compounds’ lipophilicity using a polymeric PRP-1 column.
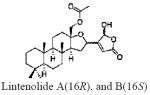
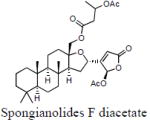
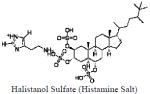
For application of this method for the assessment of the log P of natural products, we used 24 biologically active marine natural products isolated in our laboratory (Shown in Table 3). Since the number of hydrogen bonds of a compound, i.e. the number of protons available for hydrogen bonding, can influence calculated Log Poct, we also have the potential to use this method to estimate the lipophilicity range of natural products, even through we may not know its structure.
By conventional criteria, this difference is considered to be not statistically significant.
Table 3.
Log Poct values determined from gradient retention times (tR), CHI values and hydrogen bond count (HBC) using gradient elution on a PRP-1 column and software calculated log Poct for a series of marine natural products.
| Compound | tR (min) | CHI | HBC | Log Poct | Log Poct (Calc.) |
|---|---|---|---|---|---|
|
15.89 | 99.80 | 1 | 3.95 | 4.36 |

|
13.3 | 76.84 | 2 | 3.23 | 4.5 |

|
14.74 | 89.61 | 2 | 3.78 | 3.52 |

|
16.33 | 103.70 | 0 | 3.77 | 3.98 |
|
17.94 | 117.98 | 0 | 4.44 | 3.98 |

|
16 | 100.78 | 0 | 3.64 | 4.59 |

|
15.85 | 99.45 | 0 | 3.57 | 4.59 |

|
13.91 | 81.91 | 0 | 2.75 | 5 |

|
7.44 | 24.89 | 2 | 0.77 | 0.5 |
|
9.16 | 40.12 | 2 | 1.51 | 3.52 |

|
13.9 | 82.16 | 0 | 2.76 | 1.51 |

|
18.19 | 120.19 | 2 | 5.27 | 5.47 |

|
14.22 | 84.00 | 3 | 3.97 | 4.17 |

|
15.83 | 99.27 | 3 | 4.59 | 4.4 |

|
16.05 | 101.22 | 3 | 4.68 | 4.4 |

|
13.63 | 79.77 | 1 | 3.01 | 2.65 |

|
14.48 | 87.30 | 3 | 4.08 | 2.65 |

|
17.7 | 115.85 | 1 | 4.70 | 5.52 |

|
10.73 | 54.06 | 4 | 3.08 | 2.11 |

|
10.48 | 51.84 | 2 | 2.16 | 1.52 |

|
12.31 | 68.06 | 2 | 2.06 | 1.75 |

|
9.75 | 45.37 | 3 | 2.11 | 0.32 |

|
10.32 | 50.42 | 2 | 1.74 | 0.74 |
|
|
9.85 | 46.26 | 2 | 3.90 | 1.02 |
Although natural products are considered to be an enormous resource of drug candidates and can provide countless opportunities to discover new drugs, interest in the development of natural products by the pharmaceutical industry has declined. [18, 19, 20] A major factor for the decrease in natural products is that modern drug discovery research requires rapid screening, hit identification and hit to lead development. If natural products are to be considered again as an invaluable resource of lead compounds by the pharmaceutical industry natural products programs need to comply with the current timelines of the current drug discovery paradigm established with the high-throughput screening of synthetic chemical libraries.
Recently, Quinn et al prepared a screening library of 814 natural products in which 85% of the compounds had no Lipinski violations and demonstrated the possibility of generating natural libraries that conform to the physicochemical properties required in today’s drug discovery environment.[11, 21] According to Lipinski’s “Rule of Five”, drug candidates should possess suitable hydrophobicity (partition coefficient log P less than 5).[2] Thus, integration of drug-like properties screening into the early stages of drug development could potentially speed up the drug development process. The shake-flask procedure is the standard method for determining log Poct’s in the range of -2 – 4. [22] However, it is time and labor consuming and requires relatively large amounts of pure compounds. So, the traditional shake-flask method is not suitable for natural product research in which sample is limited. The RP-HPLC method is an indirect way to estimate log Poct values in the range of 0 – 6 and has become a standard procedure. The advantages of this approach such as, speed, insensitivity to impurities, reduced sample handing and sample sizes makes it amenable for natural products drug discovery research.
Valkó introduced a chromatographic hydrophobicity index based on a fast-gradient RP-HPLC method, and also established equation of Log P calculation.[9] Based on his work, we applied this methodology using a polymeric PRP-1 column to estimate lipophilicity. The result of this study validated the use of the PRP-1 polymeric reversed phase fast gradient HPLC method for determining lipophilicity and showed that we can estimate the lipophilicity of natural products with good accuracy.
The estimated log P’s of the 24 marine natural products isolated in our laboratory matched the requirement of drug-like criteria (0 < Log Poct < 5). We did see some large differences in the experimentally determined log P values and the calculated values. The most significant differences were for the natural products containing bromine and chlorine. The large variation in natural products containing bromine has been previously reported.[11] In the future, we believe integration of a HPLC method to estimate lipophilicity into our natural product isolation process will allow us to optimize the generation of natural product libraries for HTS and develop an efficient polarity-optimized approach for the discovery of potential bioactive natural products.
CONCLUSION
In this study a fast-gradient HPLC method using a polystyrene-divinylbenzene PRP-1 column has been demonstrated to be useful for the estimation of lipophilicity. An excellent correlation was found between the results of the experimental determinations and the literature values of log P for a diverse set of commercially available drugs. We also found a good correlation between the experimentally determined and software calculated log P’s for a diverse set of marine natural products. Some discrepancies were observed between the measured value of log P and the software calculations of the natural products containing halogens atoms. The method is rapid, insensitive to impurities, and requires very little compound and is amenable for integrated into a natural products drug discovery research program.
Acknowledgments
We thank Prasoon Gupta, Upasana Sharma, and Maia Mukherjee for the isolation of the marine natural products used in this study. The compounds were isolated for the molecular libraries screening network (MLSCN) funded by NIH grant P41GM07957. We also thank J. Haky for helpful discussions.
References
- 1.Avdeef Alex. Physicochemical profiling (solubility, permeability and charge state) Current Topics in Medicinal Chemistry. 2001;1:277–351. doi: 10.2174/1568026013395100. [DOI] [PubMed] [Google Scholar]
- 2.Lipinski CA, Lombardo F, Dominy BW, Feeney PJ. Experimental and computational approaches to estimate solubility and permeability in drug discovery and development settings. Advanced Drug Delivery Reviews. 1997;23:3–25. doi: 10.1016/s0169-409x(00)00129-0. [DOI] [PubMed] [Google Scholar]
- 3.Lipinski CA. Lead- and drug-like compounds: the rule-of-five revolution. Drug Discovery Today: Technologies. 2004;1:337–341. doi: 10.1016/j.ddtec.2004.11.007. [DOI] [PubMed] [Google Scholar]
- 4.Hartmann T, Schmitt J. Lipophilicity – beyond octanol/water: a short comparison of modern technologies. Drug Discovery Today: Technologies. 2004;1:431–439. doi: 10.1016/j.ddtec.2004.10.006. [DOI] [PubMed] [Google Scholar]
- 5.Zhao Y, Jona J, Chow DT, Rong H, Semin D, Xia X, Zanon R, Spancake C, Maliski E. High-throughput log P measurement using parallel liquid chromatography/ultraviolet/mass spectrometry and sample-pooling. Rapid Communications in Mass Spectrometry. 2002;16:1548–1555. doi: 10.1002/rcm.749. [DOI] [PubMed] [Google Scholar]
- 6.Chen Z, Weber SG. High-Throughput method for lipophilicity measurement. Anal Chem. 2007;79:1043–1049. doi: 10.1021/ac061649a. [DOI] [PMC free article] [PubMed] [Google Scholar]
- 7.Kaliszan R, Haber P, Czek TB, Siluk D, Valkó K. Lipophilicity and pKa estimates from gradient high-performance liquid chromatography. Journal of Chromatography A. 2002;965:117–127. doi: 10.1016/s0021-9673(02)00114-0. [DOI] [PubMed] [Google Scholar]
- 8.Valkó K, Bevan C, Reynolds DP. Chromatographic Hydrophobicity Index by Fast-Gradient RP-HPLC: A High-Throughput Alternative to log P/log D. Anal Chem. 1997;69:2022–2029. doi: 10.1021/ac961242d. [DOI] [PubMed] [Google Scholar]
- 9.Valkó K, Du DM, Bevan C, Reynolds DP, Abraham MH. Rapid Method for the Estimation of Octanol/Water Partition Coefficient (Log Poct) from Gradient RP-HPLC Retention and a Hydrogen Bond Acidity Term (Sa2H) Current Medicinal Chemistry. 2001;8:1137–1146. doi: 10.2174/0929867013372643. [DOI] [PubMed] [Google Scholar]
- 10.Giaginis C, Tsantili-Kakoulidou A. Current state of the art in HPLC methodology for lipophilicity assessment of basic drugs. Journal of Liquid Chromatography & Related Technologies. 2008;31:79–96. [Google Scholar]
- 11.Quinn RJ, Carroll AR, Pham NB, Baron P, Palframan ME, Suraweera L, Pierens GK, Muresan S. Developing a drug-like natural product library. Journal of Natural Products. 2008;71:464–468. doi: 10.1021/np070526y. [DOI] [PubMed] [Google Scholar]
- 12.Houssen WE, Jaspars M. In: Isolation of Marine Natural Products, in Natural Products Isolation. Sarker SD, Latif Z, Gray AI, editors. Vol. 20. Humana Press Inc; Totowa, NJ: 2006. pp. 353–391. [Google Scholar]
- 13.van Liedekerke BM, Nelis HJ, Lambert WE, de Leenheer AP. High performance liquid chromatography of quaternary ammonium compounds on a polystyrene-divinylbenzene column. Anal Chem. 1989;61:728–732. [Google Scholar]
- 14.Huck CW, Bonn GK. Poly(Styrene-Divinylbenzene) based media for liquid chromatography. Chem Eng Technol. 2005;28:1457–1472. [Google Scholar]
- 15.Haky JE, Vemulapalli S. Comparison of octadecyl-bonded alumina and other stationary phases for lipophilicity estimation by high performance liquid chromatography. Journal of Liquid Chromatography. 1990;13:3111–3131. [Google Scholar]
- 16.Abraham MH, Chadha HS, Leitao RAE, Mitchell RC, Lambert WJ, Kalisan R, Nasal A, Haber P. Determination of solute lipophilicity, as log P(octanol) and log P(alkane) using poly(styrene-divinylbenzene) and immobilized artifical membrane stationary phases in reversed-phase high-performance liquid chromatography. Journal of Chromatography A. 1997;766:35–47. [Google Scholar]
- 17.Valkó K, Slégel P. New chromatographic hydrophobicity index (ϕ0) based on the slope and the intercept of the log k’ versus organic phase concentration plot. Journal of Chromatography. 1993;631:49–61. [Google Scholar]
- 18.Cragg GM, Newman DJ. Discovery and development of antineoplastic agents from natural sources. Cancer-Invest. 1999;17:153–163. [PubMed] [Google Scholar]
- 19.Itokawa H, Morris-Natschke SL, Akiyama T, Lee KH. Plant-derived natural product research aimed at new drug discovery. Nat Med (Tokyo) 2008;62:263–280. doi: 10.1007/s11418-008-0246-z. [DOI] [PubMed] [Google Scholar]
- 20.Koehn FE, Carter GT. The evolving role of natural products in drug discovery. Nat Rev Drug Discov. 2005;4:206–220. doi: 10.1038/nrd1657. [DOI] [PubMed] [Google Scholar]
- 21.Koehn FE. High impact technologies for natural products screening. Progress in Drug Research. 2008;65:177–210. doi: 10.1007/978-3-7643-8117-2_5. [DOI] [PubMed] [Google Scholar]
- 22.OECD Guidelines for the Testing of Chemicals, Test No 107. Organization for Economic Co-operation and Development (OECD); Paris: 1995. [Google Scholar]