Abstract
Background
Esophageal intestinal metaplasia, also known as Barrett’s esophagus, is the replacement of the normal epithelium with one that resembles the intestine morphologically. Generally, this includes intestinal mucin-secreting goblet cells. Barrett’s esophagus is an important risk factor for adenocarcinoma development. In vitro models for Barrett’s esophagus have not, to date, focused on the induction of goblet cells in Barrett’s epithelium.
Aims
To explore the contribution of Math1/Atoh1 in the induction of Barrett’s esophagus and intestinal mucin-secreting goblet cells from normal human esophageal epithelium.
Methods
We explored the level and pattern of Math1/Atoh1 mRNA and protein expression in human Barrett’s esophagus. Then, using retroviral-mediated gene expression, we induced Math1 mRNA and protein expression in a human esophageal keratinocyte cell line. We evaluated the effects of this ectopic Math1 expression upon cell proliferation and gene expression patterns in cells cultured under 2-dimensional and 3-dimensional tissue engineering conditions.
Results
Math1/Atoh1 mRNA and protein are detected in human Barrett’s esophagus specimens, but the mRNA levels vary considerable. In the keratinocyte expression studies, we observed that Math1/Atoh1 ectopic expression significantly reduced cell proliferation and altered cell morphology. Moreover, Math1/Atoh1 expression is associated with a more intestinalized gene expression pattern that is distinct from prior published studies using other intestinal transcription factors. Most significantly we observe the induction of the Barrett’s esophagus markers Mucin-2 and Keratin-20 with Math1/Atoh1 expression.
Conclusions
We conclude that ectopic Math1/Atoh1 expression makes unique contributions to the intestinalization of esophageal epithelium in Barrett’s esophagus.
Keywords: Barrett’s esophagus, Math1/Atoh1, Keratin-20, metaplasia, Mucin-2, organotypic culture
INTRODUCTION
Intestinal-type epithelium is normally confined to the small intestine and colon. Intestinal metaplasia (IM), where intestinal-type epithelium is observed ectopically in other tissues, has been reported in a number of gastrointestinal and non-GI tissues including the esophagus, stomach, pancreas, liver, gall bladder, bile ducts, ovary, endometrium, and sinonasal epithelium, among others [1]. The pathological definition of IM requires the replacement of normal epithelium with an epithelium that resembles the intestine morphologically. Generally, this includes the presence of intestinal mucin-secreting goblet cells [2,3], though there are incomplete forms of IM [3] and a current debate as to whether goblet cells are in fact required for the definition of IM in some tissues [4]. Although intestinal metaplasias are themselves benign and asymptomatic, they are considered to be an important risk factor for adenocarcinoma development and are therefore a clinically relevant lesion to study [5,6,7].
Efforts to understand the pathogenesis of IM of the esophagus, known also as Barrett’s esophagus, have largely focused on the role of acid and bile reflux or chronic inflammatory environments as the catalyst that promotes the emergence of the intestinalized epithelium [1,8,9,10]. More recently, we and others have focused on genetic and developmental mechanisms that seek to explain how the multilayered squamous epithelium is replaced by an intestinalized columnar epithelium. These studies have explored the role of several developmentally critical transcription factors in the pathogenesis of Barrett’s esophagus, including Cdx2 [11,12], Hedgehog [13], and p63 [14]. However, no study has explored the role of factors necessary for goblet-cell development in models of Barrett’s pathogenesis.
The Math1 gene, also known as Atonal homologue 1 or Atoh1, encodes a basic helix-loop-helix (bHLH) transcription factor that is expressed in the developing nervous system where it is required for cerebellar development [15] and differentiation of hair cells in the inner ear [16]. In the intestine, Math1/Atoh1 is required for the differentiation of the three secretory cell lineages, enteroendocrine, Paneth, and goblet cells [17]. Moreover, Math1 regulates the expression of the classic intestinal and Barrett’s goblet cell mucin gene Muc2 [18]. Math1 is also a potent antiproliferative transcription factor with tumor suppressor effects in colon cancer [18,19]. Expression of HATH1 (the human Math1/Atoh1 homologue) has previously been reported in human Barrett’s esophagus [20], but no studies exploring the role for HATH1 in the pathogenesis of BE have been described. In support of this hypothesis, it was recently demonstrated that ectopic Math1 expression could drive intestinal epithelial cells to adopt a secretory rather than absorptive cell fate [21]. Math1/HATH1 may similarly drive the induction of the goblet cell fate in Barrett’s esophagus.
In previous studies we employed a human esophageal keratinocyte cell line grown using a highly novel 3-dimensional culture technique to model the contributions of intestinal genes to the pathogenesis of Barrett’s [11,22,23]. We determined that ectopic expression of the intestine-specific transcription factor Cdx2, when combined with cyclin D1 or c-Myc expression, induces a more Barrett’s-like gene expression pattern [11,23,24]. More recently we found Cox2 activity or Wnt signaling can induce significant intestinalization under similar conditions [22]. In the current study, we induce expression of the intestinal secretory cell transcription factor Math1 in human esophageal kertinocytes. We observe a significant alteration of cell morphology and cell proliferation when Math1 expressing cells are cultured under both 2-dimensional and 3-dimensional culture conditions. Moreover, Math1 expression is associated with a more intestinalized gene expression pattern that is distinct from the prior studies and includes the induction of the Barrett’s esophagus markers Mucin-2 and Keratin-20. Together this suggests Math1 may make unique contributions to the intestinalization of esophageal epithelium in Barrett’s esophagus.
MATERIALS AND METHODS
Cell Culture and Transfections
Immortalized human primary esophageal epithelial cells STR (EPC-hTERT) were developed and maintained as previously described[11,25,26] and were transduced with retroviral vectors as described [11,23]. MSCV-Math1-GFP was kindly provided by Dr. Martine F. Roussel, St. Jude Children’s Research Hospital, Memphis, TN. cDNAs for Math1 was cloned into mouse stem cell virus–internal ribosome entry site (IRES)–green fluorescent protein (GFP) vector. The inserted region of the constructs was verified by DNA sequencing. Infectious retrovirus was then generated and used to infect human esophageal keratinocyte STR cells as described [11,22].
Cell proliferation assays
BrdU incorporation was measured in Math1 expressing and control cells. Cells were incubated with BrdU (Zymed) for 1 hr before fixation. BrdU staining was conducted via standard methods. DAPI (Sigma) was used at a concentration of 1μg/ml to highlight all cells. Fluorescent samples were visualized and imaged using software (IPLab; Scanalytics, Fairfax, VA). Cells stained for BrdU were scored by counting five high-power fields. Cell proliferation was also quantified by colorimetry based on the metabolic cleavage of the tetrazolium salt WST-1 in viable cells as recommended by the manufacturer (Roche Applied Science, Mannheim, Germany).
RNA Isolation and Real-time quantitative PCR analysis
Total RNA was isolated from GFP-sorted and control cells using the RNAeasy kit (Qiagen). 5 μg of total RNA was used for cDNA synthesis using the First-Strand cDNA synthesis Kit (Invitrogen). Reverse-transcriptase negative controls were included. Primer sequences for PCR are available in Supplementary Table SI. For the RT-PCR, cDNA and primers were mixed with SYBR-green RT-PCR Master Mix (Applied Biosystems) and then assayed in an ABI Prism 7000 sequence detection system as directed by the manufacturer. A ribosomal phosphoprotein, 36B4, was used as the normalization control. Fold change in RNA levels was calculated from the Ct values using the formula previously described [27,28]. The ΔΔCt values for each gene were averaged across the RNA pools, standard deviations calculated, and statistical comparisons performed using ANOVA and Tukey Rank Mean testing. These values were then converted to fold change to graphically report the findings.
Protein Extraction and Western Blot Analysis
Whole cell extract was prepared as described [22,29,30]. Protein concentration of samples and bovine serum albumin standard was determined using the BCATM protein assay kit (Pierce Biotechnology, Rockford, IL, USA). Primary antibodies used included: rabbit anti-math1 (1:1,000, gift from Dr. Jane E. Johnson, University of Texas Southwestern Medical center, Dallas, TX, USA), anti-mucin 2 (1:1,500, Santa cruz biotechnology Inc., CA), mouse anti-cytokeratin 20 (1:1,000, M7019, DakoCytomation), mouse anti–tubulin (1:2,000, Sigma), and anti-actin (1:2000, Sigma) at 4 °C. The secondary antibodies used were all from Sigma-Aldrich and used at 1:3000. Targeted proteins were visualized using an enhanced chemiluminescence detection system (ECL Plus; Amersham Pharmacia Biotech) and exposed to Blue Lite Autorad film (ISC-BioExpress).
Organotypic 3D culture
Organotypic culture was performed as previously described [22,23]. In brief, 0.5 × 10⁶ of STR.M.Math1 cells or their control STR.M cells were seeded on top of the collagen/Matrigel matrices containing FEF3 human fetal esophageal fibroblasts, and grown in submerged conditions for 4 days. Cultures were then raised to the air-liquid interface for additional 4 days and harvested. The cultures were split, with half fixed and embedded for histochemical studies, and the remainder processed for RNA extraction. Each organotypic culture experiment was performed in triplicate.
Quantitative RT-PCR based TaqMan® low-density arrays
TaqMan Array 96-well fast plate (custom format 48) (Applied Biosystems ) included 45 specific genes and 3 housekeeping genes as internal controls. Total cellular RNA (2.5 μg) was reverse-transcribed using SuperScript® VILO™ cDNA Synthesis Kit (Invitrogen life technology, Carlsbad, CA, USA). 1.25 ng of cDNA was taken for real-time PCR using ABI StepOnePlus™ Real-Time PCR System (Applied Biosystems). The comparative Ct-method was applied for quantification. The amount of mRNA of a specific gene was measured by its threshold cycle (Ct) and normalized to that of 36B4, GAPDH, and 18S as n-fold difference (Ct) respectively. The expression of genes of interest in each sample was then compared with the amount of a calibrator sample – that is, the expression in the corresponding empty vector control (Ct). Customized 96-well LDAs (Low density arrays) for PCR amplification were designed using individual primers for genes of interest, chosen and purchased from the assays on demand gene-expression products (Applied Biosystems) listed in Supplementary Table S1. The probes were labeled with 5′-FAM™ and 3′-minor groove binder/nonfluorescent quencher. To control for the specificity of the assay, genomic DNA and total cellular RNA extracted from biopsies were also tested. A total of 20 μl mastermix containing cDNA were loaded into each well. Each LDA containing the genes of interest was loaded with cDNA from STR-M. Math1 and control STR.M cells for quantification of mRNA expression of all the selected genes in one experiment by the same array.
Alcian blue staining and Immunostaining
Immunostaining assay was performed as previously described [22,23]. Harvested organotypic cultures were fixed in 1.5% paraformaldehyde and embedded in paraffin. For histology and immunohistochemistry, 5-μm-thick sections were cut from the paraffin blocks and stained with hematoxylin and eosin (H&E) or Alcian blue by standard procedures. Immunohistochemical staining was performed by standard techniques. Primary antibodies used include bromodeoxyuridine (BrdU) antibody (1:2,500, Upstate, Charlottesville, VA), Rabbit Math1 antibody (1:100, gift from Dr. Jane E. Johnson, University of Texas Southwestern Medical center, Dallas, TX, USA), mouse monoclonal anti-cytokeratin 20 (1:50, M7019, DakoCytomation), rabbit anti-mucin 2 (1:750, sc-15334, Santa Cruz bitotechnology Inc., CA), Ki67 (1:3,000, VP-RM04, Vector Laboratories, Burlingame, CA). Sections were incubated with primary and biotinylated secondary antibodies and an avidin-horseradish peroxidase conjugate (Vectastain Elite ABC kit; Vector Laboratories, Burlingame, CA) following the manufacturer’s protocol. The signal was developed using the 3,3-diaminobenzidine substrate kit (Vector Laboratories). Sections were counterstained with hematoxylin. Images were obtained at 40X using a Leica microscope with the Retiga 2000R digital camera and the IP Lab imaging software application (BD Biosciences, Rockville, MD). Exposure times were kept constant for all samples. Math1 antibody and Cy3 labeled anti-rabbit secondary antibody were used for immunofluorescence. As negative controls, parallel sections were similarly processed without the respective primary antibody for each immunostaining experiment. Normal small intestine sections were used as a positive control for Math1, cytokeratin 20 and mucin 2.
RESULTS
Expression of HATH1 mRNA and protein in Barrett’s esophagus
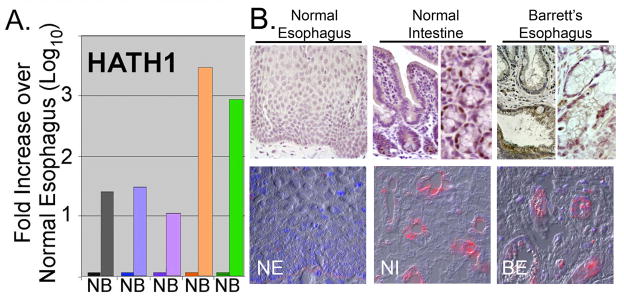
A single study has identified the expression HATH1 in human Barrett’s esophagus. We wanted to confirm and extend this work. We examined HATH1 mRNA levels in total RNA isolated from 5 paired biopsies from BE tissue and adjacent normal squamous epithelium. Quantitative real-time SYBR Green RT-PCR was then performed for HATH1. In each case there was a significant increase in the mRNA levels for HATH1 in the BE samples when compared to the control normal adjacent esophageal epithelium (Figure 1A). In three samples the increase ranged from 10- to 30-fold, while in the remaining two the increase was approximately a 1000-fold. This is very different pattern than we observed in prior studies using these RNA samples, where we noted more consistent expression for DRA/SLC26a3, NHE2, and KRT20 mRNAs across the 5 samples [11].
Figure 1. HATH1 overexpression in human Barrett’s esophagus.
A. Quantitative real-time PCR measurement of HATH1 mRNA levels in biopsies from human Barrett’s esophagus (B) and adjacent normal (N) esophageal mucosa. B. Representative immunohistochemical and immunofluorescence staining for HATH1 protein in normal human esophagus (NE), normal human intestine (NI), and Barrett’s esophagus (BE) biopsy specimen. Normal esophagus and intestine are presented as controls. One of several Barrett’s biopsy specimens is shown.
To confirm that these increased HATH1 mRNA levels yield significant increases in protein expression, we stained several BE biopsy specimens for HATH1 by immunohistochemistry. Robust HATH1 protein expression is detected in the BE biopsy specimens and the normal intestine tissues, but not in the normal esophagus control (Figure 1B). This is best appreciated by the immunofluorescence images. The pattern of HATH1 protein expression in BE differs from that seen in the intestine. In the intestine, HATH1 protein is observed in scattered nuclei in each of crypts examined, particularly at the base in the secretory Paneth cells. However HATH1 was not regularly detected in goblet cells even though HATH1 expression is required for goblet cell development [17]. In the BE tissue the HATH1 protein expression is patchy, detected in some crypt-like structures and not in others (Figure 1B). Moreover, some HATH1 protein is detected in the cytoplasm as well as the nucleus of cells with goblet cell features. Taken together, these findings confirm that the HATH1 gene and protein are induced in BE, but the pattern of expression and protein levels may differ from that observed in the normal intestine.
Induction of Math1 mRNA and protein expression in normal human esophageal keratinocytes reduces cell proliferation
One approach to modeling the pathogenesis of BE is to ectopically induce the expression of transcription factors and other BE effectors in esophageal squamous epithelium to determine if metaplasia can be induced. This is based on previous reports identifying expression of some of these factors in the setting of reflux esophagitis prior to the onset of metaplasia [31,32,33], and studies in gastric intestinal metaplasia, in which ectopic expression of intestinal transcription factors was sufficient to intestinalize the gastric epithelium [34,35].
In previously published studies by us we have used this approach to explore the effects of ectopic Cdx1 and c-Myc, Cdx2 and cyclin-D1, Cox2, and Wnt activation upon a human esophageal keratinocyte cell line, called STR cells (EPC2.hTert), that has been immortalized by telomerase expression [11,12,22,23]. In each case the ectopically expressed genes induced an altered cell differentiation pattern that was more intestinalized and generally associated with diminished differentiation of the squamous epithelium. While Cdx1 and c-Myc coexpression or Cox2 expression alone induced significant production of intestinal mucins, neither succeeded at inducing goblet cells, a key diagnostic feature for Barrett’s esophagus [1].
Given the importance of Math1/Atoh1 for secretory cell lineage development [21], we wanted to induce Math1 expression in our human keratinocyte cell line to explore what effect this might have on the squamous phenotype. We obtained a Math1 cDNA (kindly provided by Martine Roussel, St. Jude Children’s Research Hospital) and subcloned it into our MIGR1 retroviral expression vector, which we have used successfully before [11,27,36]. This vector expresses both Math1 and GFP in a single, bicistronic mRNA, and we are able to established successful infection by following GFP protein. We used this vector to express Math1 in normal human esophageal keratinocyte STR cells [25,26].
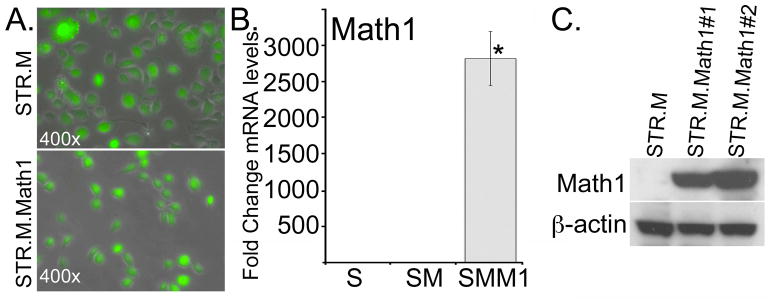
Two distinct cell lines were produced of separate retroviral infections by the MIGR.Math1 retrovirus after GFP selection by flow cytometry, STR.M.Math1#1 and STR.M.Math1#2 (Figure 2A and data not shown). Similarly two control cell lines (STR.M#1 and STR.M#2) were isolated after receiving the empty cassette retrovirus (Figure 2A and data not shown). We demonstrate a significant increase in Math1 mRNA and protein levels by QPCR and Western Blot analysis when compared to the empty-cassette control STR.M cells (Figure 2B and 2C).
Figure 2. Establishing active Math1 expression in human esophageal keratinocytes.
Human STR keratinocytes were infected with a retroviral vector to induce Math1 expression (MIGR-Math1) or the control empty viral vector MIGR-GFP. GFP expression serves as a marker for viral infection and gene expression A. GFP fluorescence in post flow cytometry sorted STR.M control and STR.M.Math1 cells. B. Fold change in Math1 mRNA levels by QPCR after MIGR-GFP infection and selection. STR.M.Math1 cells (SMM1), compared to uninfected control STR cells (S) and MIGR1 virus infected controls (SM). ΔCt values were calculated after duplicate PCRs for each sample, then statistical analysis performed (ANOVA and Tukey Rank Mean). ΔΔCt values were then calculated and used to determine fold-change in expression. n=4. * significantly differs from STR and STR.M control cells, p<0.05. C. Western blot analysis for Math1 protein levels in control (STR.M) and Math1 expressing cell lines (STR.M.Math1#1 and STR.M.Math1#2).
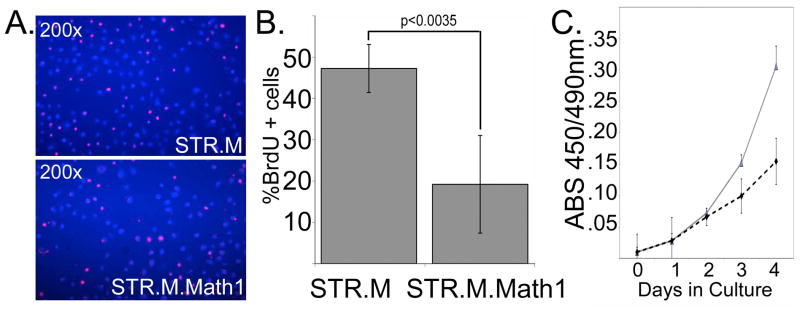
Math1 is a known tumor suppressor with antiproliferative properties in human colon cancer cells [18,19]. However its effect upon human esophageal keratinocyte proliferation is unknown. To measure cell proliferation in these cells we performed BrdU labeling and WST1 assays (Roche Applied Science). Math1 expression was associated with a significant reduction in cell proliferation, with BrdU incorporation diminished by more than half when compared to controls (Figure 3A and 3B). Similarly, STR.M control cell numbers increased much faster in culture compared to STR.M.Math1 cells, as demonstrated by the WST1 assay (Figure 3C). In summary, we have established human esophageal keratinocyte cell lines with ectopic Math1 expression. This expression was associated with significantly diminished cell proliferation in the human STR esophageal keratinocytes.
Figure 3. Math1 expression in human esophageal keratinocytes reduces cell proliferation.
A. BrdU incorporation assay performed on performed on STR.M and STR.M.Math1 cells. Immunofluorescence image with BrdU+ cells (Red nuclei) and DAPI nuclear counterstain (Blue nuclei). B. Quantitation of BrdU incorporation assay for STR.M and STR.M.Cox2 cells. n=4. C. WST-1 cell accumulation study of STR.M and STR.M.Math1 cells. Solid black line: STR.M cells. Dashed line: STR.M.Math1 cells. n=8. One of three experiments is shown.
Math1 expression is associated with altered cell morphology and a more intestinalized pattern of gene expression in human esophageal keratinocytes
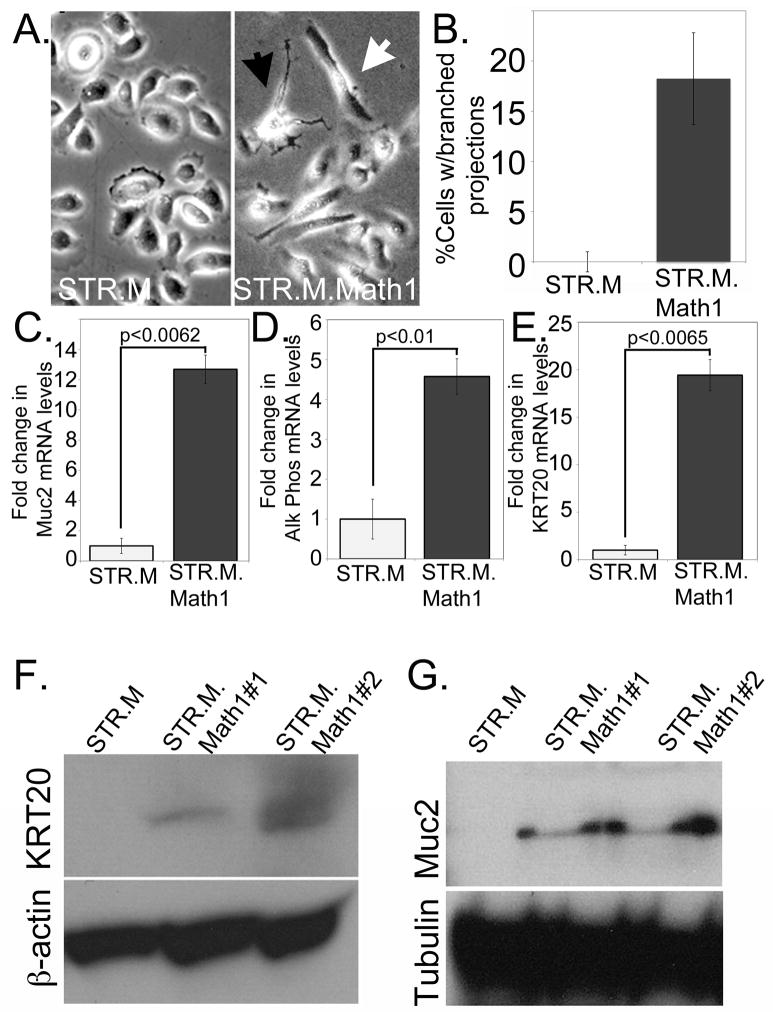
Once we had established the Math1-expressing STR keratinocytes, we noted that a subset of cells demonstrated a significantly altered cell morphology (Figure 4A). While some cells appeared elongated compared to controls, what was striking was the minority of cells that extended many branched projections that had the appearance of neural dendrites. When we counted the number of these multi-branched cells that we observed, we found nearly 20% of the STR.M.Math1 cells expressed this altered morphology (Figure 4B).
Figure 4. Increased Math1 expression alters cell morphology and gene expression patterns in STR cells.
A. Phase contrast images of STR.M control and STR.M.Math1 cells demonstrating differences in cell morphology. Black arrowhead: cell with multiple branched projections. White arrowhead: elongated cells. B. Quantification of branched cells. The number of cells with three or more branches were counted in at least 50 total cells, and the average from 5 separate wells determined. Statistically different by Student’s T-test, n=5. C. Quantitative SYBR-green RT-PCR (QPCR) analysis of Muc2 gene expression in STR.M and STR.M.Math1 cells. ΔCt values were calculated as before, then statistical analysis performed (Student’s T-test). n=3 samples. D. QPCR analysis for Alk Phos gene expression in STR.M and STR.M.Math1 cells. n=3. E. QPCR analysis for KRT20 gene expression in STR.M and STR.M.Math1 cells. n=3. F and G. Western blot analysis for Muc2 (F.) and KRT20 (G.) protein levels in STR cells expressing Math1 (STR.M.Math1#1 and STR.M.Math1#2) and control cells (STR.M). Beta-actin served as loading control
We next examined the STR.M.Math1 cells for changes in mRNA levels for a small panel of genes associated with intestinal epithelium and Barrett’s esophagus. Several of these genes, including NHE2 and Villin, were not significantly induced by ectopic Math1 expression (data not shown). However, mRNA levels for important Barrett’s epithelium markers Mucin-2, Alkaline Phosphatase, and Keratin-20 were induced 5- to 20-fold (Figures 4C, 4D, and 4E. Moreover, these enhanced mRNA levels were associated with significantly increased Mucin-2 and Keratin-20 protein, as determined by Western blot analysis (Figure 4F and 4G). In summary, ectopic Math1 expression in human esophageal keratinocytes can induce an altered cell morphology and several Barrett’s associated gene products including the critical Barrett’s esophagus markers Mucin-2 and Keratin-20
Math1 expressing cells cultured under 3-dimensional organotypic conditions demonstrate altered cell proliferation but normal engineered tissue growth
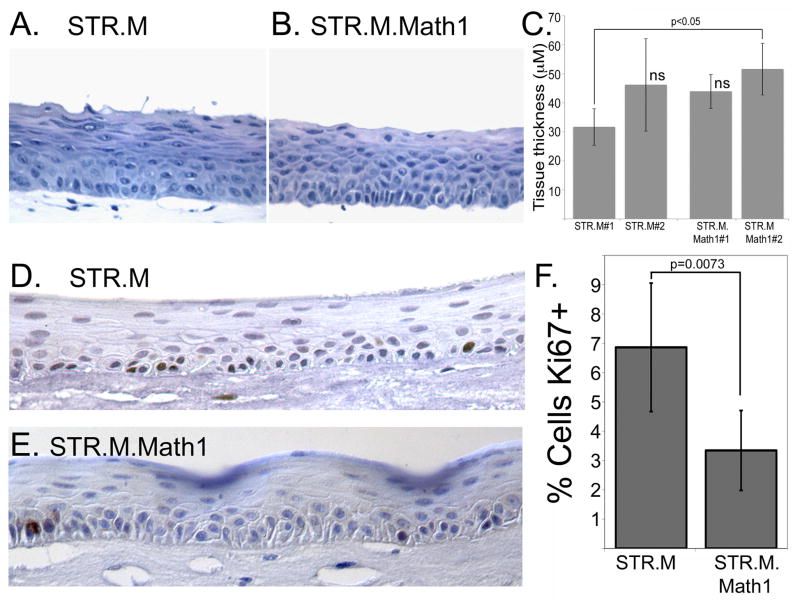
We examined the STR.M.Math1 cells for changes in cell differentiation and greater intestinalization when cultured under 3-dimensional organotypic conditions, as we have demonstrated previously for other genes [22,23]. Surprisingly, the stratified epithelium that developed from the STR.M.Math1 cells did not appear noticeable thinner despite the demonstrated effects Math1 had upon cell proliferation (Figure 5A and 5B). This was confirmed by measurements of epithelium thickness (Figure 5C), in which only one pair were different statistically (STR.M#1 and STR.M.Math1#2). Moreover, the reduced proliferation rate of the STR.M.Math1 cells was maintained in the organotypic culture conditions, where the frequency of Ki67+ cells was half that seen in the control STR.M epithelium (Figure 5D, 5E, and 5F). This suggests the epithelial thickness is maintained by the STR.M.Math1 cells by other means. One possibility may be cell size. The superficial layers of the STR.M.Math1 epithelium appears to contain fewer nuclei than the control tissue but more cytoplasm, possibly due to diminished terminal cell differentiation. Together these findings support the conclusion that ectopic Math1 expression reduces human keratinocyte STR cell proliferation but tissue thickness is preserved when the cells are cultured under organotypic conditions.
Figure 5. Math1 expression reduces STR cell proliferation but does not alter epithelial thickness when cells cultured under organotypic conditions.
Hematoxylin and eosin stain of epithelial tissues sections from A. STR.L control cells and B. STR.M.Math1 cells after cultured under organotypic conditions. C. Quantification of epithelial thickness, measured in three regions from three different tissue sections per culture. n=9. ns not significantly different by ANOVA and Tukey Rank Mean testing. D. and E. Ki67 staining in tissue sections from D. STR.M and E. STR.M.Math1 cells. F. Quantitation of Ki67 positive staining. The number of Ki67+ cells was expressed as a percentage of the total number of basal keratinocytes in a counted field. n=6
Math1 expression induces the expression of the Barrett’s esophagus markers Mucin-2 and Keratin-20 in human esophageal keratinocytes
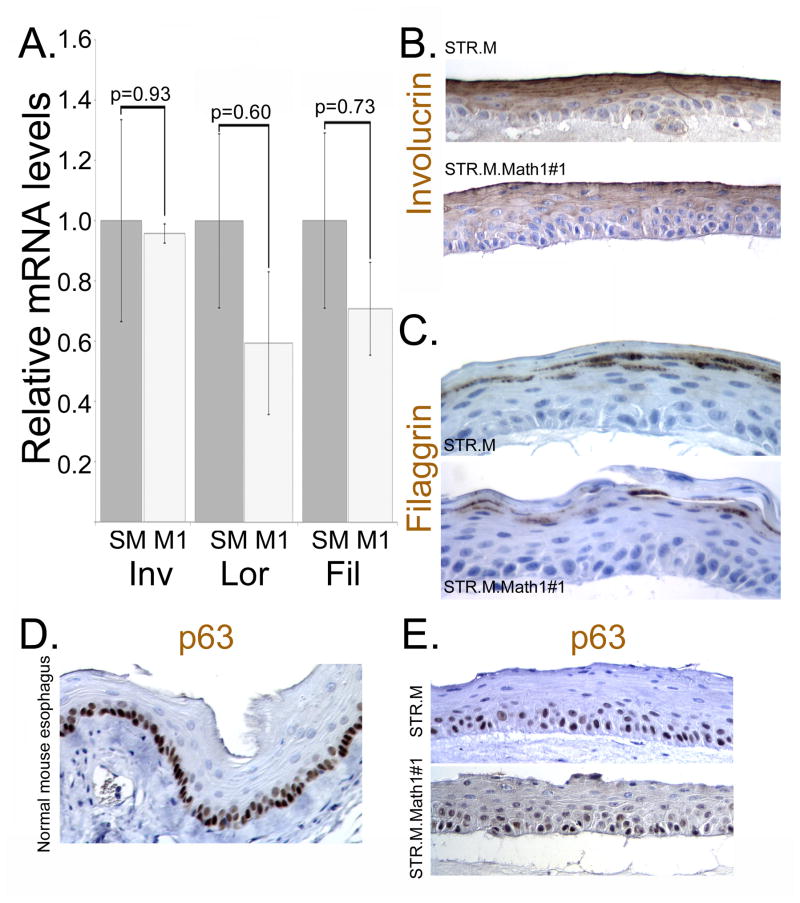
We next evaluated the organotypic cultures for evidence of altered cell differentiation and the promotion of a more intestinalized epithelium morphologically or by gene expression patterns. We first examined for changes in normal keratinocyte differentiation in the organotypically cultured STR.M and STR.Math1 cells. Expression of the differentiation markers involucrin, loricrin, and filaggrin were not significantly altered either at the mRNA or protein levels (Figure 6A, 6B, and 6C). Moreover, the keratinocyte stem cell marker p63 similarly appeared unchanged in the organotypically cultured cells whether or not Math1 was expressed (Figure 6D and 6E). Together this suggests Math1 expression did not significantly alter normal keratinocyte differentiation patterns.
Figure 6. The normal keratinocyte gene expression patterns are not significantly altered by Math1 expression in the 3-dimensional organotypic cultures.
A. Quantitative SYBR-green RT-PCR analysis of involucrin, loricrin, and filaggrin mRNA expression in STR.M (grey bar, SM) or STR.M.Math1 (White bars, M1) cells cultured under 3D organotypic conditions. ΔCt values were calculated after duplicate PCRs for each sample, then statistical analysis performed (ANOVA and Tukey Rank Mean). ΔΔCt values were then calculated and used to determine fold-change in expression. n=4. B. Immunohistochemistry for involucrin in STR.M or STR.M.Math1 cells cultured under 3D organotypic conditions. C. Immunohistochemistry for filaggrin in STR.M or STR.M.Math1 cells cultured under 3D organotypic conditions. D. Immunohistochemistry for stem cell marker p63 in normal mouse esophagus. E. p63 expression by immunohistochemistry in STR.M or STR.M.Math1 cells cultured under 3D organotypic conditions.
We next looked for evidence that Math1 induced intestinal and Barrett’s associated genes. We stained the organotypic culture sections with Alcian blue to identify production of intestinal mucins and goblet cells but did not observe any significant staining in the STR.M.Math1 or control cultures suggesting there was no accumulation of intestinal mucins (data not shown). To further explore gene expression patterns with ectopic Math1 expression, we screened mRNA expression levels for a custom panel of 45 genes using a QPCR array (Applied Biosystems) (Supplementary Table S2). The genes selected for the panel are recognized as markers associated with keratinocyte differentiation, Barrett’s esophagus, or intestinal epithelial cells, and included a number of keratins as well as mucins. In addition, several were known Math1 gene targets.
Total RNA was isolated from the epithelium of the organotypic cultures of STR.M.Math1 and STR.M control cells and then subjected to the QPCR array screen. We found 16 genes in the STR.M.Math1 cells that were different by 2-fold or more when compared to control STR.M cells, with the majority being induced (Supplementary Table S3). This compares well with our prior studies with organotypic cultures and the gene expression QPCR array [22]. The most significantly induced gene was Alkaline Phosphatase, which is associated with intestinal epithelium and Barrett’s esophagus tissues. Many of the significantly changed genes were keratins, including the Barrett’s associated columnar cell keratins KRT7 and KRT20 [37]. Four mucins were also significantly induced, including Muc2. This is highly significant as we had not yet observed the induction of Muc2 in these human keratinocytes by any of our prior strategies [11,22,23]. The membrane bound mucin Muc3B;Muc3C, as well as Muc13 and Muc15 were also significantly induced. Lastly, we noted that the only Math1 gene target induced by Math1 expression was Muc2; other tested gene targets, including GFI1, were not significantly induced.
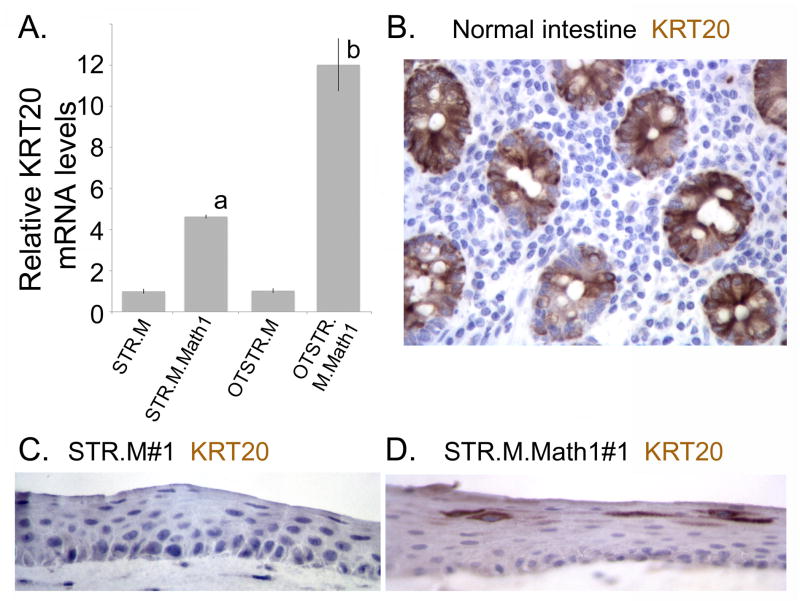
We next confirmed expression of Krt20 and Muc2 mRNA and protein in our organotypically cultured STR.M.Math1 cells, and compared them to conventionally cultured cells. Krt20 mRNA levels are increased 12-fold over control STR.M cells cultured under 2-dimensional conditions (Figure 7A). It is also several-fold increased over the same cells cultured under conventional conditions, suggesting the 3-dimensional environment further enhanced KRT20 expression. This induction was confirmed at the protein level by immunohistochemical staining. Abundant Krt20 protein is detected in the normal intestinal epithelium control and in the STR.M.Math1 cells but not the control STR.M cells (Figures 7B, 7C, and 7D). KRT20 protein was weakly detected in all cells, but scattered cells in the superficial layer expressed KRT20 protein at significantly elevated levels (Figure 7D).
Figure 7. Math1 expression enhances KRT20 mRNA and protein expression in the 3-dimensional organotypic cultures.
A. Quantitative SYBR-green RT-PCR analysis of KRT20 mRNA expression in STR.M or STR.M.Math1 cells cultured under normal 2-dimenational conditions or under 3D organotypic conditions (OTSTR.M and OTSTR.M.Math1). ΔCt values were calculated after duplicate PCRs for each sample, then statistical analysis performed (ANOVA and Tukey Rank Mean). ΔΔCt values were then calculated and used to determine fold-change in expression. n=4. a; significantly differs from STR.M and OTSTR.M cells, p<0.05; b: significantly differs from STR.M, OTSTR.M and STR.M.Math1 cells, p<0.05. B. Immunohistochemistry for KRT20 in normal human intestine. C. KRT20 immunohistochemistry in organotypic cultures of STR.M cells. D. KRT20 immunohistochemistry in organotypic cultures of STR.M.Math1 cells.
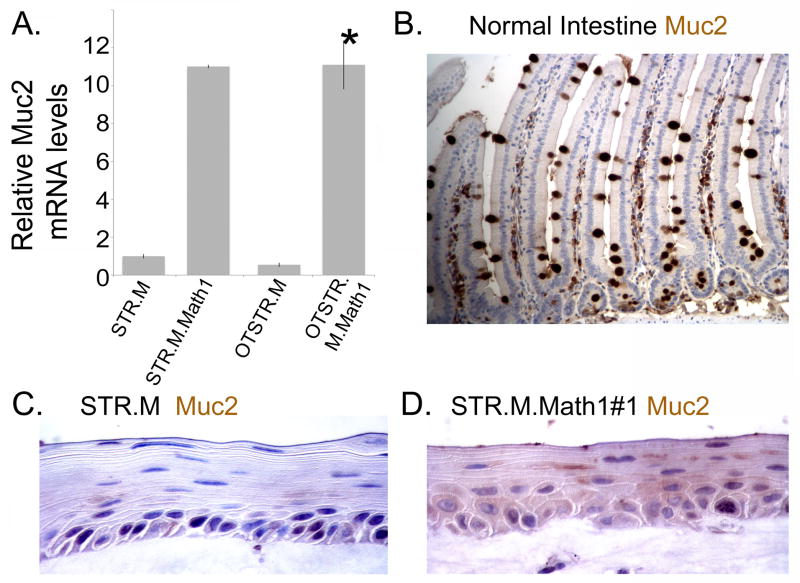
Similarly, we observed a significant increase in Muc2 mRNA and protein in our organotypic STR.M.Math1 cell cultures. There was a significant 11-fold induction of Muc2 mRNA in both 2- and 3-dimensionally cultured STR.M.Math1 cells when compared to controls (Figure 8A). Muc2 protein is detected in the normal intestine control and STR.M.Math1 cell culture but not the STR.M control (Figures 8A, 8B, and 8C). As with KRT20, we observe a few cells with enhanced Muc2 protein expression detected, despite the absence of definitive goblet cells. Together, these findings suggest ectopic expression of Math1 in human esophageal keratinocytes can induce the expression of the Barrett’s esophagus markers KRT20 and Muc2.
Figure 8. Muc2 mRNA and protein are induced by ectopic Math1 expression in the 3-dimensional organotypic cultures of human esophageal STR cells.
A. As before, a quantitative SYBR-green RT-PCR analysis of Muc2 mRNA expression in STR.M or STR.M.Math1 cells cultured under normal 2-dimenational conditions or under 3D organotypic conditions (OTSTR.M and OTSTR.M.Math1). ΔCt values were calculated as before. n=4. *; significantly differs from STR.M and OTSTR.M cells, p<0.05. B. Muc2 immunohistochemistry in normal human intestine. C. Muc2 immunohistochemistry in organotypic cultures of STR.M cells. D. Muc2 immunohistochemistry in organotypic cultures of STR.M.Math1 cells.
DISCUSSION
Barrett’s esophagus is an important clinical condition because individuals with BE have an increased risk for neoplastic progression, estimated to be 0.5 to 1% per year across several studies [38]. Presently, our ability to understand the mechanisms contributing to the pathogenesis of BE and its progression to esophageal adenocarcinoma is severely limited by the shortage of research models. This study was initiated to extend earlier work by us seeking to model BE pathogenesis using an in vitro cell culture system [11,22,23]. In these studies we observed that ectopic expression of different transcription factors, an intracellular signaling molecule, or an inflammation modulator could promote a more intestinalized pattern of gene expression in the human esophageal STR keratinocytes. However, in none of these studies did we observe the induction of genes utilized as classic histologic markers for Barrett’s esophagus, Keratin-20 and Mucin-2. In the present study we demonstrate that ectopic expression of Math1 is sufficient to induce the expression of these important Barrett’s associated genes in a human esophageal keratinocyte cell line.
Math1/Atoh1 is expressed in Barrett’s esophagus and can be ectopically expressed in human esophageal keratinocytes
Math1/Atoh1 is a helix-loop-helix transcription factor required for the development and differentiation of secretory lineages in the intestine, including enteroendocrine, goblet, and Paneth cells [17]. Math1/Atoh1 gene expression is regulated by two opposing developmental factors; Cdx2 and Notch. The Math1/Atoh1 gene is a known transcriptional target of Cdx2, and its expression is enhanced by Cdx2 activity [39]. In contrast, Notch, an important regulator of embryonic development and cell differentiation, negatively regulates Math1/Atoh gene expression. Like the Wnt pathway, Notch is a cell-surface receptor whose activation results in altered gene expression patterns in the nucleus [40]. The Notch receptor receives lateral-inhibitory signals from adjacent, Delta-ligand bearing cells. Notch transduces this signal, ultimately leading to alterations in gene expression patterns and the inhibition of certain cell fates. In the intestine, Notch signaling inhibits the selection of the secretory cell fate [41]. In contrast, when Notch is inhibited, excessive numbers of secretory cells are produced, especially goblet cells [41,42,43,44].
Little is presently known about the role played by Math1/Atoh gene expression and Notch signaling in the pathogenesis of Barrett’s esophagus, which was a motivation for this study. Given the known role of these factors in intestinal development, it is suspected they perform a similar function in the pathogenesis of Barrett’s esophagus, where the induction of the secretory cell fate—mucin producing goblet cells is—observed. This is supported by several published observations. Increased Notch signaling has been associated with normal squamous cell differentiation [22,45] and with human esophageal adenocarcinomas [46], however diminished or pharmacologically inhibited Notch activity was associated with increased goblet cell numbers and the expression of goblet-cell associated gene products in several BE model systems [47,48,49].
It was therefore expected by us that Math1/Atoh expression would be detected in Barrett’s esophagus. However, while this is not the first report for Math1/Atoh expression in human BE biopsy specimens [50], it is the first to find that expression falls into two levels, elevated 10–30 fold, and highly elevated over 1000-fold. While we did not have tissue sections matched to the RNA samples, we speculate that the HATH1 mRNA levels may correlate with goblet cell numbers. It is known that the number of goblet cells in BE biopsy specimens can vary considerably, however recent data suggest BE with or without goblet cells has a similar likelihood of progression to dysplasia and cancer [51]. We are interested pursuing this correlation of HATH1 mRNA and protein levels with the frequency with which goblet cells are observed in BE tissues in future studies.
One other unexpected finding was the relative ease with which we established Math1 expression in the human esophageal keratinocytes STR cells. Expression of Math1 significantly reduced STR cell proliferation, however this was not associated with a loss of Math1 expression as had been observed in the past when we expressed the intestine-specific transcription factor Cdx2 [11]. In fact, Cdx2 expression could not be maintained unless it was rescued by coexpressing cyclin D1 to drive cell proliferation. In contrast, while Math1 reduced STR cell proliferation by more than 50%, there was no loss of retrovirus-mediated Math1 expression. We cannot explain this striking difference except to postulate that Math1 does not reduce the proliferative rate as significantly as Cdx2, or that the antiproliferative mechanism is different and without the same selective pressure to silence expression. We are presently considering experimental approaches to explore these possibilities in future studies.
Ectopic Math1/Atoh1 expression is sufficient to induce the important BE histologic markers Keratin-20 and Mucin-2 in human esophageal keratinocytes
To our knowledge, this is the first demonstration of a single, intestine-associated transcription factor inducing mRNA and protein expression of the important Barrett’s esophagus markers Keratin-20 and Mucin-2. We have employed several strategies in the past to induce intestinalization in our immortalized STR cells. Cdx2/cyclin D1 co-expression, and Cdx1/c-Myc co-expression, or Cox2 or Wnt-signaling single expression experiments all achieved a degree of intestinalization, particularly when cultured under organotypic culture conditions [11,22,23]. Cox2 activity and Cdx1/c-Myc co-expression studies also induced significant intestinal mucin production and alcian-blue staining mucin collections, however neither strategy successfully induce Mucin-2 production. Others have succeeded in inducing Muc-2 expression using a number of reagents including retinoic acid [52] or a combination of Cdx2 gene expression and DNA methyltransferase inhibitors [48], but none have succeeded using a single genetic factor as we have here.
While we did not succeed in inducing true goblet cells as we had hoped, the results from this study do provide encouragement for future progress in this area. Combining the expression from several transcription factors my yield more significant changes than each would individually. For instance, Cox2 expression alone gave rise to polarized, intestinal mucin-secreting cells but not overt goblet cells and no Muc2 expression [22]. Introducing Math1/Atoh1 expression along with Cox2 we anticipate will yield a more intestinalized phenotype that may include progression to goblet cells. We are pursuing this line of investigation in our current studies.
In conclusion, in vitro modeling of BE pathogenesis can be improved by the inclusion of strategies to enhance Math1/Atoh1 gene expression. Math1 expression is sufficient to induce Mucin-2 and Keratin-20 protein expression in human esophageal keratinocytes. Combining Math1 with other intestine-specific transcription factors or inflammation promoters should be very effective at improving the in vitro models. Once refined, these cell culture based models would serve as the rational basis to pursue the development of appropriate transgenic mouse models and provide a platform for testing novel diagnostic and therapeutic agents.
Supplementary Material
Acknowledgments
This work was supported by an NCI Program Project PO1 CA098101 and the Morphology, Cell Culture, and Molecular Biology Core Facilities of the Center for Molecular Studies in Digestive and Liver Disease at the University of Pennsylvania (P30-DK50306 and PO1 CA098101). We thank Dr. Gary Swain for his immunohistochemical and microscopy expertise.
References
- 1.Stairs DB, Kong J, Lynch JP. Cdx genes, inflammation, and the pathogenesis of intestinal metaplasia. Progress in Molecular Biology and Translational Science. 2010;96:231–270. doi: 10.1016/B978-0-12-381280-3.00010-5. [DOI] [PMC free article] [PubMed] [Google Scholar]
- 2.Paull A, Trier JS, Dalton MD, Camp RC, et al. The histologic spectrum of Barrett’s esophagus. N Engl J Med. 1976;295:476–480. doi: 10.1056/NEJM197608262950904. [DOI] [PubMed] [Google Scholar]
- 3.Leung WK, Sung JJ. Review article: intestinal metaplasia and gastric carcinogenesis. Aliment Pharmacol Ther. 2002;16:1209–1216. doi: 10.1046/j.1365-2036.2002.01300.x. [DOI] [PubMed] [Google Scholar]
- 4.Riddell RH, Odze RD. Definition of Barrett’s esophagus: time for a rethink--is intestinal metaplasia dead? Am J Gastroenterol. 2009;104:2588–2594. doi: 10.1038/ajg.2009.390. [DOI] [PubMed] [Google Scholar]
- 5.Izzo JG, Luthra R, Wu TT, Correa AM, et al. Molecular mechanisms in Barrett’s metaplasia and its progression. Semin Oncol. 2007;34:S2–6. doi: 10.1053/j.seminoncol.2007.01.005. [DOI] [PubMed] [Google Scholar]
- 6.Correa P, Piazuelo MB, Wilson KT. Pathology of gastric intestinal metaplasia: clinical implications. Am J Gastroenterol. 105:493–498. doi: 10.1038/ajg.2009.728. [DOI] [PMC free article] [PubMed] [Google Scholar]
- 7.Sepulveda AR, Lynch JP. Chronic Inflammation and Genetic Instability in Gastrointestinal Cancers. In: Thomas-Tikhonenko A, editor. Cancer Genome and Tumor Microenvironment. New York: Springer; 2010. pp. 351–398. [Google Scholar]
- 8.McQuaid KR, Laine L, Fennerty MB, Souza R, Spechler SJ. Systematic review: the role of bile acids in the pathogenesis of gastro-oesophageal reflux disease and related neoplasia. Aliment Pharmacol Ther. 2011 doi: 10.1111/j.1365-2036.2011.04709.x. [DOI] [PubMed] [Google Scholar]
- 9.Souza RF, Krishnan K, Spechler SJ. Acid, bile, and CDX: the ABCs of making Barrett’s metaplasia. Am J Physiol Gastrointest Liver Physiol. 2008;295:G211–218. doi: 10.1152/ajpgi.90250.2008. [DOI] [PubMed] [Google Scholar]
- 10.Huo X, Zhang HY, Zhang XI, Lynch JP, et al. Acid and Bile Salt-Induced CDX2 Expression Differs in Esophageal Squamous Cells From Patients With and Without Barrett’s Esophagus. Gastroenterology. 2010;139:194–203. doi: 10.1053/j.gastro.2010.03.035. [DOI] [PMC free article] [PubMed] [Google Scholar]
- 11.Kong J, Nakagawa H, Isariyawongse B, Funakoshi S, et al. Induction of Intestinalization in Human Esophageal Keratinocytes is a Multi-step Process. Carcinogenesis. 2009;30:122–130. doi: 10.1093/carcin/bgn227. [DOI] [PMC free article] [PubMed] [Google Scholar]
- 12.Kong J, Crissey MA, Funakoshi S, Kreindler JL, Lynch JP. Ectopic Cdx2 Expression in Murine Esophagus Models an Intermediate Stage in the Emergence of Barrett’s Esophagus. PLoS ONE. 2011;6:e18280. doi: 10.1371/journal.pone.0018280. [DOI] [PMC free article] [PubMed] [Google Scholar]
- 13.Wang DH, Clemons NJ, Miyashita T, Dupuy AJ, et al. Aberrant epithelial-mesenchymal Hedgehog signaling characterizes Barrett’s metaplasia. Gastroenterology. 2010;138:1810–1822. doi: 10.1053/j.gastro.2010.01.048. [DOI] [PMC free article] [PubMed] [Google Scholar]
- 14.Wang X, Ouyang H, Yamamoto Y, Kumar PA, et al. Residual Embryonic Cells as Precursors of a Barrett’s-like Metaplasia. Cell. 2011;145:1023–1035. doi: 10.1016/j.cell.2011.05.026. [DOI] [PMC free article] [PubMed] [Google Scholar]
- 15.Hoshino M. Molecular machinery governing GABAergic neuron specification in the cerebellum. Cerebellum. 2006;5:193–198. doi: 10.1080/14734220600589202. [DOI] [PubMed] [Google Scholar]
- 16.Bryant J, Goodyear RJ, Richardson GP. Sensory organ development in the inner ear: molecular and cellular mechanisms. Br Med Bull. 2002;63:39–57. doi: 10.1093/bmb/63.1.39. [DOI] [PubMed] [Google Scholar]
- 17.Yang Q, Bermingham NA, Finegold MJ, Zoghbi HY. Requirement of Math1 for secretory cell lineage commitment in the mouse intestine. Science. 2001;294:2155–2158. doi: 10.1126/science.1065718. [DOI] [PubMed] [Google Scholar]
- 18.Leow CC, Romero MS, Ross S, Polakis P, Gao WQ. Hath1, down-regulated in colon adenocarcinomas, inhibits proliferation and tumorigenesis of colon cancer cells. Cancer Res. 2004;64:6050–6057. doi: 10.1158/0008-5472.CAN-04-0290. [DOI] [PubMed] [Google Scholar]
- 19.Bossuyt W, Kazanjian A, De Geest N, Van Kelst S, et al. Atonal homolog 1 is a tumor suppressor gene. PLoS Biol. 2009;7:e39. doi: 10.1371/journal.pbio.1000039. [DOI] [PMC free article] [PubMed] [Google Scholar]
- 20.Wang J, Qin R, Ma Y, Wu H, et al. Differential gene expression in normal esophagus and Barrett’s esophagus. J Gastroenterol. 2009;44:897–911. doi: 10.1007/s00535-009-0082-2. [DOI] [PMC free article] [PubMed] [Google Scholar]
- 21.VanDussen KL, Samuelson LC. Mouse atonal homolog 1 directs intestinal progenitors to secretory cell rather than absorptive cell fate. Dev Biol. 2010;346:215–223. doi: 10.1016/j.ydbio.2010.07.026. [DOI] [PMC free article] [PubMed] [Google Scholar]
- 22.Kong J, Crissey MA, Stairs DB, Sepulveda AR, Lynch JP. Cox2 and β-catenin/TCF signaling intestinalize human esophageal keratinocytes when cultured under organotypic conditions. Neoplasia. 2011 doi: 10.1593/neo.11788. In Press. [DOI] [PMC free article] [PubMed] [Google Scholar]
- 23.Stairs DB, Nakagawa H, Klein-Szanto A, Mitchell SD, et al. Cdx1 and c-Myc foster the initiation of transdifferentiation of the normal esophageal squamous epithelium toward Barrett’s esophagus. PLoS ONE. 2008;3:e3534. doi: 10.1371/journal.pone.0003534. [DOI] [PMC free article] [PubMed] [Google Scholar]
- 24.Kong J, Stairs DB, Lynch JP. Modeling Barrett’s Esophagus. Biochemical Society Transactions. 2010;38:321–326. doi: 10.1042/BST0380321. [DOI] [PubMed] [Google Scholar]
- 25.Harada H, Nakagawa H, Oyama K, Takaoka M, et al. Telomerase induces immortalization of human esophageal keratinocytes without p16INK4a inactivation. Mol Cancer Res. 2003;1:729–738. [PubMed] [Google Scholar]
- 26.Okawa T, Michaylira CZ, Kalabis J, Stairs DB, et al. The functional interplay between EGFR overexpression, hTERT activation, and p53 mutation in esophageal epithelial cells with activation of stromal fibroblasts induces tumor development, invasion, and differentiation. Genes Dev. 2007;21:2788–2803. doi: 10.1101/gad.1544507. [DOI] [PMC free article] [PubMed] [Google Scholar]
- 27.Keller MS, Ezaki T, Guo RJ, Lynch JP. Cdx1 or Cdx2 Expression Activates E-Cadherin-mediated Cell-cell Adhesion and Compaction in Human Colo 205 cells. Am J Physiol Gastrointest Liver Physiol. 2004;287:G104–114. doi: 10.1152/ajpgi.00484.2003. [DOI] [PubMed] [Google Scholar]
- 28.Winer J, Jung CK, Shackel I, Williams PM. Development and validation of real-time quantitative reverse transcriptase-polymerase chain reaction for monitoring gene expression in cardiac myocytes in vitro. Anal Biochem. 1999;270:41–49. doi: 10.1006/abio.1999.4085. [DOI] [PubMed] [Google Scholar]
- 29.Lynch J, Suh ER, Silberg DG, Rulyak S, et al. The caudal-related homeodomain protein Cdx1 inhibits proliferation of intestinal epithelial cells by down-regulation of D-type cyclins. J Biol Chem. 2000;275:4499–4506. doi: 10.1074/jbc.275.6.4499. [DOI] [PubMed] [Google Scholar]
- 30.Crissey MA, Guo RJ, Funakoshi S, Kong J, et al. Cdx2 levels modulate intestinal epithelium maturity and Paneth cell development. Gastroenterology. 2011;140:517–528 e518. doi: 10.1053/j.gastro.2010.11.033. [DOI] [PMC free article] [PubMed] [Google Scholar]
- 31.Eda A, Osawa H, Satoh K, Yanaka I, et al. Aberrant expression of CDX2 in Barrett’s epithelium and inflammatory esophageal mucosa. J Gastroenterol. 2003;38:14–22. doi: 10.1007/s005350300001. [DOI] [PubMed] [Google Scholar]
- 32.Moons LM, Bax DA, Kuipers EJ, Van Dekken H, et al. The homeodomain protein CDX2 is an early marker of Barrett’s oesophagus. J Clin Pathol. 2004;57:1063–1068. doi: 10.1136/jcp.2003.015727. [DOI] [PMC free article] [PubMed] [Google Scholar]
- 33.Lynch JP, Lichtenstein GR. Cyclooxygenase activity in Gastrointestinal cancer Development and Progression—Prospects as a Therapeutic Target. In: Morgan D, Fossman U, Nakaqda M, editors. Cancer and Inflammation. Basel: Birkhauser Verlag Basel; 2004. pp. 147–176. [Google Scholar]
- 34.Silberg DG, Sullivan J, Kang E, Swain GP, et al. Cdx2 ectopic expression induces gastric intestinal metaplasia in transgenic mice. Gastroenterology. 2002;122:689–696. doi: 10.1053/gast.2002.31902. [DOI] [PubMed] [Google Scholar]
- 35.Mutoh H, Hakamata Y, Sato K, Eda A, et al. Conversion of gastric mucosa to intestinal metaplasia in Cdx2-expressing transgenic mice. Biochem Biophys Res Commun. 2002;294:470–479. doi: 10.1016/S0006-291X(02)00480-1. [DOI] [PubMed] [Google Scholar]
- 36.Ezaki T, Guo RJ, Li H, Reynolds AB, Lynch JP. The homeodomain transcription factors Cdx1 and Cdx2 induce E-cadherin adhesion activity by reducing beta- and p120-catenin tyrosine phosphorylation. Am J Physiol Gastrointest Liver Physiol. 2007;293:G54–65. doi: 10.1152/ajpgi.00533.2006. [DOI] [PubMed] [Google Scholar]
- 37.Glickman JN, Chen YY, Wang HH, Antonioli DA, Odze RD. Phenotypic characteristics of a distinctive multilayered epithelium suggests that it is a precursor in the development of Barrett’s esophagus. Am J Surg Pathol. 2001;25:569–578. doi: 10.1097/00000478-200105000-00002. [DOI] [PubMed] [Google Scholar]
- 38.Paulson TG, Reid BJ. Focus on Barrett’s esophagus and esophageal adenocarcinoma. Cancer Cell. 2004;6:11–16. doi: 10.1016/j.ccr.2004.06.021. [DOI] [PubMed] [Google Scholar]
- 39.Mutoh H, Sakamoto H, Hayakawa H, Arao Y, et al. The intestine-specific homeobox gene Cdx2 induces expression of the basic helix-loop-helix transcription factor Math1. Differentiation. 2006;74:313–321. doi: 10.1111/j.1432-0436.2006.00074.x. [DOI] [PubMed] [Google Scholar]
- 40.Tepass U, Godt D, Winklbauer R. Cell sorting in animal development: signalling and adhesive mechanisms in the formation of tissue boundaries. Curr Opin Genet Dev. 2002;12:572–582. doi: 10.1016/s0959-437x(02)00342-8. [DOI] [PubMed] [Google Scholar]
- 41.Fre S, Huyghe M, Mourikis P, Robine S, et al. Notch signals control the fate of immature progenitor cells in the intestine. Nature. 2005;435:964–968. doi: 10.1038/nature03589. [DOI] [PubMed] [Google Scholar]
- 42.van Es JH, van Gijn ME, Riccio O, van den Born M, et al. Notch/gamma-secretase inhibition turns proliferative cells in intestinal crypts and adenomas into goblet cells. Nature. 2005;435:959–963. doi: 10.1038/nature03659. [DOI] [PubMed] [Google Scholar]
- 43.Wong GT, Manfra D, Poulet FM, Zhang Q, et al. Chronic treatment with the gamma-secretase inhibitor LY-411,575 inhibits beta-amyloid peptide production and alters lymphopoiesis and intestinal cell differentiation. J Biol Chem. 2004;279:12876–12882. doi: 10.1074/jbc.M311652200. [DOI] [PubMed] [Google Scholar]
- 44.Milano J, McKay J, Dagenais C, Foster-Brown L, et al. Modulation of notch processing by gamma-secretase inhibitors causes intestinal goblet cell metaplasia and induction of genes known to specify gut secretory lineage differentiation. Toxicol Sci. 2004;82:341–358. doi: 10.1093/toxsci/kfh254. [DOI] [PubMed] [Google Scholar]
- 45.Ohashi S, Natsuizaka M, Yashiro-Ohtani Y, Kalman RA, et al. NOTCH1 and NOTCH3 coordinate esophageal squamous differentiation through a CSL-dependent transcriptional network. Gastroenterology. 2010;139:2113–2123. doi: 10.1053/j.gastro.2010.08.040. [DOI] [PMC free article] [PubMed] [Google Scholar]
- 46.Mendelson J, Song S, Li Y, Maru DM, et al. Dysfunctional transforming growth factor-beta signaling with constitutively active Notch signaling in Barrett’s esophageal adenocarcinoma. Cancer. 2011;117:3691–3702. doi: 10.1002/cncr.25861. [DOI] [PMC free article] [PubMed] [Google Scholar]
- 47.Menke V, van Es JH, de Lau W, van den Born M, et al. Conversion of metaplastic Barrett’s epithelium into post-mitotic goblet cells by gamma-secretase inhibition. Dis Model Mech. 2010;3:104–110. doi: 10.1242/dmm.003012. [DOI] [PubMed] [Google Scholar]
- 48.Liu T, Zhang X, So CK, Wang S, et al. Regulation of Cdx2 expression by promoter methylation, and effects of Cdx2 transfection on morphology and gene expression of human esophageal epithelial cells. Carcinogenesis. 2007;28(2):488–496. doi: 10.1093/carcin/bgl176. [DOI] [PubMed] [Google Scholar]
- 49.Morrow DJ, Avissar NE, Toia L, Redmond EM, et al. Pathogenesis of Barrett’s esophagus: bile acids inhibit the Notch signaling pathway with induction of CDX2 gene expression in human esophageal cells. Surgery. 2009;146:714–721. doi: 10.1016/j.surg.2009.06.050. discussion 721-712. [DOI] [PMC free article] [PubMed] [Google Scholar]
- 50.Chen X, Qin R, Liu B, Ma Y, et al. Multilayered epithelium in a rat model and human Barrett’s esophagus: similar expression patterns of transcription factors and differentiation markers. BMC Gastroenterol. 2008;8:1. doi: 10.1186/1471-230X-8-1. [DOI] [PMC free article] [PubMed] [Google Scholar]
- 51.Vieth M, Barr H. Editorial: Defining a bad Barrett’s segment: is it dependent on goblet cells? Am J Gastroenterol. 2009;104:825–827. doi: 10.1038/ajg.2009.90. [DOI] [PubMed] [Google Scholar]
- 52.Cooke G, Blanco-Fernandez A, Seery JP. The effect of retinoic acid and deoxycholic acid on the differentiation of primary human esophageal keratinocytes. Dig Dis Sci. 2008;53:2851–2857. doi: 10.1007/s10620-008-0240-z. [DOI] [PubMed] [Google Scholar]
Associated Data
This section collects any data citations, data availability statements, or supplementary materials included in this article.


