

Abstract
A population pharmacokinetic–pharmacodynamic–disease progression (PK/PD/DIS) model was developed to characterize the effects of anakinra in collagen-induced arthritic (CIA) rats and explore the role of interleukin-1β (IL-1β) in rheumatoid arthritis. The CIA rats received either vehicle, or anakinra at 100 mg/kg for about 33 h, 100 mg/kg for about 188 h, or 10 mg/kg for about 188 h by subcutaneous infusion. Plasma concentrations of anakinra were assayed by enzyme-linked immunosorbent assay. Swelling of rat hind paws was measured. Population PK/PD/DIS parameters were computed for the various groups using non-linear mixed-effects modeling software (NONMEM® Version VI). The final model was assessed using visual predictive checks and nonparameter stratified bootstrapping. A two-compartment PK model with two sequential absorption processes and linear elimination was used to capture PK profiles of anakinra. A transduction-based feedback model incorporating logistic growth rate captured disease progression and indirect response model I captured drug effects. The PK and paw swelling versus time profiles in CIA rats were fitted well. Anakinra has modest effects (Imax = 0.28) on paw edema in CIA rats. The profiles are well-described by our PK/PD/DIS model which provides a basis for future mechanism-based assessment of anakinra dynamics in rheumatoid arthritis.
Keywords: Anakinra, Pharmacokinetics, Pharmacodynamics, Rheumatoid arthritis, Population model
Introduction
Rheumatoid arthritis (RA) is a chronic, systemic, autoimmune and inflammatory disorder which may lead to crippling disability and premature mortality. It affects about 1% of the population worldwide, and 75% of those afflicted are women [1]. Patients experience severe pain and swelling in the joints leading to erosions of inflamed sites, joint deformity, disability, and reduced life expectancy [2, 3]. Four major types of drugs used to treat RA are: non-steroid anti-inflammatory drugs (NSAID), disease-modifying anti-rheumatic drugs (DMARD), biologic agents, and corticosteroids. However, a ‘cure’ or a treatment-free remission remains an elusive goal and significant inter-individual differences in therapy outcomes occur. The pathogenesis of RA remains unclear, which increases the difficulties in selection of drug therapy and for drug development [4, 5]. On the other hand, RA has become a prototype for the application of knowledge of molecular pathogenesis for development of new treatments, especially for biological agents, which offers a good opportunity to investigate disease progression using these as probe agents.
Parallel advances in research on the pathogenesis of RA and cytokine biology converged on TNF-α and IL-1β as key factors in joint pathology. TNF-α is implicated in inflammation with diverse systemic effects, whereas IL-1β is thought to play an important role in joint destruction [6, 7]. This cytokine is mainly secreted from macrophages and is present in the synovial tissue and fluids of RA patients. After binding with IL-1 receptor I and IL-1 receptor accessory protein to form a ternary complex, two major signaling pathways are activated: the mitogen activated protein kinase pathway and the NFκB pathway. Both signals induce the synthesis of PGE2, cytokines, chemokines, and matrix metalloproteinases, which are responsible for articular inflammation and cartilage breakdown [7–9].
Three drugs targeting IL-1β are approved to treat inflammation-related diseases: anakinra, rilonacept, and canakinumab [10]. Anakinra is an N-terminal-methionylated, non-glycosylated version of human IL-1 receptor antagonist (IL-Ra), which competitively blocks the actions of IL-1 without any detectable agonist activity. It contains 153 amino acids and has a molecular weight of 17.3 kDa. Compared to anti-TNFα drugs, anakinra modestly improves RA symptoms without major adverse infectious events [11]. Anakinra also has been used in treatment of adult onset Still’s disease, systemic onset juvenile idiopathic arthritis, osteoarthritis, and type 2 diabetes [9]. Despite some reports concerning anakinra effects in patients with autoimmune and inflammatory diseases, limited information is available regarding the complete time profile of dynamic changes, interactions between cytokines, in vivo systemic effects, and its mechanisms in these diseases. This is of special importance because of the nature of RA as a chronic progressive disease and possibilities of multiple therapeutic interventions.
Collagen-induced arthritis (CIA) is an animal disease model which closely resembles several aspects of RA. It offers the most obvious success for cytokine inhibitors [12, 13]. PK/PD/DIS modeling can quantitively interpret disease progression and assess drug effects in a mechanistic manner [14–16]. We utilized the CIA rat model to investigate the effects of dexamethasone and developed a mechanistic small systems model that reflects the complexities among the important cytokine mediators and their influences on disease endpoints [17, 18]. However, dexamethasone affects several key mediators in RA. Our goal is to advance PK/PD/DIS modeling to describe the role of IL-1β on disease endpoints in CIA rats to better understand the pharmacology of anakinra and the role of IL-1β in RA pathogenesis. We sought inter-individual variability of model parameters using a population method.
Methods
Drug
Anakinra (100 mg/0.67 mL/syringe) was manufactured by Amgen Inc. (Thousand Oaks, CA). Anakinra was diluted with injection solution (pH 6.5) composed of: 1.9 mg/mL sodium citrate, 8.2 mg/mL sodium chloride, 0.18 mg/mL disodium EDTA, and 1.0 mg/mL polysorbate. This diluted solution was stored at 2–8°C before use.
Animals
Thirty-eight male Lewis rats, aged 6–9 weeks, were purchased from Harlan (Indianapolis, IN), weight-matched to approximately 150 g. Animals were housed individually in the University Laboratory Animal Facility and acclimatized for 1 week under constant temperature (22°C), humidity (72%), and 12-h light/12-h dark cycle. Rats had free access to rat chow and water. All protocols followed the Principles of Laboratory Animal Care (Institute of Laboratory Animal Resources, 1996) and were approved by the University at Buffalo Institutional Animal Care and Use Committee.
Induction of collagen-induced arthritis
The induction of collagen-induced arthritis in Lewis rats followed protocols and reagents supplied by Chondrex, Inc. (Redmond, WA). Porcine collagen type II (2 mg/mL) in 0.05 M acetic acid was emulsified with incomplete Freund’s adjuvant (Sigma-Aldrich, St. Louis, MO) following procedures described in our earlier study [18].
Experimental design
To obtain intensive PK profiles of anakinra in rats, a pilot study was conducted in two healthy rats. They received a subcutaneous (SC) infusion of 20 mg/kg of anakinra for 1 week by implanting Alzet osmotic pumps (Durect Corporation, Cupertino, CA) between the shoulder blades allowing a continuous infusion until depletion of drug in pumps. Mini-pumps were implanted at 0 h and were removed at 168 h. Blood samples were collected from the saphenous vein at 0.5, 1, 1.5, 3, 6, 12, 24, 72, 120, 144, 168, 168.5, 169, 170, 171, 173, 176, 180, and 192 h post-dose.
After evaluation of paw edema induction on day 20, 24 CIA rats with paw size increases of at least 50% in one or two paws were selected and randomly assigned to four groups. Each group received either injection solution (Group 1) for short term (≈33 h, n = 3) or long term (≈188 h, n = 3), 100 mg/kg for short-term (≈33 h, Group 2, n = 6), 100 mg/kg for long-term (≈ 188 h, Group 3, n = 6), or 10 mg/kg for long-term (≈188 h, Group 4, n = 6) of anakinra. Dosing started from day 21 post-induction. Serial blood samples were collected at post-dose 3, 8, 28, and 48 h in short-term groups (3 control animals and Group 2) as well as at post-dose 3, 8, 24, 48, 96, 168, 180, 192, and 204 h in long-term groups (3 control animals, Group 3, and Group 4). Blood samples were centrifuged at 2,000g for 10 min at 4°C. Plasma samples were immediately transferred into siliconized tubes on ice and stored at −80°C.
Measurement of edema and body weight
Edema was assessed by size of the rat hind paws [18]. Two cross-sectional areas were determined with digital calipers (VWR Scientific, Rochester, NY), one area on the rat forefoot (paw) and the other at the ankle. Two measurements were made on each section, perpendicular to each other, to define the length and height of the ellipse from which the area was determined. Measurements were made side-to-side and top-to-bottom across the paw at the base of the last food pad. Ankle measurements were made side-to-side (length a) and front-to-back (length b) at a 45 ° angle across the ankle. The area contained in the ellipse is: Area = π · a/2 · b/2. Edema was indicated by the sum of the paw and ankle area measures for each hind foot. Paw size measurements and body weights were obtained before induction (0 day) and post-induction 3, 7, 12, 15, 17, 19, 21, 22, 23, 25, 27, 29, 31 (only for long-term treatment), 33, and 46 (long-term treatment) or 47 (short-term treatment) days.
ELISA methodology
Anakinra plasma concentrations were measured by an anti-human IL-1ra ELISA kit (R&D Systems, Inc. Minneapolis, MN). Rat plasma samples, along with standard, quality control (QC), and unknown samples, were diluted 100-fold using calibrator diluent buffer before assay; otherwise, procedures followed the manufacturer’s instructions. The standard curve range was 5.0–250 ng/mL and was fitted to a log–log calibration line. Two concentrations of QC samples, 25 and 200 ng/mL, were used to determine accuracy and precision of measurements. Samples with concentrations above the upper standard were further diluted 5–100-fold. The ELISA kit was validated by R&D Systems showing that the method is specific for human IL-1ra (no significant cross-reactivity between human IL-1ra and rat recombinant IL-1α, IL-1β, or IL-1ra), acceptable precision (CV%, inter- and intra-assay precision less than 11%) and accuracy (relative accuracy, mean 86%) [19]. Concentrations below the lower standard were reported as undetectable. Use of this ELISA kit for anakinra has been previously reported [20, 21]. The stabilities of anakinra at 4°C for 3 days and after 100-fold dilution were also confirmed.
Statistical analysis
The PK data was preliminarily analyzed by non-compartmental analysis using Phoenix WinNonlin software (Pharsight Corporation, Cary, NC) to evaluate linearity over the dose range of 10–100 mg/kg and consistency of PK profiles between healthy and CIA rats. The dose-normalized AUC values across different dose levels were compared by analysis of variance (ANOVA) and Student–Newman–Keuls (comparing any two treatment groups) using SPSS software version 17 (IBM SPSS Statistics, Chicago, IL). To test drug effects, the differences in area under paw size-time curve (AUEC) from dosing time to the end of study between control and dosing groups were also tested by ANOVA and Dunnett’s post-hoc test (comparing each treatment to control group) using SPSS.
Population PK/PD/DIS analysis
The PK profiles in healthy and CIA rats were analyzed using a two-compartment model with two sequential absorption processes (zero-order absorption (k0) followed by first-order absorption (ka)) and linear elimination based on the evaluation of PK profiles and literature results (Fig. 1). The equations and initial conditions are
Fig. 1.
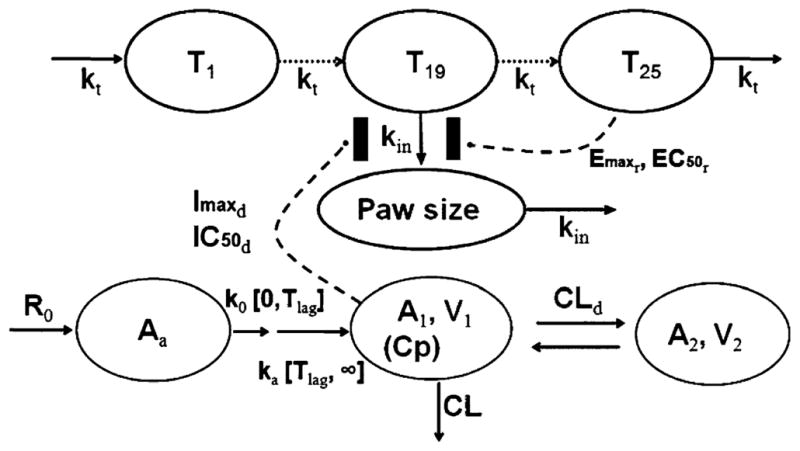
Schematic of the PK/PD/DIS model for the effects of anakinra on paw size and disease progression of RA in CIA rats. Refer to Tables and text for the definitions of parameters
| (1) |
| (2) |
| (3) |
where Aa, A1, and A2 are amounts of drug in the absorption, central and peripheral compartments, CL is elimination clearance, CLd is distribution clearance, V1 and V2 are volumes of the central and peripheral compartments, and Tlag is the duration of k0 or lag time of ka. The plasma concentration (Cp) is A1/V1. Because of limited PK data in the absorption and elimination phases for CIA rats, V1 and V2 were fixed to literature values [22] and fitting results from healthy rat data.
Three different PD models, indirect response model I combined with simple feedback model (model A) [23], feedback model containing natural growth (model B) [24], and transduction-based feedback model (model C, Fig. 1–final model), were tested. In model A, paw size was kept constant before disease onset, after which paw size was driven by a paw size-dependent production rate constant (kin(t)) and first-order loss rate constant (kout). The assumption about constant paw size before disease onset was a test situation. Model B added a zero-order rate constant (kgrowth) to describe natural growth of paw size as well as a modified time-dependent production rate constant (kin(t)) as decreasing exponentially to capture the dramatic increase and natural remission of paw size. Both models estimated paw size at infinite time as either the initial condition or much a lower value. Model C had the best goodness-of-fit and agreement with disease progression mechanism. The equations for the selected model are
| (4) |
| (5) |
| (6) |
| (7) |
where T1, T2,······, Tn (n = 25) are paw size (Paw) in transduction compartments, kt is transduction rate constant, kdis is the ratio of maximum paw size to Paw0 at disease steady-state without remission and drug effects, Imaxd and IC50d are maximum effect of anakinra on paw size and anakinra concentration at 50% of Imaxd, Emaxr and EC50r are maximum effect of natural remission and paw size difference at 50% of Emaxr, kgrowth is natural growth rate constant of paw size in healthy rats, and kin is the transduction rate constant between compartment T19 and Paw.
A sequential population model was developed using nonlinear mixed-effects modeling as implemented in NONMEM (Version VI, Level 1.2; ICON Development Solutions, Ellicott City, MD) interfaced with Wings for NONMEM (WFN Version 600). All fitting procedures were conducted with Windows Server 2003 (R2) with the Intel Visual Fortran Compiler (Version 9.1). Graphical analyses were performed using S-Plus (TIBCO Spotfire, Somerville, MA) software.
All treatment groups were fitted simultaneously. The first-order conditional estimation with interaction method (FOCEI) in NONMEM was used to estimate PK/PD/DIS model parameters. The inter-individual variabilities associated with various PK and PD parameters were evaluated using an exponential model. The residual variability was tested with proportional, additive, and combined proportional and additive models. The most appropriate pharmacostatistical model was selected on the basis of: (1) a low value of the objective function; (2) a low value of intra- and inter-individual variability; (3) good agreement of observed and predicted values (plasma concentration and paw size); (4) low standard error values of estimated PK parameters; and (5) normally distributed weighted inter-individual and residual variability. Both the fixed and random effects were estimated from the final model. The precision of the population estimates was evaluated on the basis of relative standard errors (RSE%). The inter-individual variability was estimated in terms of the coefficient of variance (CV%).
Once the final PK/PD/DIS model was identified, visual predictive checks and stratified non-parametric bootstrapping were used to validate the parameter distribution and confidence of parameters. The parameters estimated from the final model were used to simulate 500 datasets. The 5th and 95th percentiles (prediction intervals) of simulated anakinra plasma concentrations and paw sizes in CIA rats at times corresponding to the observed values were calculated and plotted for comparison with observed values [25, 26]. For stratified non-parametric bootstrapping, 500 datasets were sampled randomly by group from the original dataset followed by fitting using Perl-speaks-NONMEM (PsN, version 3.2.4) [27–29]. The fittings were used to calculate the median and 90% confidence intervals for the model parameters. The percentage of successful convergences for the bootstrap replicates was monitored.
Results
In the CIA rat study, no significant differences were observed in body weight–time profiles across the four treatment groups.
Pharmacokinetics
The ANOVA of dose-normalized AUC values across the three long-term dosing groups showed linearity in the dose range of 10–100 mg/kg and no significant difference in clearance between healthy and CIA rats. Time courses of anakinra plasma concentration in healthy and CIA rats are presented in Fig. 2. Intensive PK profiles in healthy rats indicated that anakinra was absorbed very slowly in the first 2 h post-dosing followed by rapid absorption to steady-state showing an overshoot of plasma concentrations at around 8 h. After removal of mini-pumps, anakinra concentrations declined biexponentially. No significant differences in dose-normalized AUC were observed across the 10, 20, and 100 mg/kg doses, which demonstrated linear elimination and consistency between healthy and CIA rats.
Fig. 2.

Observed PK (a) and PD (b) profiles of anakinra in healthy (HC) and CIA rats
The final estimates are listed in Table 1. The Tlag was fixed as 2 h, which suggests rats need this period to recover from anesthesia. The first-order absorption rate (ka) was estimated to be 0.39 l/h, while k0 was 0.015 mg/h/kg, which indicates that most of the drug was absorbed by a first-order process considering the duration. The steady-state was reached quickly (~12 h) during SC infusion. The distribution clearance (CLd) was estimated to be 4.17 mL/h/kg, which reflects very slow distribution between plasma and tissues. The residual error was estimated to be 44.6% in the proportional error model. The precisions for all parameters in the PK model are less than 50% except for inter-individual variability of CL (122.6%).
Table 1.
Pharmacokinetic parameter estimates for anakinra in healthy and CIA rats
| Parameter (units) | Definition | Estimate of parameters (mean (%RSE)) | Bootstrap of estimates of parameters (median (90%CI)) | IIV (mean (%RSE)) | Bootstrap of IIVs (median, 90%CI) |
|---|---|---|---|---|---|
| ka (1/h) | First-order absorption rate | 0.39 (13.6) | 0.39 (0.34–0.44) | 41.7 (47.6) | 42.4 (22.7–52.8) |
| k0 (mg/h/kg) | Zero-order absorption rate | 0.015 (17.0) | 0.015 (0.011–0.018) | NE | NA |
| CL (mL/h/kg) | Systemic clearance | 649 (4.8) | 647 (620–674) | 10.7 (122.6) | 11.3 (4.2–18.6) |
| V1 (mL/kg) | Central volume | 149 (fixeda) | NA | NE | NA |
| CLd (mL/h/kg) | Distribution clearance | 4.17 (21.9) | 4.09 (3.43–6.46) | NE | NA |
| V2 (mL/kg) | Peripheral volume | 202 (fixedb) | NA | NE | NA |
| Tlag (h) | Lag time for ka | 2.0 (fixedc) | NA | NE | NA |
| ε | Residual error | 44.6 (14.3) | 44.2 (40.0–47.9) | NA | NA |
NA not applicable; NE not estimated
Parameter fixed to values obtained from literature
Parameter fixed to values fitted from healthy rat data
Parameter fixed to experimental observation
Pharmacodynamics and disease progression
Time courses of paw size in CIA rats are displayed in Fig. 2. There was no significant difference in AUEC from day 0 to 21 among the four treatment groups. Significant differences in AUEC from day 21 to the end of study (P < 0.05) were found between control and each of the two long-term dosing groups. No significant difference in AUEC from day 21 to the end of study was observed between short-term dosing and control groups. The time course of paw size in control CIA rats exhibited four characteristics: slow increase from induction to approximately 14 days (long time delay after induction), rapid increase until reaching a peak on day 21, then dropping slowly due to natural remission, and finally reaching a new disease steady-state.
The final estimated parameters for this PD/DIS model (Fig. 1) are listed in Table 2. The kgrowth was fixed as 0.013 mm2/h as reported by Earp et al. [17]. Logistic growth rate constant (kdis) and maximum effect of natural remission (Emaxr) were estimated to be 26.2 and 0.954 with a correlation coefficient of 0.98, which means the two parameters are competing to simultaneously account for the paw size at the new disease steady-state. Paw size at 50% of maximum remission (EC50r) was estimated to be 14.9 mm2, which indicates that feedback inhibition on paw growth is evident after paw size reaches 14.9 mm2 above baseline. Maximum effect of anakinra on paw size (Imaxd) was 0.279 and anakinra concentration at the IC50d was 49.4 ng/mL, which means paw swelling is modestly relieved by anakinra with the potential of a 28% reduction, but sensitive to anakinra. Only inter-individual variability associated with kdis among parameters related to disease steady-state was estimated (7.0%). The inter-individual variabilities associated with Paw0, kt, and kin were very low. Such variability associated with Imaxd was 47.5%, which suggests moderate variability in drug effects in these rats from the same strain. The residual error in a proportional error model was small. No additional correlation between estimation parameters (correlation coefficient > 0.8) was observed except for kdis and Emaxr. Precision of all parameter estimations are less than 50%, which indicates that these parameters were reliably estimated.
Table 2.
Pharmacodynamic/disease parameter estimates for anakinra in CIA rats
| Parameter (units) | Definition | Estimate of parameters (mean (%RSE)) | Bootstrap of estimates of parameters (median (90%CI)) | IIV (mean (%RSE)) | Bootstrap of IIVs (median, 90%CI) |
|---|---|---|---|---|---|
| kdis | Ratio of max. paw size to Paw0 at disease steady-state without remission and drug effects | 26.2 (10.0) | 21.7 (11.6–42.1) | 7.0 (28.0) | 6.9 (5.2–8.5) |
| kt (1/h) | Transduction rate between T1 ~ T25 | 0.0342 (2.6) | 0.0349 (0.0329–0.0370) | 9.6 (38.4) | 8.9 (5.5–11.6) |
| Paw0 (mm2) | Baseline of paw size | 57.1 (1.0) | 57.1 (56.1–58.2) | 5.3 (21.0) | 5.0 (4.3–5.7) |
| kin (1/h) | Transduction rate between T19 and Paw | 0.00610 (7.5) | 0.00672 (0.00488–0.0103) | 16.8 (35.9) | 17.9 (12.0–24.8) |
| kgrowth (mm2/h) | Natural growth of paw size | 0.013 (fixeda) | NA | NE | NA |
| Emaxr | Maximum effect of natural remission | 0.954 (0.5) | 0.944 (0.901–0.970) | NE | NA |
| EC50r (mm2) | Paw size for 50% of Emaxr | 14.9 (5.9) | 15.9 (12.6–21.1) | NE | NA |
| Imaxd | Maximum effect of anakinra on paw size | 0.279 (11.3) | 0.255 (0.142–0.407) | 47.5 (44.2) | 48.9 (26.2–72.5) |
| IC50d (ng/mL) | Anakinra conc. for 50% of Imaxd | 49.4 (12.2) | 39.3 (19.5–434) | NE | NA |
| ε | Residual error | 4.0 (13.3) | 3.9 (3.6–4.3) | NA | NA |
NA not applicable; NE not estimated
Parameter fixed to values obtained from literature
Model evaluation and validation
The performance of the final PK/PD/DIS model fit is depicted in Fig. 3. The scatter plots of population- and individual-predicted concentration and paw size versus observed values showed no major bias, and most weighted residuals lay within an acceptable range (−2 to 2). The bias of a few concentration points was due to failed fitting of the overshoot on the first day after implantation surgery.
Fig. 3.

Diagnostic plots (from top to bottom: PRED versuss OBS (a), IPRED versus OBS (b), WRES versus PRED (c), WRES versus Time (d)) for PK (left panels) and PD/DIS (right panels) profile estimations after SC infusion of anakinra
The PK/PD/DIS data for all treatment groups were simulated to form 500 datasets using the same experimental design and parameter estimates obtained with the FOCEI method. The 5th and 95th percentiles (prediction intervals) of the simulated data were calculated and plotted against the observed concentrations or paw size values as shown in Fig. 4. The model adequately predicted the observed data because the prediction interval included most of the observed anakinra concentrations and paw size values. The nonparametric stratified bootstrapping results fitted from 500 sampling datasets are shown in Tables 1 and 2. Twenty-six runs with minimization terminated and 136 runs with estimates near a boundary were skipped when calculating the bootstrap results. The bootstrap analysis showed the original PK/PD/DIS model for anakinra effects and disease progression to be stable and the estimated parameters to be precise except for the estimate of IC50d, which shows a wide 90% CI.
Fig. 4.

Visual predictive checks for PK (left) and PD (right) estimation by treatment groups after SC infusion of anakinra (circles: observed value; area between dashed lines: 5–95% percentiles; solid line: median; a healthy rats for PK and control CIA rats for PD; b 100 mg/kg × 1 day in CIA rats; c 100 mg/kg × 7 days in CIA rats; d 10 mg/kg × 7 days in CIA rats)
Discussion
Pharmacokinetics
Since its approval in 2001, anakinra has been used for patients with moderate to severe RA, especially those who failed to respond to DMARD [22, 30]. It has proven to be a relatively safe and modestly efficacious biologic therapy for RA [31]. The PK of anakinra has been extensively investigated [20, 21, 32–34]. Anakinra is absorbed rapidly followed by bi-exponential disposition after SC injection in humans [32]. The SC bioavailability was reported as 100% in rats and 95% in humans [21, 22]. Elimination of anakinra occurs mainly through the kidney by glomerular filtration (GFR) and subsequent degradation based on a 3H-labeled study in rats [33]. Its disposition is severely influenced by kidney function in humans [20]. The drug is eliminated rapidly in both rats and humans with an elimination half-life of 4–6 h [22, 32]. No immunogenicity was found in humans and rats after 8-day treatments [34, 35].
In the present study, anakinra was given by SC infusions using mini-pumps to maintain target concentrations because of its short elimination half-life. Protein drugs are mainly absorbed through convective transport by lymph flow and diffusion across blood vessels near the injection site [36]. The former is very sensitive to local movement and activity [37] and the latter contributes minimally to the absorption of anakinra because of few blood vessels around the infusion site between the shoulder blades. Therefore, the slow absorption in the first 2 h may be caused by the reduced lymph flow during anesthesia. After rats awoke, the drug was absorbed quickly with ka = 0.39 1/h with moderate inter-individual variability (41.7%). Similar variability of ka was also observed for three protein drugs after SC doses in humans (from 40 to 53%) [38]. The systemic clearance was estimated to be 649 mL/h/kg with low inter-individual variability (10.7%), which is comparable to rat GFR (312 mL/h/kg) [39]. The rat CL is approximately four times greater than human plasma clearance (150 mL/h/kg), reasonable for inter-species GFR differences.
Pharmacodynamics and disease progression
After being triggered by genetic or environmental factors, a latent phase of years with only immune responses evident first develops in humans followed by the emergence of pathological inflammatory symptoms of RA, such as joint destruction, infections, or osteoporosis [2]. Many cells (T cells, B cells, and macrophages) and their products (cytokines, rheumatoid factors, and chemokines) are involved. This disease progression can be mimicked in a short time frame by the CIA model in rats [12, 13]. In order to describe the long delay before rapid disease worsening, two separate phases with a constant growth rate (zero [23] or kgrow [24]) followed by an inhibitory drug effect have been proposed. The fitting results were adequate, but the assumptions that paw size does not increase in the absence of disease or increases at a constant rate before disease onset were not optimal. These models produced a sudden change of paw size after disease onset. Gamma functions [40] and an empirical biexponential equation [41] have also been utilized to capture the long delay of inflammatory disease. However, in comparison to transduction models, they are less flexible when dose–response relationships, receptor dynamics, and efficiency of the transduction process are factors [42]. A transduction-based model could be used to capture the long delay and rapid increase after disease onset of paw size in a more natural way because it mimics the underlying PD/DIS pathway with a series of signal transduction steps to link these signals to the disease endpoint in the absence of information about key mediators [43]. A recently published model incorporated a positive feedback function (cell growth) and four transduction compartments to capture the rapid increase of paw size after disease onset and the delayed natural remission after the paw size peak in CIA rats [44]. However, this model did not capture the long delay of disease onset and does not yield an accurate natural remission parameter. The assumption that natural remission depends on time rather than the increasing magnitude of paw size is also not mechanistic.
We collected paw size data up to 47 days after induction which allows us to describe the full disease progression and drug effects. The four characteristics of the time frame of paw sizes were well-captured using a transduction-based feedback model with logistic growth rate (Fig. 1). Natural growth in healthy rats was also incorporated. Nineteen transduction compartments (T1–T19) were needed to account for the time delay to sharp increase of paw size and 5 more transduction compartments (T21–T25) were used to account for the time delay of natural remission after disease onset. The number of transduction compartments was determined by trial-and-error. A logistic growth rate constant (kdis) was employed to capture rapid increases in paw size followed by a new disease steady-state, which was also used to describe the IL-1β mRNA time course in CIA rats [17, 18]. Without the natural remission feedback, paw size was estimated to increase by 26.2-fold above baseline. A nonlinear negative feedback linking the paw size difference between baseline and disease was utilized to capture the natural remission. A larger paw size will produce greater feedback, but the negative feedback function cannot obviate the entire paw swelling (0.954 of Emaxr) due to irreversible damage of the paw after collagen induction. In this model, we needed to consider the interaction of the logistic growth rate constant and feedback function. Because of the relationship of disease growth and remission in the present study, kdis was highly correlated with feedback parameters (Emaxr and EC50r).
The drug effects were described by indirect response model I, which has been extensively applied in PK/PD modeling [45, 46] and agrees with the nature of drug action, i.e., inhibition of IL-1β, which is one factor producing paw swelling. A different transduction rate (from T19 to paw size, kin) was needed to fit paw sizes. Anakinra dosing with 100 mg/kg/day for more than 10 days was reported to reduce paw swelling by at least 70% in female CIA rats [47, 48]. In those studies, anakinra was given shortly after disease onset. Both IL-1β and IL-1Ra have a high affinity with IL-1 receptor I. However, approximately 10-fold greater concentrations of IL-1Ra than IL-1β were required to produce 50% inhibition [7, 8]. Our previous CIA rat studies [17, 18] showed that IL-1β mRNA reached a concentration peak on day 21 post-induction with expression about 1,000 times greater than baseline values. The same inhibition effect, dosing at the IL-1β concentration peak (present study), requires much more IL-1Ra than earlier dosing, which partly explains these efficacy differences. The IL-1β plays a critical role in disease progression of RA in both rats and humans; however, RA patients do not show the same positive outcome as CIA rats treated at disease onset. The present CIA rat study demonstrates modest efficacy as do human studies. Timing of drug administration appears to be of considerable importance. The IC50d was estimated to be 49.4 ng/mL, which is comparable to a previous study with an effective concentration of about 200 ng/mL in CIA rats [47]. The mean plasma anakinra concentration at 12 h after SC injection of 2 mg/kg/day anakinra (efficacy dose) in humans was about 70 ng/mL [34], which is also close to the IC50d in our study. However, bootstrap validation results showed a large variance in estimation of IC50d, which indicates its estimation varied across different datasets. It is understandable because all steady-state concentrations in the three dosing groups are much higher than IC50d and only few paw size data were obtained when anakinra plasma concentrations were low.
The PK/PD/DIS data were simultaneously fitted first by a naïve pooling approach using the maximum likelihood algorithm in ADAPT 5 [49]. A proportional error model was used. All parameter estimations were comparable with NONMEM results; however, precisions of several estimates were higher than 50%. Simultaneous PK/PD/DIS modeling is considered to be the gold standard and was also tested with our data [50, 51]. However the estimation was worse than sequential fitting with the objective function value 700 points higher and 440 mL/h/kg as an estimate of CL. This could be caused by the unbalanced amount of data between PK and PD, which causes NONMEM to more highly weight the latter. The PK data in the four groups were thus fitted simultaneously to obtain individual PK parameters, which were then fixed for the PD/DIS modeling. The diagnostic plots (Fig. 3) and validation results (Fig. 4, Tables 1 and 2) showed that the fitting results were acceptable.
Conclusions
A model describing the PK/PD, as well as the disease progression of paw size in CIA rats, was developed. The PK profiles of SC infusions of anakinra were described by a two-compartment model with two sequential absorption processes and linear elimination. The PD/DIS effects of anakinra and disease progression on paw size were characterized by an IDR model (inhibition of production of response) combined with a new transduction-based feedback model incorporating a logistic growth rate constant. One-day dosing of anakinra did not produce a significant decrease of paw size in CIA rats, while long-term dosing with 10 or 100 mg/kg/day doses offered significant but modest effects on paw size. Such effects of anakinra and the substantial inter-individual variability in rats complicated this modeling task. The present PK/PD/DIS model can capture both PK and PD of anakinra in CIA rats reasonably well. It serves as a basis for future studies where additions of biomarkers (such as receptor activator of nuclear factor kappa-B ligand (RANKL), osteoprotegerin (OPG), and PGE2) and other disease endpoints (such as bone mineral density and body temperature) will allow quantitative assessment of the PK/PD/DIS behaviors of cytokine blockers in RA animal models in a more mechanistic manner.
Acknowledgments
This work was supported by the UB Center for Protein Therapeutics, fellowship support for Dr. Liu from Hoffman-La Roche Inc., fellowship support for Ms. Lon from Amgen, Inc., and NIH Grant GM24211.
Contributor Information
Dongyang Liu, Department of Pharmaceutical Sciences, School of Pharmacy and Pharmaceutical Sciences, University at Buffalo, Buffalo, NY 14260, USA.
Hoi-Kei Lon, Department of Pharmaceutical Sciences, School of Pharmacy and Pharmaceutical Sciences, University at Buffalo, Buffalo, NY 14260, USA.
Debra C. DuBois, Department of Biological Sciences, University at Buffalo, Buffalo, NY 14260, USA
Richard R. Almon, Department of Biological Sciences, University at Buffalo, Buffalo, NY 14260, USA
William J. Jusko, Email: wjjusko@buffalo.edu, Department of Pharmaceutical Sciences, School of Pharmacy and Pharmaceutical Sciences, University at Buffalo, Buffalo, NY 14260, USA
References
- 1.Scott DL, Wolfe F, Huizinga TW. Rheumatoid arthritis. Lancet. 2010;376:1094–1108. doi: 10.1016/S0140-6736(10)60826-4. [DOI] [PubMed] [Google Scholar]
- 2.Klareskog L, Catrina AI, Paget S. Rheumatoid arthritis. Lancet. 2009;373:659–672. doi: 10.1016/S0140-6736(09)60008-8. [DOI] [PubMed] [Google Scholar]
- 3.Lipsky PE. Why does rheumatoid arthritis involve the joints. N Engl J Med. 2007;356:2419–2420. doi: 10.1056/NEJMcibr070846. [DOI] [PubMed] [Google Scholar]
- 4.Tracey D, Klareskog L, Sasso EH, Salfeld JG, Tak PP. Tumor necrosis factor antagonist mechanisms of action: a comprehensive review. Pharmacol Ther. 2008;117:244–279. doi: 10.1016/j.pharmthera.2007.10.001. [DOI] [PubMed] [Google Scholar]
- 5.Smolen JS, Aletaha D, Koeller M, Weisman MH, Emery P. New therapies for treatment of rheumatoid arthritis. Lancet. 2007;370:1861–1874. doi: 10.1016/S0140-6736(07)60784-3. [DOI] [PubMed] [Google Scholar]
- 6.Choy EH, Panayi GS. Cytokine pathways and joint inflammation in rheumatoid arthritis. N Engl J Med. 2001;344:907–916. doi: 10.1056/NEJM200103223441207. [DOI] [PubMed] [Google Scholar]
- 7.Dinarello CA. Interleukin-1 in the pathogenesis and treatment of inflammatory diseases. Blood. 2011;117:3720–3732. doi: 10.1182/blood-2010-07-273417. [DOI] [PMC free article] [PubMed] [Google Scholar]
- 8.Jacques C, Gosset M, Berenbaum F, Gabay C. The role of IL-1 and IL-1Ra in joint inflammation and cartilage degradation. Vitam Horm. 2006;74:371–403. doi: 10.1016/S0083-6729(06)74016-X. [DOI] [PubMed] [Google Scholar]
- 9.Dinarello CA. A clinical perspective of IL-1beta as the gatekeeper of inflammation. Eur J Immunol. 2011;41:1203–1217. doi: 10.1002/eji.201141550. [DOI] [PubMed] [Google Scholar]
- 10.Molto A, Olive A. Anti-IL-1 molecules: new comers and new indications. Joint Bone Spine. 2010;77:102–107. doi: 10.1016/j.jbspin.2009.10.011. [DOI] [PubMed] [Google Scholar]
- 11.Cohen SB, Moreland LW, Cush JJ, Greenwald MW, Block S, Shergy WJ, Hanrahan PS, Kraishi MM, Patel A, Sun G, Bear MB. A multicentre, double blind, randomised, placebo controlled trial of anakinra (Kineret), a recombinant interleukin 1 receptor antagonist, in patients with rheumatoid arthritis treated with background methotrexate. Ann Rheum Dis. 2004;63:1062–1068. doi: 10.1136/ard.2003.016014. [DOI] [PMC free article] [PubMed] [Google Scholar]
- 12.Wooley PH. The usefulness and the limitations of animal models in identifying targets for therapy in arthritis. Best Pract Res Clin Rheumatol. 2004;18:47–58. doi: 10.1016/j.berh.2003.09.007. [DOI] [PubMed] [Google Scholar]
- 13.Hegen M, Keith JC, Jr, Collins M, Nickerson-Nutter CL. Utility of animal models for identification of potential therapeutics for rheumatoid arthritis. Ann Rheum Dis. 2008;67:1505–1515. doi: 10.1136/ard.2007.076430. [DOI] [PubMed] [Google Scholar]
- 14.Lalonde RL, Kowalski KG, Hutmacher MM, Ewy W, Nichols DJ, Milligan PA, Corrigan BW, Lockwood PA, Marshall SA, Benincosa LJ, Tensfeldt TG, Parivar K, Amantea M, Glue P, Koide H, Miller R. Model-based drug development. Clin Pharmacol Ther. 2007;82:21–32. doi: 10.1038/sj.clpt.6100235. [DOI] [PubMed] [Google Scholar]
- 15.Wang Y, Bhattaram AV, Jadhav PR, Lesko LJ, Madabushi R, Powell JR, Qiu W, Sun H, Yim DS, Zheng JJ, Gobburu JV. Leveraging prior quantitative knowledge to guide drug development decisions and regulatory science recommendations: impact of FDA pharmacometrics during 2004–2006. J Clin Pharmacol. 2008;48:146–156. doi: 10.1177/0091270007311111. [DOI] [PubMed] [Google Scholar]
- 16.Atkinson AJ, Jr, Lalonde RL. Introduction of quantitative methods in pharmacology and clinical pharmacology: a historical overview. Clin Pharmacol Ther. 2007;82:3–6. doi: 10.1038/sj.clpt.6100248. [DOI] [PubMed] [Google Scholar]
- 17.Earp JC, Dubois DC, Molano DS, Pyszczynski NA, Almon RR, Jusko WJ. Modeling corticosteroid effects in a rat model of rheumatoid arthritis II: mechanistic pharmacodynamic model for dexamethasone effects in Lewis rats with collagen-induced arthritis. J Pharmacol Exp Ther. 2008;326:546–554. doi: 10.1124/jpet.108.137414. [DOI] [PMC free article] [PubMed] [Google Scholar]
- 18.Earp JC, Dubois DC, Molano DS, Pyszczynski NA, Keller CE, Almon RR, Jusko WJ. Modeling corticosteroid effects in a rat model of rheumatoid arthritis I: mechanistic disease progression model for the time course of collagen-induced arthritis in Lewis rats. J Pharmacol Exp Ther. 2008;326:532–545. doi: 10.1124/jpet.108.137372. [DOI] [PMC free article] [PubMed] [Google Scholar]
- 19.R&D Systems, Inc. Human IL-1ra/IL-1F3 Immunoassay. www.rndsystems.com/pdf/DRA00B.pdf.
- 20.Yang BB, Baughman S, Sullivan JT. Pharmacokinetics of anakinra in subjects with different levels of renal function. Clin Pharmacol Ther. 2003;74:85–94. doi: 10.1016/S0009-9236(03)00094-8. [DOI] [PubMed] [Google Scholar]
- 21.Chang DM, Chang SY, Yeh MK, Lai JH. The pharmacokinetics of interleukin-1 receptor antagonist in Chinese subjects with rheumatoid arthritis. Pharmacol Res. 2004;50:371–376. doi: 10.1016/j.phrs.2004.02.002. [DOI] [PubMed] [Google Scholar]
- 22.Center for Drug Evaluation and Research, Food and Drug Administration. Pharmacology review, application number: 103950/0. 2001 http://www.accessdata.fda.gov/drugsatfda_docs/nda/2001/103950-0_Kineret_Pharmr.PDF.
- 23.Earp JC, Dubois DC, Almon RR, Jusko WJ. Quantitative dynamic models of arthritis progression in the rat. Pharm Res. 2009;26:196–203. doi: 10.1007/s11095-008-9711-3. [DOI] [PMC free article] [PubMed] [Google Scholar]
- 24.Lon HK, Liu D, Zhang Q, Dubois DC, Almon RR, Jusko WJ. Pharmacokinetic-pharmacodynamic disease progression model for effect of etanercept in lewis rats with collagen-induced arthritis. Pharm Res. 2011;28:1622–1630. doi: 10.1007/s11095-011-0396-7. [DOI] [PMC free article] [PubMed] [Google Scholar]
- 25.Holford N. The visual predictive check—superiority to standard diagnostic (Rorschach) plots. 2005 www.page-meeting.org/?abstract=738.
- 26.Shi J, Ludden TM, Melikian AP, Gastonguay MR, Hinderling PH. Population pharmacokinetics and pharmacodynamics of sotalol in pediatric patients with supraventricular or ventricular tachyarrhythmia. J Pharmacokinet Pharmacodyn. 2001;28:555–575. doi: 10.1023/a:1014412521191. [DOI] [PubMed] [Google Scholar]
- 27.Efron B. Bootstrap methods: another look at the jackknife. Ann Statisit. 1979;7:1–26. [Google Scholar]
- 28.Lindbom L, Ribbing J, Jonsson EN. Perl-speaks-NONMEM (PsN)–a Perl module for NONMEM related programming. Comput Methods Programs Biomed. 2004;75:85–94. doi: 10.1016/j.cmpb.2003.11.003. [DOI] [PubMed] [Google Scholar]
- 29.Jain L, Woo S, Gardner ER, Dahut WL, Kohn EC, Kummar S, Mould DR, Giaccone G, Yarchoan R, Venitz J, Figg WD. Population pharmacokinetic analysis of sorafenib in patients with solid tumors. Br J Clin Pharmacol. 2011;72:294–305. doi: 10.1111/j.1365-2125.2011.03963.x. [DOI] [PMC free article] [PubMed] [Google Scholar]
- 30.Nam JL, Winthrop KL, Van VRF, Pavelka K, Valesini G, Hensor EM, Worthy G, Landewe R, Smolen JS, Emery P, Buch MH. Current evidence for the management of rheumatoid arthritis with biological disease-modifying antirheumatic drugs: a systematic literature review informing the EULAR recommendations for the management of RA. Ann Rheum Dis. 2010;69:976–986. doi: 10.1136/ard.2009.126573. [DOI] [PubMed] [Google Scholar]
- 31.Mertens M, Singh JA. Anakinra for rheumatoid arthritis: a systematic review. J Rheumatol. 2009;36:1118–1125. doi: 10.3899/jrheum.090074. [DOI] [PubMed] [Google Scholar]
- 32.Gueorguieva I, Clark SR, McMahon CJ, Scarth S, Rothwell NJ, Tyrrell PJ, Hopkins S, Rowland M. Pharmacokinetic modelling of interleukin-1 receptor antagonist in plasma and cerebrospinal fluid of patients following subarachnoid haemorrhage. Br J Clin Pharmacol. 2008;65:317–325. doi: 10.1111/j.1365-2125.2007.03026.x. [DOI] [PMC free article] [PubMed] [Google Scholar]
- 33.Kim DC, Reitz B, Carmichael DF, Bloedow DC. Kidney as a major clearance organ for recombinant human interleukin-1 receptor antagonist. J Pharm Sci. 1995;84:575–580. doi: 10.1002/jps.2600840511. [DOI] [PubMed] [Google Scholar]
- 34.Granowitz EV, Porat R, Mier JW, Pribble JP, Stiles DM, Bloedow DC, Catalano MA, Wolff SM, Dinarello CA. Pharmacokinetics, safety and immunomodulatory effects of human recombinant interleukin-1 receptor antagonist in healthy humans. Cytokine. 1992;4:353–360. doi: 10.1016/1043-4666(92)90078-6. [DOI] [PubMed] [Google Scholar]
- 35.Zuurmond AM, Koudijs A, Van EB, Doornbos RP, Van MBC, Bastiaans JH, Penninks AH, Van BJH, Cnubben NH, Degroot J. Integration of efficacy, pharmacokinetic and safety assessment of interleukin-1 receptor antagonist in a preclinical model of arthritis. Regul Toxicol Pharmacol. 2011;59:461–470. doi: 10.1016/j.yrtph.2011.01.014. [DOI] [PubMed] [Google Scholar]
- 36.Wang W, Wang EQ, Balthasar JP. Monoclonal antibody pharmacokinetics and pharmacodynamics. Clin Pharmacol Ther. 2008;84:548–558. doi: 10.1038/clpt.2008.170. [DOI] [PubMed] [Google Scholar]
- 37.Lin JH. Pharmacokinetics of biotech drugs: peptides, proteins and monoclonal antibodies. Curr Drug Metab. 2009;10:661–691. doi: 10.2174/138920009789895499. [DOI] [PubMed] [Google Scholar]
- 38.Dirks NL, Meibohm B. Population pharmacokinetics of therapeutic monoclonal antibodies. Clin Pharmacokinet. 2010;49:633–659. doi: 10.2165/11535960-000000000-00000. [DOI] [PubMed] [Google Scholar]
- 39.Davies B, Morris T. Physiological parameters in laboratory animals and humans. Pharm Res. 1993;10:1093–1095. doi: 10.1023/a:1018943613122. [DOI] [PubMed] [Google Scholar]
- 40.Giraudel JM, Diquelou A, Laroute V, Lees P, Toutain PL. Pharmacokinetic/pharmacodynamic modelling of NSAIDs in a model of reversible inflammation in the cat. Br J Pharmacol. 2005;146:642–653. doi: 10.1038/sj.bjp.0706372. [DOI] [PMC free article] [PubMed] [Google Scholar]
- 41.Jeunesse EC, Bargues IA, Toutain CE, Lacroix MZ, Letellier IM, Giraudel JM, Toutain PL. Paw inflammation model in dogs for preclinical PK/PD investigations of non steroidal anti-inflammatory drugs. J Pharmacol Exp Ther. 2011;338:548–558. doi: 10.1124/jpet.110.178350. [DOI] [PubMed] [Google Scholar]
- 42.Sun YN, Jusko WJ. Transit compartments versus gamma distribution function to model signal transduction processes in pharmacodynamics. J Pharm Sci. 1998;87:732–737. doi: 10.1021/js970414z. [DOI] [PubMed] [Google Scholar]
- 43.Mager DE, Jusko WJ. Pharmacodynamic modeling of time-dependent transduction systems. Clin Pharmacol Ther. 2001;70:210–216. doi: 10.1067/mcp.2001.118244. [DOI] [PubMed] [Google Scholar]
- 44.Liu L, Paolo JD, Barbosa J, Rong H, Reif K, Wong H. Anti-arthritis effect of a novel bruton’s tyrosine kinase (BTK) inhibitor in rat collagen-induced arthritis and mechanism-based pharmacokinetic/pharmacodynamic modeling: relationships between inhibition of BTK phosphorylation and efficacy. J Pharmacol Exp Ther. 2011;338:154–163. doi: 10.1124/jpet.111.181545. [DOI] [PubMed] [Google Scholar]
- 45.Jusko WJ, Ko HC. Physiologic indirect response models characterize diverse types of pharmacodynamic effects. Clin Pharmacol Ther. 1994;56:406–419. doi: 10.1038/clpt.1994.155. [DOI] [PubMed] [Google Scholar]
- 46.Dayneka NL, Garg V, Jusko WJ. Comparison of four basic models of indirect pharmacodynamic responses. J Pharmacokinet Biopharm. 1993;21:457–478. doi: 10.1007/BF01061691. [DOI] [PMC free article] [PubMed] [Google Scholar]
- 47.Bendele A, McAbee T, Sennello G, Frazier J, Chlipala E, McCabe D. Efficacy of sustained blood levels of interleukin-1 receptor antagonist in animal models of arthritis: comparison of efficacy in animal models with human clinical data. Arthritis Rheum. 1999;42:498–506. doi: 10.1002/1529-0131(199904)42:3<498::AID-ANR15>3.0.CO;2-A. [DOI] [PubMed] [Google Scholar]
- 48.Schett G, Middleton S, Bolon B, Stolina M, Brown H, Zhu L, Pretorius J, Zack DJ, Kostenuik P, Feige U. Additive bone-protective effects of anabolic treatment when used in conjunction with RANKL and tumor necrosis factor inhibition in two rat arthritis models. Arthritis Rheum. 2005;52:1604–1611. doi: 10.1002/art.21021. [DOI] [PubMed] [Google Scholar]
- 49.D’Argenio DZ, Schumitzky A. A program package for simulation and parameter estimation in pharmacokinetic systems. Comput Programs Biomed. 1979;9:115–134. doi: 10.1016/0010-468x(79)90025-4. [DOI] [PubMed] [Google Scholar]
- 50.Zhang L, Beal SL, Sheiner LB. Simultaneous vs. sequential analysis for population PK/PD data I: best-case performance. J Pharmacokinet Pharmacodyn. 2003;30:387–404. doi: 10.1023/b:jopa.0000012998.04442.1f. [DOI] [PubMed] [Google Scholar]
- 51.Zhang L, Beal SL, Sheiner LB. Simultaneous vs. sequential analysis for population PK/PD data II: robustness of methods. J Pharmacokinet Pharmacodyn. 2003;30:405–416. doi: 10.1023/b:jopa.0000012999.36063.4e. [DOI] [PubMed] [Google Scholar]