

SUMMARY
Adaptation under similar selective pressure often leads to comparable phenotypes. A longstanding question is whether such phenotypic repeatability entails similar (parallelism) or different genotypic changes (convergence). To better understand this, we characterized mutations that optimized expression of a plasmid-borne metabolic pathway during laboratory evolution of a bacterium. Expressing these pathway genes was essential for growth but came with substantial costs. Starting from overexpression, replicate populations founded by this bacterium all evolved to reduce expression. Despite this phenotypic repetitiveness, the underlying mutational spectrum was highly diverse. Analysis of these plasmid mutations identified three distinct means to modulate gene expression: (1) reducing the gene copy number, (2) lowering transcript stability, and (3) integration of the pathway-bearing plasmid into the host genome. Our study revealed diverse molecular changes beneath convergence to a simple phenotype. This complex genotype-phenotype mapping presents a challenge to inferring genetic evolution based solely on phenotypic changes.
INTRODUCTION
Gene expression is the fundamental process through which proteins and RNAs are synthesized to sustain, protect, and replicate biological systems. Effects of expression on fitness depend on gene functions, expression patterns, and physiological demands set by organisms and environments. For instance, expression of b-lactamase protects bacterial pathogens from antibiotic killing but reduces their competitive advantage in a benign environment (Marciano et al., 2007). Controlling gene expression is crucial as expressing a gene at the incorrect level or under the wrong conditions can compromise its innate function and may disturb other physiological processes. This could result in a fitness disadvantage or even lethality (Brand and Perrimon, 1993; Saint-Dic et al., 2008). By contrast, altering expression through regulatory mutations occasionally brings phenotypic innovations critical to evolution. Natural selection should therefore operate strongly on gene expression to optimize its phenotypic outcomes (Monod and Jacob, 1961). This supposition has gained increasing support from recent transcriptome analyses comparing closely related species and genetic analyses that give insight into morphological evolution (Bedford and Hartl, 2009; Field et al., 2009; Abzhanov et al., 2006; Khaitovich et al., 2006). In a metabolic pathway, optimal performance requires adequate expression of enzymes to sustain metabolic flux. Insufficient enzyme production decelerates flux, which may lead to a build-up of toxic metabolites and slowed production of end products. In contrast, overexpressing enzymes not only consumes extra energy but may cause adverse effects due to protein aggregation or saturating the transcriptional and translational machinery (Kurland and Dong, 1996; Akashi and Gojobori, 2002; Stoebel et al., 2008). This trade-off in metabolism and the direct connection from metabolic flux to fitness thus provides a powerful paradigm to address how natural selection shapes the evolution of gene expression. Previous studies have mainly been designed to select for increased gene expression in microbes. Starting from strains that expressed essential genes at insufficient levels, mutations identified there often occurred in promoters (Dabizzi et al., 2001; Kasak et al., 1997), cis or trans regulatory elements (Hall, 1999; Notley-McRobb and Ferenci, 1999b, 1999a), or resulted from gene amplification (Sun et al., 2009; Brown et al., 1998). Less is known about the nature of mutations that downregulate gene expression. By evolving Escherichia coli with either insufficient or excessive expression of the lactose operon, Dekel and Alon demonstrated the power of selection to push gene expression toward optimal levels within just hundreds of generations (Dekel and Alon, 2005). Unfortunately, the molecular mechanisms underlying these evolutionary changes remained unclear. The lack of mechanistic mapping between genotypes and phenotypes in many similar studies renders a longstanding question unaddressed: How repeatable is evolution at genotypic versus phenotypic levels (Stern, 2011)?
We explored this question by examining the mechanism of gene expression optimization during adaptation of an engineered strain of Methylobacterium extorquens AM1 (EM) (Chou et al., 2011). In order to grow on methanol, Methylobacterium must oxidize formaldehyde into formate. Wild-type Methylobacterium (WT) performs this reaction by a tetrahydromethanopterin dependent pathway. This native pathway was removed and replaced in EM by a nonorthologous glutathione (GSH)-linked pathway (Figure S1 available online). This pathway comprised two Paracoccus denitrificans genes, flhA (encodes S-hydroxymethyl glutathione dehydrogenase) and fghA (encodes S-formyl-GSH hydrolase), introduced on plasmid pCM410 (Figure 1A). As a result, the EM strain could grow on methanol, but at a rate one-third that of WT. This engineered model system resembles lateral gene transfer frequently observed in nature. In order to study how EM adapted, eight replicate populations (termed F1 through F8) were founded and evolved in methanol minimal media for 600 generations. Previously, we identified eight chromosomal mutations along with an 11 bp deletion in the flhA-fghA gene cassette of an F4 evolved isolate, CM1145. We showed that overexpression of FlhA and FghA caused abnormal cell division and that the 11 bp deletion decreased their expression and was thereby beneficial. The discovery of this adaptive mutation and selection acting strongly on FlhA and FghA expression levels motivated us to look for plasmid mutations with similar phenotypic effects across replicate populations.
Figure 1. Diverse Mutations Occurred on the pCM410 Plasmid.

(A) Structure of pCM410. Seven ISMex25 insertion sites of Class C halotypes (pCM410C) are indicated by white arrowheads. trfA, plasmid replication gene encoding 33 or 44 kDa TrfA proteins; PmxaF, promoter of the flhA-fghA gene cassette (see also Figure S1 and Table S1); PtraJ, promoter of trfA; oriV, origin of replication recognized by TrfA proteins; oriT, origin of transfer; ColE1, high-copy origin of replication in E. coli; kan, kanamycin resistance marker.
(B) Class A haplotypes with mutations in fghA, predicted RBS (bold text), and its upstream region. The fghA start codon is underlined.
(C) Class B haplotypes with mutations in regions controlling plasmid replication.
(D) The process of forming Class C plasmid cointegrates and mini-plasmids.
SNPs, IS insertion sites, and deletions are indicated by black asterisks, dashed arrows, and black bars, respectively. Haplotypes chosen for detailed analysis are indicated by colored index numbers.
Here, we report a variety of mutations on pCM410 plasmids isolated from all evolved populations that reduce expression, indicating a parallel phenotypic change. Surprisingly, none of these mutations affected the promoter of the flhA-fghA cassette. Apart from quantifying their fitness effects, we probed the phenotypic effects of the mutations at DNA, RNA and protein levels finding that they altered gene expression through three distinct molecular mechanisms. Using a regulated expression system, we artificially tuned transcriptional initiation to demonstrate the same qualitative trend of an intermediate fitness optimum for expression, but never to the high fitness levels achieved by naturally selected mutations. Furthermore, the results revealed the prevalence of particular types of mutational events, such as integration of pCM410 into the host genome, which occurred across many replicate populations despite smaller selective advantages. This suggests that mutation rate is a key mediator of genetic evolution in addition to natural selection. Our integrative analysis of various molecular phenotypes thus uncovered diverse adaptive strategies to alter gene expression and reveal the complex relationship between genotype and an apparently simple phenotype.
RESULTS
Diverse Mutations from Evolved Isolates in Plasmid Carrying an Engineered Metabolic Pathway
In order to characterize the extent of EM adaptation in methanol, we first looked for mutations in the pCM410 plasmids of evolved isolates (termed pCM410 derivatives) as these plasmids expressed the foreign pathway needed for growth on this substrate. We characterized pCM410 derivatives of 37 evolved strains isolated across populations at various generations. From as early as 120 generations the strains acquired mutations not present in the ancestral plasmid (hereafter pCM410°). Based on the nature of these mutations, 15 haplotypes (plasmids with unique sets of mutations) were identified and grouped into three classes. The three classes of plasmid haplotypes (A, B, C) harbored mutations in the foreign gene cassette, in the region controlling plasmid replication, or resulted from several independent transposition events of a unique insertion sequence.
Class A haplotypes (i.e., pCM410A) refer to pCM410 derivatives with mutations in the fghA gene or its upstream region (Figure 1B). Five of 14 pCM410 derivatives from F1, F4, F5, and F6 populations fell into class pCM410A. These included one 11 bp deletion removing the predicted fghA ribosome binding site (RBS) (Salis et al., 2009) and the first 2 bp of the fghA gene, another 11 bp deletion previously found in the F4 isolate CM1145 (i.e., pCM410A1, corresponding to the index in Figure 1 and Table S1) (Chou et al., 2011), transposition of an insertion sequence ISMex4 (Chou et al., 2009) into a site 31 bp upstream of fghA (pCM410A2), a single nucleotide polymorphism (SNP) replacing the fghA start codon (M1T) (pCM410A3), and a 37 bp deletion immediately upstream of the fghA start codon.
Class B haplotypes (pCM410B) had mutations in regions controlling plasmid replication. Three pCM410B were identified among six pCM410 derivatives from F2, F3, and F6 populations (Figure 1C). pCM410B1, from F2, contained a SNP in the plasmid replication gene trfA (E25A, based on the 44 kDa TrfA reading frame) and a 1.1 kb deletion that removed the first 23 amino acids of TrfA-44, the promoter of trfA (PtraJ), as well as 109 bp of the origin of replication oriV. To facilitate characterization of the 1.1 kb deletion and the SNP in pCM410B1, these two mutations were separately introduced into the ancestral plasmid to generate pCM410B2 and pCM410B3, respectively. pCM410B4, from the F3 population, contained two SNPs in trfA (T189P and D276A). The pCM410B haplotype from the F6 population had an insertion sequence ISMex25 toward the 3′ end of trfA (pCM410B5; Figure 1D), which replaced the last 77 amino acids of the TrfA proteins with 27 predicted amino acids derived from ISMex25.
Class C haplotypes (pCM410C) were generated by an unusual mechanism: the integration of pCM410 into p2META, a 38 kb native plasmid of Methylobacterium. The fusion of two plasmids resulted from replicative transposition of ISMex25, an insertion sequence from p2META (Figure 1D) (Vuilleumier et al., 2009). Like other members of the IS6 family, ISMex25 is located on a plasmid, generates plasmid cointegrates upon transposition, exhibits no target specificity, and produces an 8 bp direct repeat sequence at insertion sites (Mahillon and Chandler, 1998). Seven pCM410C were identified among 17 pCM410 derivatives from F1, F3, F6, F7, and F8 populations. Six of these 7 pCM410C were generated by ISMex25 transposition into unique sites in the 3′ end of trfA, which encodes a DNA binding domain essential for initiating plasmid replication (Cereghino and Helinski, 1993; Lin and Helinski, 1992; Figure 1A; Table S1, Extended Experimental Procedures). pCM410C1 and pCM410C2, from the F1 and F6 populations, respectively, were chosen for further study. The last pCM410C was isolated from the F3 population (pCM410C3). It also resulted from replicative transposition of ISMex25 from p2META but into a site 20 bp downstream of oriV (Figure 1A).
Analysis of plasmid pairs pCM410B4/pCM410C3 and pCM410C2/pCM410B5 revealed possible evolutionary intermediates. In addition to being a plasmid cointegrate, pCM410C3 also possessed two SNPs in trfA identical to pCM410B4. Since pCM410C3 and pCM410B4 occurred in the same population, pCM410B4 is likely the precursor of pCM410C3. In a second example, pCM410B5, with an ISMex25 insertion in trfA, is identical to a mini-plasmid that could be generated from pCM410C2 through homologous recombination between its two ISMex25 copies (Figures 1C and 1D). pCM410C2 and pCM410B5 were both found in the F6 population at generation 300 and 600, respectively. Since ISMex25 exhibited no target specificity, the generational relationship and the fact that these two plasmids shared an identical ISMex25 insertion site supported pCM410C2 as the precursor of pCM410B5.
Beneficial Mutations on Plasmids Reduced Enzyme Activities to Approach an Intermediate Optimum
The universal, early appearance of pCM410 variants suggested that these mutations were beneficial. We therefore introduced each of these into the ancestral EM background and found that all aforementioned plasmid mutations conferred a selective advantage. Relative to pCM410°, selective advantages of Class A, B, and C haplotypes ranged from 27.9%~36.4%, 2.3%~41.4%, and 17.4%~24.1%, respectively (Figure 2; Extended Experimental Procedures; Figure S2). First, these values in the ancestral background are substantially less than the total improvement observed for the evolved strains they were isolated from (fitness = 1.38~2.01), indicating that chromosomal mutations were also critical in adaptation, as reported for one fully sequenced isolate (Chou et al., 2011). Second, the fitness effects of pCM410B5 (41.4% ± 1.6%) and pCM410C3 (23.5% ± 5.1%) were higher than their putative precursors pCM410C2 (23.9% ± 4.2%) and pCM410B4 (19.0% ± 3.7%), respectively (throughout we report means and 95% confidence intervals of three independent measurements). This is consistent with an evolutionary scenario in which natural selection continued to refine physiological functions.
Figure 2. Fitness Ranges of pCM410 Derivatives.
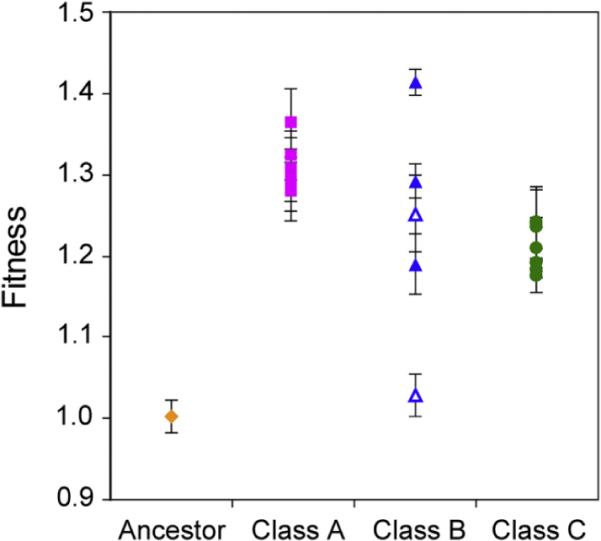
Empty triangles, pCM410B2 and pCM410B3 containing just the 1.1 kb deletion and the SNP of pCM410B1, respectively. Error bars are 95% confidence intervals. See also Figure S2 and Extended Experimental Procedures.
In order to understand the physiological basis of the selective advantage of the plasmid mutations, we examined levels of expression of the two formaldehyde oxidation enzymes. Relative to pCM410°, expression of both FlhA and FghA was decreased for all evolved plasmids (Figure 3; Table S1). Expression levels among pCM410A and pCM410C were each tightly clustered, while pCM410B were quite dispersed. FlhA and FghA expression of all haplotypes were significantly correlated (Pearson's r = 0.790, p < 0.01), although the relative changes in FghA expression were consistently larger than that of FlhA (p < 0.05). FlhA and FghA enzyme activities were both negatively correlated with fitness (Pearson's r = − 0.926, p < 0.01; Pearson's r = − 0.941, p < 0.01, respectively). Though this negative trend and the minute FghA expression of several haplotypes seemingly suggested FghA nonessential, introducing plasmids that expressed only FghA (pHC97) or just FlhA (pHC96) into the EM background failed to support any growth on methanol (see Extended Experimental Procedures). The cost of expressing these two enzymes was confirmed by expressing fghA (5.5% ± 0.3%) and FlhA (2.7% ± 0.3%) separately with PmxaF promoter in WT Methylobacterium where the GSH-linked pathway was redundant.
Figure 3. Expression of the GSH-Linked Pathway Exhibits an Intermediate Fitness Optimum.
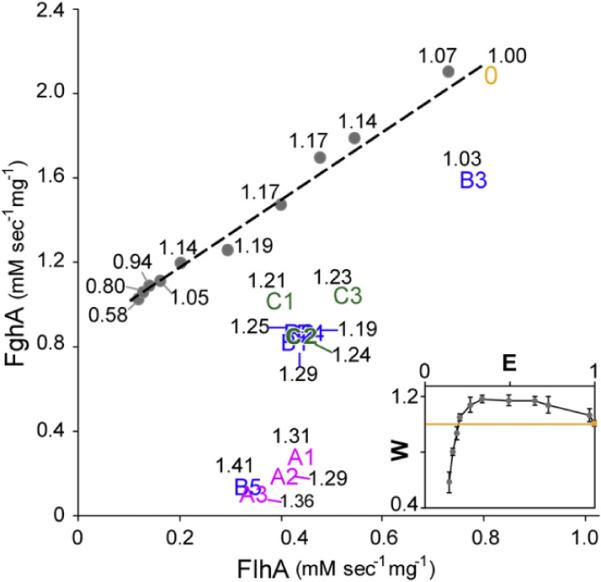
Enzymatic activities of plasmid haplotypes are indicated by their index numbers (0, ancestral pCM410; A1–A3, Class A haplotypes; B1–B5, Class B haplotypes; C1–C3, Class C haplotypes). Grey dots denote expression levels explored by the inducible expression plasmid pHC112. The corresponding fitness value of each data point is shown in black text. The inset shows the correspondence between enzyme activity (E) and fitness (W). pCM410° (yellow dot) and pHC112 (gray dots) are perpendicularly projected onto the orthogonal regression line (dashed line) of their FlhA and FghA enzyme activities. The yellow line in the inset denotes the fitness value of 1.0. Enzyme activity shown in the inset is expressed in terms of the relative distance between each projected point and the y axis intercept of the regression line. Error bars are 95% confidence intervals.
Although all evolved plasmid mutations led to reduced expression, none of the identified mutations affected the promoter of the flhA-fghA cassette. Was this absence due to the rarity of promoter mutations that reduce transcription initiation, or would they be less beneficial than the mutations that did prevail? In order to test this, we directly modulated transcriptional initiation via an inducible expression plasmid (pHC112). This demonstrated that reducing transcription does alleviate the cost of expression (Figure 3). The resulting fitness function of enzyme expression was concave, characterized by a steep positive slope, a broad plateau, and slow fitness decay at low, medium and high expression levels, respectively. Interestingly, the maximum fitness achieved by the inducible expression plasmid (19.2% ± 0.6%) was lower than that of most pCM410 derivatives. The inducible expression plasmid explored an expression range distinct from that occupied by naturally selected plasmid mutations. Additionally, the relative changes in FlhA and FghA activities across the expression ranges are statistically distinguishable between the two groups (p < 0.01, ANCOVA test). These quantitative differences may thus lead to the lower fitness values conferred by the inducible expression plasmid (see Discussion).
Mutations Modulated Gene Expression through Three Distinct Mechanisms
To dissect the physiological connection between diverse mutations and expression phenotypes, we used real-time PCR to quantify the plasmid copy number and the flhA and fghA transcript levels of representative haplotypes. We then performed cluster analysis and principle component analysis to classify haplotypes based on these molecular phenotypes and enzyme activity. Cluster analysis grouped pCM410A and pCM410C into two separate clusters while pCM410B were dispersed in between (Figure 4A). Relative to pCM410°, pCM410A were characterized by comparable plasmid copy number, significant decreases in both transcripts, and considerable reductions in both enzyme activities. On the other hand, pCM410B showed a range of plasmid copy, transcript levels, and enzyme activity, all of which appeared to correlate with each other. pCM410C mutations exhibited significant decreases in plasmid copy and moderate reductions in both enzyme activities, although their transcript levels were comparable to pCM410°. Furthermore, cluster analysis of the molecular profiles of pCM410B5 and pCM410C3 separated these double-mutation plasmids from their single-mutation precursors pCM410C2 and pCM410B4, respectively, indicating the dominant influence of later mutations.
Figure 4. Three Plasmid Haplotype Classes Exhibit Distinct Molecular Phenotypes.
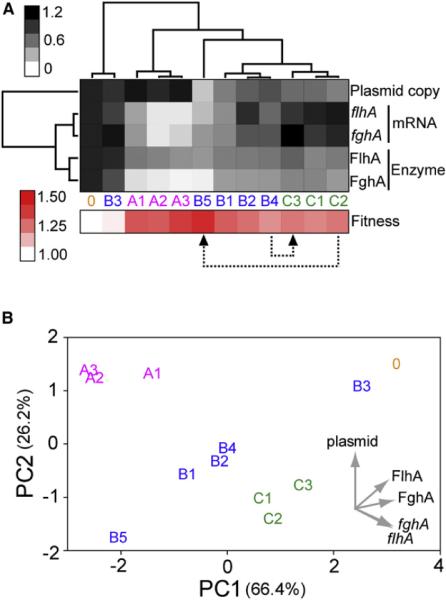
(A) Cluster analysis of molecular phenotypes of plasmid haplotypes. Values of each molecular phenotype shown here are normalized to that of pCM410°, then weighted equally and analyzed together by hierarchical clustering. Molecular phenotypes are shown in their normalized values as a grayscale heat map. Transcript levels and enzyme activities are indicated by italicized and capitalized letters, respectively. Fitness, though not included in the cluster analysis, is shown as a red-scale heat map in the bottom. Two color bars on the side denote the scale for heat maps. Two cases in which pCM410 derivatives switch haplotype classes due to the acquisition of further mutations are indicated by dashed arrows.
(B) Principle component (PC) analysis of molecular phenotypes. The data variation captured by PCs is shown as percentage in parenthesis. The loadings of PC1 and PC2 on the five molecular phenotypes are indicated by gray arrows. See also Figure S3, Tables S1 and S2, and Extended Experimental Procedures.
Plasmid haplotypes are indicated by their index numbers as described in Figure 3.
Principle component analysis transformed the molecular profile into five principle components (PCs), with the first two PCs summarizing more than 92% of the data variation (Figure 4B). PC1 captured most variations in RNA and protein levels and hence could be viewed as a vector for gene expression. PC2 could be considered as a vector for the DNA level as it described most variations in plasmid copy numbers. By depicting plasmid haplotypes in terms of their PC1 and PC2 coordinates, pCM410A and pCM410C each formed a self-inclusive cluster. On the other hand, pCM410B were aligned along the diagonal, confirming a correlation between their plasmid copy numbers and gene expression (Pearson's r = 0.981, p < 0.01). Fitness of plasmid haplotypes was significantly correlated with PC1 (Pearson's r = −0.900, p < 0.01) but not PC2 (Pearson's r = −0.351, p > 0.2) (Figure S3), suggesting gene expression as the major determinant for fitness.
DISCUSSION
Studies of adaptation in nature or laboratory populations have revealed the high repeatability of phenotypic evolution under similar selective pressure (Wood et al., 2005). The stage is set to address whether similar phenotypic changes arise from comparable molecular changes (Stern and Orgogozo, 2009). By evolving our replicate populations under identical conditions, selection rapidly led to the emergence of diverse genotypes that optimized a simple phenotype, gene expression, via at least three mechanisms. Though reduced gene expression is thought to evolve more readily than increased expression, this presumption has rarely been tested. In fact, using an unbiased method to survey mutations affecting the strength of a yeast promoter, Wittkopp et al. recently showed an equal probability for both directions (T. Wittkopp, J. Gruber, K. Vogel, and G. Kalay, personal communication). In contrast to the canonical impression from mutational studies of increased expression (Dabizzi et al., 2001; Henkin and Sonenshein, 1987; Kasak et al., 1997), none of mutations identified here affected the promoter. Decreased expression of pCM410A resulted from a reduction in transcript levels. This was likely due to enhanced degradation of the flhA-fghA mRNA since mutations of pCM410A all resided in or close to the predicted RBS of fghA and may impede the attachment of ribosomes and their translational movement across mRNA (Figure 1B; Table S2; Extended Experimental Procedures; Iost and Dreyfus, 1995; Kaberdin and Blaäsi, 2006). Without ribosome shielding, the flhA-fghA mRNA could become vulnerable to the attack by RNase, leading to faster transcript decay. Interestingly, transposition of ISMex4 (pCM410A2) conferred a benefit by reducing flhA and fghA expression, whereas in another study it increased fitness under metal limitation by enhancing expression of a cobalt transporter through its outward promoter activity (Chou et al., 2009), stressing the versatility of IS-mediated mutations in modifying expression of nearby genes (Cohen, 1976). Mutations of pCM410B compromised pCM410 replication. Decreases in plasmid copy number lowered flhA and fghA gene dosage, which then translated into diminished enzyme production. The mechanism for reducing expression among pCM410C was less obvious. Though their plasmid copy dropped significantly, this decline did not transmit directly to the mRNA level (Figure 4A). Since no mutation occurred in the flhA-fghA cassette of pCM410C, the decrease in protein production per transcript may result from a change in the genomic context (Thompson and Gasson, 2001; Spradling and Rubin, 1983; Willenbrock and Ussery, 2004). Disrupting TrfA proteins that originally bind to oriV of pCM410 and the fusion of pCM410 and the native p2META may change the DNA packing and topology of pCM410C, resulting in different transcriptional and translational efficiencies. As plasmids are key mediators for horizontal gene transfer, our results suggest that changing plasmid copy number can be an effective strategy to rapidly optimize expression of newly acquired genes. Reciprocally, selection for optimizing expression of genes on plasmids may influence the evolution of plasmid replication as well. Moreover, the prevalence of IS-dependent integration between foreign and native plasmids in our experimental populations recapitulates the importance of this evolutionary mechanism leading to the emergence of multidrug resistance plasmids among microbial communities (Cohen, 1976; Berg et al., 1998; Rubens et al., 1979).
Two factors may have led to the lack of promoter mutations in our collection of evolved isolates. First, certain beneficial mutations, such as ISMex25 transposition of pCM410C, likely occurred at fairly high rates, which could contribute to their repeated emergence and eventual fixation in populations. Second, the selective advantage of promoter mutations may be lower than those of other types. Thus, although there are certainly promoter variants that would have decreased expression, in the face of competing with other beneficial alleles for fixation, clonal interference might hinder their rise to detectable frequencies. Our results offered support for both possibilities. pCM410C mediated by ISMex25 transposition were present in five out of eight replicate populations even though their selective advantages were on average lower than those of pCM410A or pCM410B (Figure 2), suggesting the potential influence of mutation rates. This is further supported by the fact that low frequencies of pCM410C were detected in all populations, with up to a 15 variants present transiently in a replicate population (M.-C. Lee and C.J.M., unpublished data). In addition, using an inducible expression system, we demonstrated that reduced transcriptional initiation decreased FlhA and FghA expression and thereby improved growth (Figure 3). Yet the maximum selective advantage attained through tuning transcription was lower than that of most pCM410 derivatives emerging from laboratory evolution. This discrepancy appears to arise from the fact that promoter-dependent transcriptional regulation lowers FlhA levels more than FghA, whereas naturally selected mutations particularly reduced FghA levels, allowing greater reductions in fitness costs (Figure 3). In contrast to our ancestral strain, bacteria used in prior mutational studies often relied on weak promoters to express essential genes (Andersson and Hughes, 2009; Kasak et al., 1997; Dabizzi et al., 2001). From such starting points, the most effective strategies to raise expression may be to increase transcription by mutating promoter sequences or increase dosage through gene amplification. However, other strategies to alter expression, as revealed in this study, might be equally or more readily accessible when evolution proceeds toward the opposite direction.
Tracking the physiological impacts of mutations from DNA, RNA, protein, to fitness, our study yields unprecedented mechanistic insights into the evolution of gene expression. The results were a striking example of a simple phenotypic change (i.e., gene expression) achieved through diverse mutations and distinct molecular mechanisms. This great heterogeneity beneath a seemingly monotonic evolutionary event not only underscores the flexibility of genetic systems but raises serious concerns regarding the many efforts to link genotypic and phenotypic changes when only the latter have been assayed (Lenski et al., 1991; Barrett et al., 2006; Hegreness et al., 2006; Kassen and Bataillon, 2006). These concerns are further exacerbated by the fact that our comprehensive study of changes in a single physiological function echoes what has been seen at the genomic level (Barrick et al., 2009; Gresham et al., 2008; Chou et al., 2011): many beneficial genomic changes are not point mutations. The prominent role of indels and various mutations mediated by mobile genetic elements in these studies confounds attempts to test predictions of theoretical models regarding the dependence of adaptation on a single (point) mutation rate (Desai et al., 2007). In accord with a recent study that compared the speed of genotypic and phenotypic evolution (Barrick et al., 2009), such approaches may greatly underestimate the rate and diversity of genetic evolution. Mechanistic dissection of adaptive mutations points to an essential and promising path to improve our understanding of the genotypephenotype mapping that will shed light on how evolution proceeds at these two levels.
EXPERIMENTAL PROCEDURES
Experimental Evolution and Growth Conditions
The EM was generated previously by deleting the mptG gene of Methylobacterium involved in tetrahydromethanopterin biosynthesis followed by the introduction of pCM410 (Chou et al., 2011). Eight replicate populations seeded by the EM were grown in 9.6 ml methanol (15 mM) minimal media incubated in a 30°C shaking incubator at 225 rpm. Populations were transferred into fresh media at a 1/64 dilution rate (thus six generations per growth cycle) and propagated for 600 generations. Population samples were preserved with 8% dimethyl sulfoxide at −80°C.
Plasmid Construction
Artificially constructed plasmids and the construction procedures are described in the Extended Experimental Procedures.
Isolation and Characterization of pCM410 Derivatives
pCM410 derivatives of evolved isolates were conjugated through tri-parental mating (Chistoserdov et al., 1994) into E. coli DH5α where plasmids were maintained at high copy number. Mutations in these plasmids were identified through PCR detection or sequencing using primers listed in Extended Experimental Procedures. To characterize the phenotypic effects of plasmid mutations in Methylobacterium, pCM410 derivatives maintained in E. coli were introduced back into the EM strain through tri-parental mating or electroporation (Toyama et al., 1998). Phenotypes of the resulting strains were then examined through growth rate, fitness, real-time PCR, or enzyme assays.
Extraction and Quantification of DNA and RNA
Extraction of genomic DNA of Methylobacterium started with physical disruption of cells using the Mini-Beadbeater 8 (BioSpec Products) followed by alkaline lysis (Lee et al., 2006). Plasmid DNA in E. coli was extracted using the QIAprep Spin MiniPrep Kit (QIAGEN). For RNA isolation, exponentially growing cells (defined as half-maximal optical density at 600 nm, OD600) were processed by the RNeasy Mini Kit (QIAGEN) followed by removing residual genomic DNA with the Turbo DNA-free Kit (Ambion). cDNA was generated by the qScript cDNA Synthesis Kit (Quanta Biosciences). Transcript levels were quantified by real-time PCR on a DNA Engine Opticon2 (MJ Research) (see also Extended Experimental Procedures).
Growth Rate, Fitness, and Enzyme Assays
Growth rates were monitored as changes in OD600 using a Bio-Rad micro-plate reader model 680. The fitness of a given strain was quantified as the reproductive success by growth competition against a reference strain (see also Extended Experimental Procedures). For enzyme assays, exponentially growing cells were harvested via centrifugation, washed and suspended in 50 mM Tris-HCl buffer (pH 7.5) at 4°C, disrupted by a French pressure cell at 108 Pa, and then centrifuged to remove cell debris. Kinetic analysis of FlhA and FghA activities over 10 min at 30°C was monitored using a Spectra-Max M5 Plate Reader (Molecular Devices) (Chou et al., 2011).
Cluster Analysis and Principle Component Analysis
A dataset consisting of plasmid copy numbers, flhA and fghA transcript levels, and FlhA and FghA enzyme activities of the ancestor pCM410 and its 12 derivatives in the ancestral EM background was subject to cluster analysis and principle component analysis using Cluster 3.0 (Eisen et al., 1998) and the “princomp” function of the R package (R Development Core Team, 2009), respectively (see also Extended Experimental Procedures).
Supplementary Material
ACKNOWLEDGMENTS
We thank Jun-Yi Leu, Allan Drummond, Trisha Wittkopp, Eric Hayden, and members of the Marx lab for valuable comments to improve this manuscript. This work was funded by the NIH (GM078209). H.-H.C. acknowledges support by an EMBO Long-Term Fellowship (ALTF 132-2010).
Footnotes
LICENSING INFORMATION This is an open-access article distributed under the terms of the Creative Commons Attribution 3.0 Unported License (CC-BY; http://creativecommons. org/licenses/by/3.0/legalcode).
SUPPLEMENTAL INFORMATION Supplemental Information includes three figures, four tables, and Extended Experimental Procedures and can be found with this article online at doi:10.1016/j.celrep.2011.12.003.
REFERENCE
- Abzhanov A, Kuo WP, Hartmann C, Grant BR, Grant PR, Tabin CJ. The calmodulin pathway and evolution of elongated beak morphology in Darwin's finches. Nature. 2006;442:563–567. doi: 10.1038/nature04843. [DOI] [PubMed] [Google Scholar]
- Akashi H, Gojobori T. Metabolic efficiency and amino acid composition in the proteomes of Escherichia coli and Bacillus subtilis. Proc. Natl. Acad. Sci. USA. 2002;99:3695–3700. doi: 10.1073/pnas.062526999. [DOI] [PMC free article] [PubMed] [Google Scholar]
- Andersson DI, Hughes D. Gene amplification and adaptive evolution in bacteria. Annu. Rev. Genet. 2009;43:167–195. doi: 10.1146/annurev-genet-102108-134805. [DOI] [PubMed] [Google Scholar]
- Barrett RD, MacLean RC, Bell G. Mutations of intermediate effect are responsible for adaptation in evolving Pseudomonas fluorescens populations. Biol. Lett. 2006;2:236–238. doi: 10.1098/rsbl.2006.0439. [DOI] [PMC free article] [PubMed] [Google Scholar]
- Barrick JE, Yu DS, Yoon SH, Jeong H, Oh TK, Schneider D, Lenski RE, Kim JF. Genome evolution and adaptation in a long-term experiment with Escherichia coli. Nature. 2009;461:1243–1247. doi: 10.1038/nature08480. [DOI] [PubMed] [Google Scholar]
- Bedford T, Hartl DL. Optimization of gene expression by natural selection. Proc. Natl. Acad. Sci. USA. 2009;106:1133–1138. doi: 10.1073/pnas.0812009106. [DOI] [PMC free article] [PubMed] [Google Scholar]
- Berg T, Firth N, Apisiridej S, Hettiaratchi A, Leelaporn A, Skurray RA. Complete nucleotide sequence of pSK41: evolution of staphylococcal conjugative multiresistance plasmids. J. Bacteriol. 1998;180:4350–4359. doi: 10.1128/jb.180.17.4350-4359.1998. [DOI] [PMC free article] [PubMed] [Google Scholar]
- Brand AH, Perrimon N. Targeted gene expression as a means of altering cell fates and generating dominant phenotypes. Development. 1993;118:401–415. doi: 10.1242/dev.118.2.401. [DOI] [PubMed] [Google Scholar]
- Brown CJ, Todd KM, Rosenzweig RF. Multiple duplications of yeast hexose transport genes in response to selection in a glucose-limited environment. Mol. Biol. Evol. 1998;15:931–942. doi: 10.1093/oxfordjournals.molbev.a026009. [DOI] [PubMed] [Google Scholar]
- Cereghino JL, Helinski DR. Essentiality of the three carboxylterminal amino acids of the plasmid RK2 replication initiation protein TrfA for DNA binding and replication activity in gram-negative bacteria. J. Biol. Chem. 1993;268:24926–24932. [PubMed] [Google Scholar]
- Chistoserdov AY, Chistoserdova LV, McIntire WS, Lidstrom ME. Genetic organization of the mau gene cluster in Methylobacterium extorquens AM1: complete nucleotide sequence and generation and characteristics of mau mutants. J. Bacteriol. 1994;176:4052–4065. doi: 10.1128/jb.176.13.4052-4065.1994. [DOI] [PMC free article] [PubMed] [Google Scholar]
- Chou HH, Berthet J, Marx CJ. Fast growth increases the selective advantage of a mutation arising recurrently during evolution under metal limitation. PLoS Genet. 2009;5:e1000652. doi: 10.1371/journal.pgen.1000652. [DOI] [PMC free article] [PubMed] [Google Scholar]
- Chou HH, Chiu HC, Delaney NF, Segrè D, Marx CJ. Diminishing returns epistasis among beneficial mutations decelerates adaptation. Science. 2011;332:1190–1192. doi: 10.1126/science.1203799. [DOI] [PMC free article] [PubMed] [Google Scholar]
- Cohen SN. Transposable genetic elements and plasmid evolution. Nature. 1976;263:731–738. doi: 10.1038/263731a0. [DOI] [PubMed] [Google Scholar]
- Dabizzi S, Ammannato S, Fani R. Expression of horizontally transferred gene clusters: activation by promoter-generating mutations. Res. Microbiol. 2001;152:539–549. doi: 10.1016/s0923-2508(01)01228-1. [DOI] [PubMed] [Google Scholar]
- Dekel E, Alon U. Optimality and evolutionary tuning of the expression level of a protein. Nature. 2005;436:588–592. doi: 10.1038/nature03842. [DOI] [PubMed] [Google Scholar]
- Desai MM, Fisher DS, Murray AW. The speed of evolution and maintenance of variation in asexual populations. Curr. Biol. 2007;17:385–394. doi: 10.1016/j.cub.2007.01.072. [DOI] [PMC free article] [PubMed] [Google Scholar]
- Eisen MB, Spellman PT, Brown PO, Botstein D. Cluster analysis and display of genome-wide expression patterns. Proc. Natl. Acad. Sci. USA. 1998;95:14863–14868. doi: 10.1073/pnas.95.25.14863. [DOI] [PMC free article] [PubMed] [Google Scholar]
- Field Y, Fondufe-Mittendorf Y, Moore IK, Mieczkowski P, Kaplan N, Lubling Y, Lieb JD, Widom J, Segal E. Gene expression divergence in yeast is coupled to evolution of DNA-encoded nucleosome organization. Nat. Genet. 2009;41:438–445. doi: 10.1038/ng.324. [DOI] [PMC free article] [PubMed] [Google Scholar]
- Gresham D, Desai MM, Tucker CM, Jenq HT, Pai DA, Ward A, DeSevo CG, Botstein D, Dunham MJ. The repertoire and dynamics of evolutionary adaptations to controlled nutrient-limited environments in yeast. PLoS Genet. 2008;4:e1000303. doi: 10.1371/journal.pgen.1000303. [DOI] [PMC free article] [PubMed] [Google Scholar]
- Hall BG. Spectra of spontaneous growth-dependent and adaptive mutations at ebgR. J. Bacteriol. 1999;181:1149–1155. doi: 10.1128/jb.181.4.1149-1155.1999. [DOI] [PMC free article] [PubMed] [Google Scholar]
- Hegreness M, Shoresh N, Hartl D, Kishony R. An equivalence principle for the incorporation of favorable mutations in asexual populations. Science. 2006;311:1615–1617. doi: 10.1126/science.1122469. [DOI] [PubMed] [Google Scholar]
- Henkin TM, Sonenshein AL. Mutations of the Escherichia coli lacUV5 promoter resulting in increased expression in Bacillus subtilis. Mol. Gen. Genet. 1987;209:467–474. doi: 10.1007/BF00331151. [DOI] [PubMed] [Google Scholar]
- Iost I, Dreyfus M. The stability of Escherichia coli lacZ mRNA depends upon the simultaneity of its synthesis and translation. EMBO J. 1995;14:3252–3261. doi: 10.1002/j.1460-2075.1995.tb07328.x. [DOI] [PMC free article] [PubMed] [Google Scholar]
- Kaberdin VR, Bläsi U. Translation initiation and the fate of bacterial mRNAs. FEMS Microbiol. Rev. 2006;30:967–979. doi: 10.1111/j.1574-6976.2006.00043.x. [DOI] [PubMed] [Google Scholar]
- Kasak L, Hôrak R, Kivisaar M. Promoter-creating mutations in Pseudomonas putida: a model system for the study of mutation in starving bacteria. Proc. Natl. Acad. Sci. USA. 1997;94:3134–3139. doi: 10.1073/pnas.94.7.3134. [DOI] [PMC free article] [PubMed] [Google Scholar]
- Kassen R, Bataillon T. Distribution of fitness effects among beneficial mutations before selection in experimental populations of bacteria. Nat. Genet. 2006;38:484–488. doi: 10.1038/ng1751. [DOI] [PubMed] [Google Scholar]
- Khaitovich P, Tang K, Franz H, Kelso J, Hellmann I, Enard W, Lachmann M, Pääbo S. Positive selection on gene expression in the human brain. Curr. Biol. 2006;16:R356–R358. doi: 10.1016/j.cub.2006.03.082. [DOI] [PubMed] [Google Scholar]
- Kurland CG, Dong H. Bacterial growth inhibition by overproduction of protein. Mol. Microbiol. 1996;21:1–4. doi: 10.1046/j.1365-2958.1996.5901313.x. [DOI] [PubMed] [Google Scholar]
- Lee CL, Ow DS, Oh SK. Quantitative real-time polymerase chain reaction for determination of plasmid copy number in bacteria. J. Micro-biol. Methods. 2006;65:258–267. doi: 10.1016/j.mimet.2005.07.019. [DOI] [PubMed] [Google Scholar]
- Lenski RE, Rose MR, Simpson SC, Tadler SC. Long-term experimental evolution in Escherichia coli. 1. adaptation and divergence during 2,000 generations. Am. Nat. 1991;138:1315–1341. [Google Scholar]
- Lin J, Helinski DR. Analysis of mutations in trfA, the replication initiation gene of the broad-host-range plasmid RK2. J. Bacteriol. 1992;174:4110–4119. doi: 10.1128/jb.174.12.4110-4119.1992. [DOI] [PMC free article] [PubMed] [Google Scholar]
- Mahillon J, Chandler M. Insertion sequences. Microbiol. Mol. Biol. Rev. 1998;62:725–774. doi: 10.1128/mmbr.62.3.725-774.1998. [DOI] [PMC free article] [PubMed] [Google Scholar]
- Marciano DC, Karkouti OY, Palzkill T. A fitness cost associated with the antibiotic resistance enzyme SME-1 β-lactamase. Genetics. 2007;176:2381–2392. doi: 10.1534/genetics.106.069443. [DOI] [PMC free article] [PubMed] [Google Scholar]
- Monod J, Jacob F. Teleonomic mechanisms in cellular metabolism, growth, and differentiation. Cold Spring Harb. Symp. Quant. Biol. 1961;26:389–401. doi: 10.1101/sqb.1961.026.01.048. [DOI] [PubMed] [Google Scholar]
- Notley-McRobb L, Ferenci T. Adaptive mgl-regulatory mutations and genetic diversity evolving in glucose-limited Escherichia coli populations. Environ. Microbiol. 1999a;1:33–43. doi: 10.1046/j.1462-2920.1999.00002.x. [DOI] [PubMed] [Google Scholar]
- Notley-McRobb L, Ferenci T. The generation of multiple coexisting mal-regulatory mutations through polygenic evolution in glucoselimited populations of Escherichia coli. Environ. Microbiol. 1999b;1:45–52. doi: 10.1046/j.1462-2920.1999.00003.x. [DOI] [PubMed] [Google Scholar]
- R Development Core Team . R: A Language and Environment for Statistical Computing. R Foundation for Statistical Computing; Vienna: 2009. [Google Scholar]
- Rubens CE, McNeill WF, Farrar WE., Jr. Evolution of multipleantibiotic-resistance plasmids mediated by transposable plasmid deoxyribonucleic acid sequences. J. Bacteriol. 1979;140:713–719. doi: 10.1128/jb.140.2.713-719.1979. [DOI] [PMC free article] [PubMed] [Google Scholar]
- Saint-Dic D, Kehrl J, Frushour B, Kahng LS. Excess SeqA leads to replication arrest and a cell division defect in Vibrio cholerae. J. Bacteriol. 2008;190:5870–5878. doi: 10.1128/JB.00479-08. [DOI] [PMC free article] [PubMed] [Google Scholar]
- Salis HM, Mirsky EA, Voigt CA. Automated design of synthetic ribosome binding sites to control protein expression. Nat. Biotechnol. 2009;27:946–950. doi: 10.1038/nbt.1568. [DOI] [PMC free article] [PubMed] [Google Scholar]
- Spradling AC, Rubin GM. The effect of chromosomal position on the expression of the Drosophila xanthine dehydrogenase gene. Cell. 1983;34:47–57. doi: 10.1016/0092-8674(83)90135-6. [DOI] [PubMed] [Google Scholar]
- Stern DL. Evolution, Development, and the Predictable Genome. Roberts and Company Publishers; 2011. Greenwood Village, the United States: The Predictable Genome; pp. 149–174. [Google Scholar]
- Stern DL, Orgogozo V. Is genetic evolution predictable? Science. 2009;323:746–751. doi: 10.1126/science.1158997. [DOI] [PMC free article] [PubMed] [Google Scholar]
- Stoebel DM, Dean AM, Dykhuizen DE. The cost of expression of Escherichia coli lac operon proteins is in the process, not in the products. Genetics. 2008;178:1653–1660. doi: 10.1534/genetics.107.085399. [DOI] [PMC free article] [PubMed] [Google Scholar]
- Sun S, Berg OG, Roth JR, Andersson DI. Contribution of gene amplification to evolution of increased antibiotic resistance in Salmonella typhimurium. Genetics. 2009;182:1183–1195. doi: 10.1534/genetics.109.103028. [DOI] [PMC free article] [PubMed] [Google Scholar]
- Thompson A, Gasson MJ. Location effects of a reporter gene on expression levels and on native protein synthesis in Lactococcus lactis and Saccharomyces cerevisiae. Appl. Environ. Microbiol. 2001;67:3434–3439. doi: 10.1128/AEM.67.8.3434-3439.2001. [DOI] [PMC free article] [PubMed] [Google Scholar]
- Toyama H, Anthony C, Lidstrom ME. Construction of insertion and deletion mxa mutants of Methylobacterium extorquens AM1 by electroporation. FEMS Microbiol. Lett. 1998;166:1–7. doi: 10.1111/j.1574-6968.1998.tb13175.x. [DOI] [PubMed] [Google Scholar]
- Vuilleumier S, Chistoserdova L, Lee MC, Bringel F, Lajus A, Zhou Y, Gourion B, Barbe V, Chang J, Cruveiller S, et al. Methylobacterium genome sequences: a reference blueprint to investigate microbial metabolism of C1 compounds from natural and industrial sources. PLoS ONE. 2009;4:e5584. doi: 10.1371/journal.pone.0005584. [DOI] [PMC free article] [PubMed] [Google Scholar]
- Willenbrock H, Ussery DW. Chromatin architecture and gene expression in Escherichia coli. Genome Biol. 2004;5:252. doi: 10.1186/gb-2004-5-12-252. [DOI] [PMC free article] [PubMed] [Google Scholar]
- Wood TE, Burke JM, Rieseberg LH. Parallel genotypic adaptation: when evolution repeats itself. Genetica. 2005;123:157–170. doi: 10.1007/s10709-003-2738-9. [DOI] [PMC free article] [PubMed] [Google Scholar]
Associated Data
This section collects any data citations, data availability statements, or supplementary materials included in this article.