

Abstract
Background
Recent surge in knee replacements has been assumed to be due to aging and increased obesity of the US population.
Objectives
We described the trend in prevalences of knee pain and symptomatic knee osteoarthritis and assessed whether age, obesity, and change in radiographic osteoarthritis explained this trend.
Design
We used data from six National Health and Nutrition Examination Surveys (NHANES) between 1971 and 2004 and from three examination periods in the Framingham Osteoarthritis (FOA) Study between 1983 through 2005 (Original cohort 1983–5 and 1992–5, Offspring 1992–5 and 2002–5, and a Community sample 2002–5).
Setting
NHANES included nationally representative samples of the non-institutionalized US population, and the Framingham Study was a population-based cohort.
Participants
We included data from NHANES participants 60 to 74 years of age, of White or Black race, and data from Framingham Study of mostly White participants, 70 years or older.
Measurements
Subjects in NHANES were asked about pain in or around the knee on most days. In the Framingham Study, subjects were asked about knee pain and had bilateral weight-bearing anteroposterior knee x-rays to define radiographic osteoarthritis. We used radiographic evidence and pain to define symptomatic osteoarthritis. We used marginal standardization with logistic regression first to calculate age-adjusted, and then age and BMI-adjusted prevalence by sex, and compared the adjusted prevalence of knee pain and osteoarthritis at later exams with earlier exams using the ratio of the prevalence estimates.
Results
The age-adjusted prevalence of knee pain and symptomatic osteoarthritis increased over time in all samples studied. With adjustment for both age and BMI the prevalence of knee pain increased by about 65% in NHANES from 1974 to 1994 among Non-Hispanic White and Mexican men and women and among African American women. In the Framingham Osteoarthritis (FOA) Study, the age and body mass index (BMI)-adjusted prevalences of knee pain and symptomatic knee osteoarthritis approximately doubled in women and tripled in men over a 20-year period. No such increasing trend was observed in radiographic osteoarthritis prevalence in Framingham subjects. After age adjustment, additionally adjusting for BMI resulted in a 10–25% decrease in the prevalence ratios for knee pain and symptomatic knee osteoarthritis.
Limitations
We cannot rule out differences in sampling of Framingham subjects over time or birth cohort effects (generational factors) as possible explanations of the increased reporting of knee pain. Increases in prevalence at the last time period in Framingham might be due to differences in cohort membership by time period.
Conclusions
Results suggest that independent of age and BMI prevalence of knee pain has increased substantially over a 20–year period. Obesity accounted for only part of this increase. In the FOA Study, there was an increase in symptomatic osteoarthritis but no increase in radiographic osteoarthritis.
Primary Funding Source
The American College of Rheumatology Research and Education Foundation Rheumatology Scientist Development Award, NIH AR47785 and AG18393, and NHLBI, Framingham Heart Study (NHLBI/NIH Contract #N01-HC-25195) and the Boston University School of Medicine.
INTRODUCTION
Frequent knee pain affects approximately 25% of adults, limits function and mobility, and impairs quality of life (1, 2, 3, 4), with osteoarthritis as the most common cause of knee pain in people 50 years or older (5). Among those with knee osteoarthritis, knee pain is a major reason for knee replacements.
The rate of knee replacements has surged in recent years. From 1991 to 2006, the age-standardized rates of total knee replacement (TKR) in the United Kingdom more than tripled in women (from 42.5 to 138.7 per 100,000 person-years) and in men (from 28.7 to 99.4 per 100,000 person-years) (6). In the U.S., the rate of knee replacements among individuals aged ≥ 65 years increased about eight-fold from 1979 (10 per 10,000 population) to 2002 (80 per 10,000 population) (7). By 2006, the rate increased further to 87 per 10,000 population in this age group (8). While this increase may be due to an increase in prevalence of knee pain or symptomatic knee osteoarthritis, we know of no assessment of the secular trend of knee pain and symptomatic knee osteoarthritis.
Obesity is a strong risk factor for knee pain and both aging and obesity increase the risk of symptomatic knee osteoarthritis (4, 9). Given the increase in the prevalence of obesity and population aging, one would expect prevalence of knee pain and symptomatic knee osteoarthritis to also increase. We described the prevalence of knee pain and symptomatic knee osteoarthritis over the past 20 years using data from NHANES and Framingham Osteoarthritis (FOA) Studies. We examined whether a change in prevalence of knee pain and symptomatic osteoarthritis could be attributed to age, body mass index (BMI), and radiographic knee osteoarthritis.
METHODS
Population
National Health and Nutrition Examination Survey (NHANES)
Cross-sectional surveys of nationally representative samples of the non-institutionalized US population were conducted by the National Center for Health Statistics. Surveys have been conducted in waves from 1971–75 (NHANES I (10)), 1976–80 (NHANES II (11)), 1988–1994 (NHANES III (12)), as well as the continuous NHANES from 1999–2000 (13), 2001–02 (14), and 2003–04 (15,16).
In a supplemental survey for NHANES I (1974–1975) (17) and NHANES II, participants from 60 to 74 years were asked about knee pain. The age range was greater in NHANES III and later surveys, but to be consistent, we restricted all NHANES data analysis to people 60 to 74 years. Moreover, in the first 2 NHANES, White and Mexican Americans were classified as one racial group; thus, our White group included Mexican Americans across all time points. We also explored knee pain among African Americans.
FOA Study
Participants included members of the Framingham Heart Study (Original Cohort), the Framingham Offspring Study (Offspring Cohort), and a newly recruited cohort from the community of Framingham, Massachusetts (Community Cohort). The FOA Study (18–21) was an ancillary study of the Framingham Heart Study, a population-based study of risk factors for cardiovascular disease with biennial examinations beginning in 1948. At the 18th biennial examination (1983–85), 1805 participants from the Original Cohort were evaluated for the presence of knee osteoarthritis. These individuals were similar in age, sex, and knee symptoms to those from the parent Heart Study. At the 22nd examination (1992–93), the osteoarthritis assessment was repeated for this group. The Framingham Offspring Study began in 1971–1975 and included surviving descendants of original Heart Study cohort and spouses of those descendants. As part of a callback visit between 1992 and 1995, 1779 Offspring members were evaluated for knee osteoarthritis. This assessment was repeated between 2002 and 2005 for the Offspring Cohort. The Community Cohort consisted of 1039 members randomly selected from the Framingham population but excluded members of the Heart Study. Individuals from the Community Cohort (all age 50 years of over) were evaluated for osteoarthritis between 2002 and 2005. Although a history of a bilateral TKR or rheumatoid arthritis precluded participation, selection was not based on presence or absence of knee pain or osteoarthritis. The institutional review board of Boston University Medical Center approved the study. The majority of subjects in the FOA Study were White.
Outcomes
Knee Pain Assessment
Data on knee pain were collected in six NHANES (i.e., I, II, III, and the three later surveys labeled as the ‘continuous NHANES’). For the first three surveys, subjects were asked about pain in or around the knee on most days for at least one month or six weeks. Also in the first two NHANES, those who answered “no” to a screening question on pain or aching in any joints on most days and therefore did not provide a response for the subsequent knee pain question (375 and 623 persons, respectively), got coded as “no” for knee pain. For NHANES III there was no recoding necessary. Starting in 1999, the question on knee and joint pain in general was changed from a question about pain ever experienced to pain in the last 12 months, in addition to symptoms that must be present for at least one month (Table 1).
Table 1.
Knee Pain Questions in the Framingham Osteoarthritis Study and NHANES
| Study | Knee Pain Query by Time Period | ||
|---|---|---|---|
| NHANES I, II, III | 1974–75 | 1976–1980 | 1988–1994 |
| “Have you ever had pain or aching in any of your joints on most days for AT LEAST 1 MONTH?” | “Have you had pain or aching in any joint other than the back or neck on most days for at least six weeks?” | “Have you ever had pain in your knees on most days for at least 6 weeks? This also includes aching and stiffness.” | |
| “Have you ever had pain in or around the knee including the back of the knee on most days for AT LEAST 1 MONTH?” | “Which joints were painful?” Knee? | ||
| NHANES 1999–2004 | 1999–2000 | 2001–2002 | 2003–2004 |
| “During the past 12 months, have you had pain, aching stiffness or swelling in or around a joint? [Do not include neck pain]” | “During the past 12 months, have you had pain, aching stiffness or swelling in or around a joint? [Do not include neck pain]” | “During the past 12 months, have you had pain, aching stiffness or swelling in or around a joint? [Do not include neck pain]” | |
| “Were these symptoms present on most days for at least 1 month?” | “Were these symptoms present on most days for at least 1 month?” | “Were these symptoms present on most days for at least 1 month?” | |
| “Please look at this card and give me the joints that were affected.” | “Please look at this card and give me the joints that were affected.” | “Please look at this card and give me the joints that were affected.” | |
| …Knee…. | …Knee… | …Knee… | |
| FOA Study | 1983–85 | 1992–95 | 2002–05 |
| a. “Have you ever had pain lasting at least a month in or around the knee, including the back of the knee?” If so, ”When did the pain start?” and “When was the last time you had this pain?” | a. “Have you ever had pain lasting at least a month in or around the knee, including the back of the knee?” If so, ”When did the pain start?” and “When was the last time you had this pain?” | a. “Have you ever had pain lasting at least a month in or around the knee, including the back of the knee?” If so, ”When did the pain start?” and “When was the last time you had this pain?” | |
Abbreviations: NHANES-National Health and Nutrition Examination Survey; FOA-Framingham Osteoarthritis Study
Knee pain was assessed in the FOA Study at three exams approximately 10 years apart. Questions were asked about pain in or around the knee lasting at least one month over the previous 12 months for members of the Original Cohort at the 1983–85 (time point 1) and 1992–93 (time point 2) exams. The Offspring was studied in 1992–95 and Offspring and Community cohorts were assessed in 2002–2005 (time point 3). Only the age group 70 years and older was consistently studied across three periods with regard to current knee pain so we restricted comparisons to them. Subjects were considered as having knee pain if they responded positively to the question that knee pain must have occurred in the past 12 months as determined by additional response to a question about the last time pain occurred.
Radiographic assessment
Framingham Osteoarthritis Study subjects had bilateral weight-bearing anteroposterior knee radiographs. For the community cohort, weight bearing posteroanterior views were obtained and in the Offspring, we obtained both posteroanterior and anteroposterior views. Knee radiographic features were assessed by a musculoskeletal radiologist using the Kellgren-Lawrence (KL) scale of 0 to 4 based on the presence of osteophytes, joint space narrowing, sclerosis, and cysts. A knee was considered as having radiographic osteoarthritis if its KL score was ≥ 2. Additionally, we classified a knee as having severe radiographic osteoarthritis if the score was ≥ 3. For those subjects who got posteroanterior and anteroposterior views, we found that the method of acquisition did not affect prevalence and for this study, used the reading of the anteroposterior view to be consistent with earlier x-rays.
Owing to the importance of using the same definition over time, we evaluated agreement in defining radiographic osteoarthritis (KL grade ≥2) between the musculoskeletal radiologist who read films from the Framingham Original Cohort (reader 1) with reader 2 who read the films from the Offspring and Community Cohorts. The inter-reader kappa was 0.83 (95% CI: 0.63, 1.0).
Symptomatic osteoarthritis of the knee
Symptomatic osteoarthritis was defined in the FOA Study if the participant reported knee pain as previously defined and showed radiographic osteoarthritis in the painful knee.
Covariates
Body mass index (BMI) was calculated from measured height and weight (kilogram/meter2). In the FOA Study, height was measured without shoes using a stadiometer, weight using balance beam scale without heavy clothing or shoes. Similarly, we used measured height and weight from NHANES.
Data Analysis
Using marginal standardization with logistic regression, we estimated the standardized prevalence of knee pain from NHANES and FOA Study, and that of radiographic and symptomatic knee osteoarthritis from the FOA Study, adjusting for age (years), and BMI (25–29 kg/m2, 30–34, 35–39, and ≥ 40 compared with <25 as referent) (22). We also compared the prevalence of knee pain and symptomatic knee osteoarthritis from later exams with those of earlier exams using the ratio of the prevalence estimates adjusting for age and BMI. Bootstrapping methods were applied to estimate 95% confidence intervals (CI) around the estimates of prevalence and prevalence ratios (22). We tested for trends in the age and BMI-adjusted prevalence estimates over time.
For the three later NHANES, we used the knee pain prevalence from 1999–2000 as the reference for comparisons with 2001–2002 and 2003–2004. Appropriate sampling weights were used to account for NHANES cluster design and multistage sampling. Because approximately10% of participants in some NHANES surveys had missing BMI, we used IVEware within SAS which is a sequential regression approach (23) to create five data sets assuming that BMI was missing at random. To impute missing BMI, we used age, gender, race, education, marital status, poverty index, self-report height and weight, and self-reported medical conditions such as heart attacks and diabetes. We then combined estimates from the five imputed data sets (24).
In addition, we performed several sensitivity analyses in the FOA Study. We excluded data from the Offspring Cohort to see if results would change. We also analyzed knee pain trend using a different question. At 1992–95 and 2002–05 exams we asked all FOA participants about knee pain using a different question as follows: “On most days do you have pain, aching or stiffness in either of your knees.” We also performed an analysis of the trend in radiographic osteoarthritis among those 60 years or older.
Two-tailed tests of statistical significance were based on α level of 0.05. Analyses were performed using STATA, Version 11 (StatCorp LP, College Station, TX, USA), and PC SAS, Version 9.2 (SAS Institute, Gary, NC, USA).
Role of the Funding Source
Study sponsors played no role in the design and conduct of the study including the data management, analysis, and interpretation of the data, or in the preparation, review, and approval of the manuscript.
RESULTS
For the first three NHANES analysis, we included 1382, 4342, and 3682 participants respectively. In the subsequent three NHANES, there were 1066, 1011, and 1054 participants from1999–2000, 2001–02, and 2003–04, respectively. Also included were 902, 1132, and 671 members of the FOA Study over the three time periods. Additional descriptive data are shown in Appendix Tables 1 and 2.
As shown in Table 2, independent of age, there was an increase in the prevalence of knee pain over time in NHANES and FOA Studies and for symptomatic osteoarthritis in the Framingham Study, as indicated by increasing age-adjusted prevalence ratios (PR). For example, the age-adjusted prevalence ratio for knee pain was 3.89 for Time 3 vs. 1 and 1.49 for Time 2 vs. 1 in Framingham men, and 2.38 for Time 3 vs. 1 and 1.22 for Time 2 vs. 1 in Framingham women. Additional adjustment for BMI among men resulted in a 10% decrease in the PR for knee pain from 1971 to 1994 in NHANES (Time 3 vs. 1, from PR of 1.85 to 1.66), and a 18% decrease in the PR in the FOA Study from 1983 to 2005 (PR of 3.89 to 3.18), as well as a 21% of the decrease in the prevalence ratio for symptomatic knee osteoarthritis (PR of 3.54 to 2.81). Among women, the corresponding percent decreases after additionally controlling for BMI were 7%, 12%, and 22%, respectively.
Table 2.
Temporal Trend of Knee Pain and Knee Osteoarthritis in NHANES and Framingham Osteoarthritis Study
| Males | Females | |||
|---|---|---|---|---|
| Time 2 vs. 1 PR (95% CI) |
Time 3 vs. 1 PR (95% CI) |
Time 2 vs. 1 PR (95% CI) |
Time 3 vs. 1 PR (95% CI) |
|
| NHANES Knee Pain (1971–1994*) | ||||
| Crude | 1.39 (1.01, 1.91) | 1.86 (1.30, 2.49) | 1.21 (0.95, 1.56) | 1.79 (1.40, 2.33) |
| Adjusted for Age | 1.40 (1.06, 1.92) | 1.85 (1.33, 2.54) | 1.21 (0.92, 1.57) | 1.79 (1.35, 2.35) |
| Adjusted for Age, BMI | 1.36 (1.03, 1.89) | 1.66 (1.22, 2.31) | 1.22 (0.95, 1.62) | 1.66 (1.29, 2.21) |
| NHANES Knee Pain (1999–2004†) | ||||
| Crude | 1.13 (0.78, 1.69) | 1.31 (0.96, 2.00) | 1.42 (1.03, 1.95) | 1.29 (0.96, 1.85) |
| Adjusted for Age | 1.14 (0.75, 1.65) | 1.32 (0.91, 1.65) | 1.42 (1.02, 1.96) | 1.30 (0.91, 1.77) |
| Adjusted for Age, BMI | 1.13 (0.80, 1.64) | 1.24 (0.89, 1.80) | 1.37 (1.00, 1.90) | 1.34 (0.97, 1.85) |
| FOA Study Knee Pain (1983–2005‡) | ||||
| Crude | 1.39 (0.87, 2.14) | 3.87 (2.70, 5.77) | 1.26 (0.96, 1.66) | 2.39 (1.87, 3.08) |
| Adjusted for Age | 1.49 (0.89, 2.42) | 3.89 (2.74, 5.78) | 1.22 (0.93, 1.60) | 2.38 (1.88, 3.04) |
| Adjusted for Age, BMI | 1.31 (0.79, 2.14) | 3.18 (2.14, 4.93) | 1.16 (0.90, 1.54) | 2.09 (1.60, 2.75) |
| FOA Study Knee Symptomatic OA (1983–2005‡) | ||||
| Crude | 1.33 (0.76, 2.53) | 3.52 (2.17, 5.76) | 1.31 (0.95, 1.95) | 2.04 (1.47, 2.97) |
| Adjusted for Age | 1.49 (0.80, 2.75) | 3.54 (2.24, 6.46) | 1.20 (0.85, 1.73) | 2.04 (1.46, 2.92) |
| Adjusted for Age, BMI | 1.36 (0.75, 2.52) | 2.81 (1.72, 5.00) | 1.13 (0.82, 1.62) | 1.60 (1.15 2.32) |
NHANES 1971–1994: Time 1=1974–1975, Time 2=1976–1980, Time 3=1988–1994 among Non-Hispanic White and Mexican American for people 60 to 74 years of age.
NHANES 1999–2004: Time 1=1999–2000, Time 2=2001–2002, Time 3=2003–2004 among Non-Hispanic White and Mexican American for people 60 to 74 years of age.
Framingham OA Study 1983–2005: Time 1=1983–1985, Time 2=1992–1995, Time 3=2002–2005, using the query on knee pain in the past month over the previous 12 months for those 70 years or older.
Abbreviations: NHANES-National Health and Nutrition Examination Survey; FOA-Framingham Osteoarthritis Study; BMI-body mass index; PR-prevalence ratio
The age and BMI-adjusted prevalence of knee pain increased by 66% in NHANES from 1974 to 1994 (figure 1), with statistically significant trends for both White men (p-trend=0.003) and women (p-trend=0.002). In the subsequent three NHANES, prevalence of knee pain increased further from 1999 to 2004 in White women (p-trend=0.012), while the increase was borderline statistically significant for White men (p-trend=0.090). For African American participants, there was also a trend toward an increase in knee pain although it was statistically significant only in women (please see legend of Figure 1).
Figure 1.
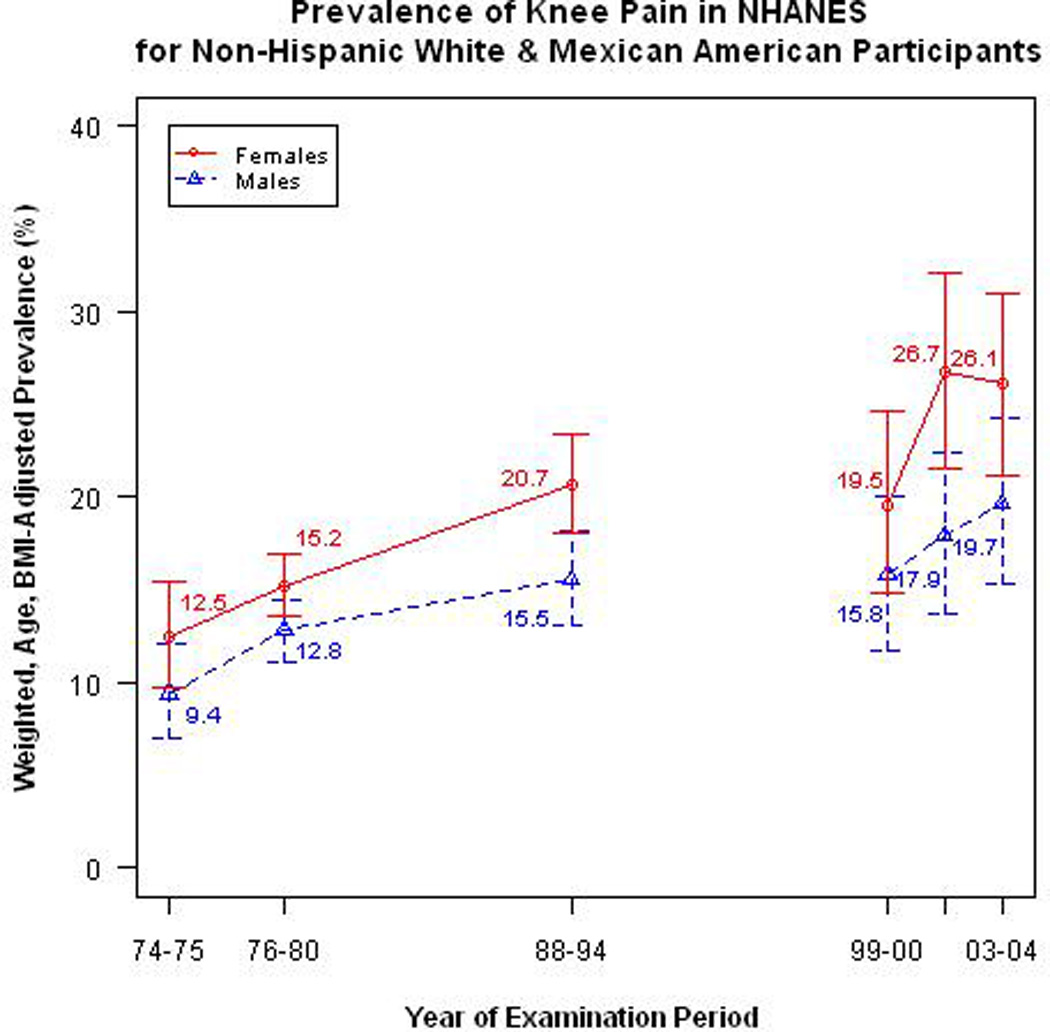
Sampling weighted and age and BMI-adjusted prevalence, along with 95% Confidence Intervals, of Knee Pain for Non-Hispanic White & Mexican American Participants across 6 NHANES surveys between 1971 and 2004. Solid line is for female and broken line for males. Test for trend from 1974 to 1994 in men (p = 0.003) and women (p = 0.002). Test for trend from 1999 to 2004 in men (p = 0.090) and women (p = 0.012).
The corresponding age and BMI-adjusted prevalence of knee pain in African American men from 1974 to 1994, was 12.6%, 10.7%, and 15.6%; p-trend=0.35. The corresponding prevalence in women over the first three NHANES was 16.7%, 22.0%, and 28.7%; p-trend=0.037. For the subsequent three continuous NHANES, prevalence of knee pain for men was 7.9%, 16.6%, and 18.6%; p-trend=0.22. The corresponding prevalence of knee pain in women over the later three NHANES was 13.8%, 22.2%, and 29.9%; p-trend=0.003.
As shown in Figure 2, even after adjusting for age and BMI, the prevalence of knee pain from the FOA Study doubled over a 20-year period in women and tripled in men (all p-trend < 0.001). Moreover, among participants without radiographic osteoarthritis, the prevalence of knee pain tripled in women and more than quadrupled in men over 20 years. The age and BMI-adjusted prevalence of knee pain over the corresponding three time periods was 8.0%, 10.0%, and 24.7% in women and 3.9%, 4.8%, and 16.5% in men. Among those with radiographic osteoarthritis, the prevalence estimates were 26.3%, 31.1%, and 48.5% in women, and 19.0%, 21.7%, and 49.4% in men. (all p’s for trend < 0.001.)
Figure 2.
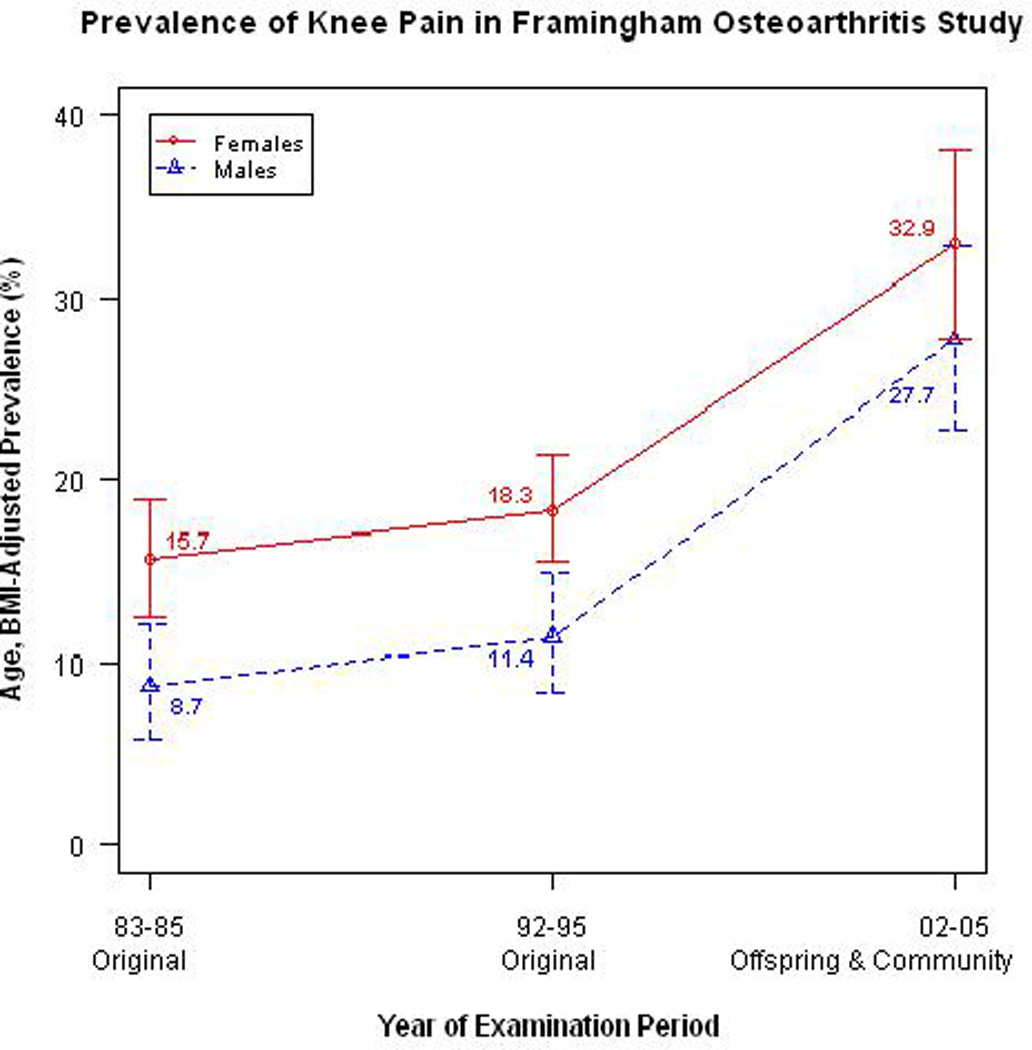
Age and BMI-adjusted prevalence and 95% Confidence Intervals of Knee Pain for Framingham OA Study across 3 examination periods between 1983 and 2005. Solid line is for female and broken line for males. Test for trend in men (p < 0.001) and women (p < 0.001). Framingham Osteoarthritis Study cohorts between 1983 through 2005 for knee pain outcome: Original 1983–5 and 1992–5, Offspring and Community sample 2002–5.
Adjusting for age and BMI, the prevalence of symptomatic knee osteoarthritis in Framingham (Figure 3) approximately tripled in men (p-trend<0.001) and almost doubled in women over a 20-yr period (p-trend=0.006). However, there was no substantial change in the age and BMI-adjusted prevalence of radiographic osteoarthritis over this same period for men (p for trend=0.82), and it actually may have decreased for women (p for trend=0.036). Similarly, there was no increase in the age and BMI-adjusted prevalence of radiographic osteoarthritis among those 60 years or older or in the prevalence of severe radiographic osteoarthritis (K/L ≥ 3) for both men and women.
Figure 3.
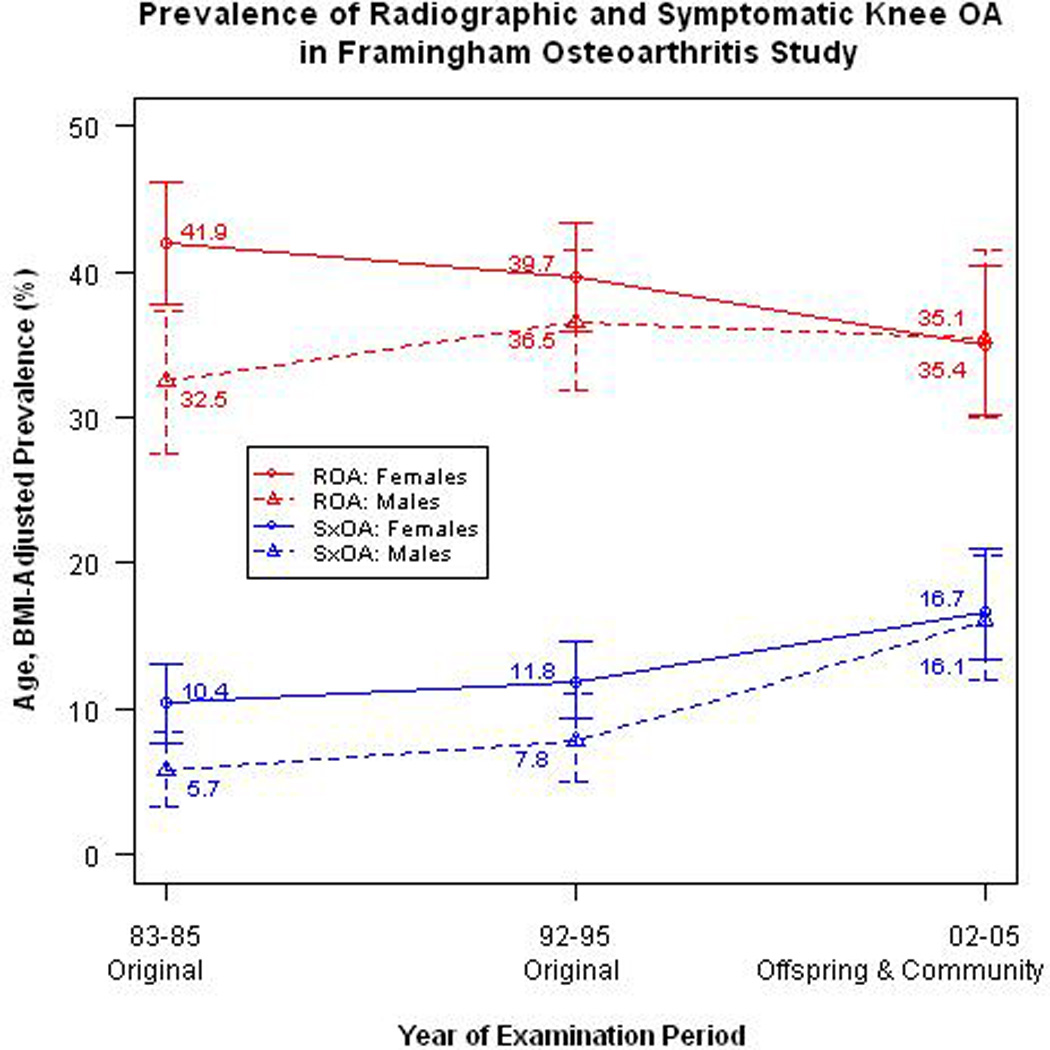
Age and BMI-adjusted prevalence and 95% Confidence Intervals of Radiographic and Symptomatic knee OA across 3 examination periods between 1983 and 2005. ROA, radiographic osteoarthritis of the knee (Kellgren-Lawrence score ≥ 2); test for trend from 1983–2005 in men (p = 0.82) and women (p = 0.036). SxOA: symptomatic osteoarthritis of the knee (knee pain in the ROA knee); test for trend from 1983–2005 in men (p < 0.001) and women (p = 0.006). Framingham Osteoarthritis Study cohorts between 1983 through 2005 for symptomatic knee osteoarthritis outcome: Original 1983–5 and 1992–5, Offspring and Community sample 2002–5; and for radiographic osteoarthritis outcome: Original cohort 1983–5 and 1992–5, Offspring 1992–95 and 2002–5, and Community sample 2002–5.
Sensitivity analysis excluding members of the Offspring Cohort showed similar trends to those seen in Figures 2 and 3. In addition, using the query on knee pain on most days in Framingham Study participants who were 60 years or older at examinations in 1992–95 and 2002–2005 showed a similar trend. The age and BMI-adjusted prevalence of knee pain among individuals aged 60 years or older increased from 19.7% to 26.8% among men, and from 27.0% to 33.5% among women. Using this knee pain question to define symptomatic knee osteoarthritis, the corresponding age and BMI-adjusted prevalence of symptomatic knee osteoarthritis increased from 9.0% to 15.0% in men and from 13.9% to 18.0% in women.
DISCUSSION
Using data from two community based studies, we found that the age and BMI-adjusted prevalence of knee pain over a 20 year-period has increased for Non-Hispanic White and Mexican American men and women and African American women. In the Framingham Study, there was an increase in symptomatic but not radiographic knee osteoarthritis. Adjusting for age did not substantially alter the prevalence estimate for knee pain or symptomatic knee osteoarthritis over time whereas additionally adjusting for BMI resulted in a 10–25% decrease in prevalence ratios. In the Framingham Study, knee pain prevalence increased over time for those with and without radiographic osteoarthritis and in both men and women.
While our study is, to our knowledge, the first to evaluate a secular trend in knee pain, others have examined the prevalence of arthritis in general over time. Leveille and co-authors (25) did not find any difference in the prevalence of self-reported doctor-diagnosed arthritis across four birth cohorts of baby boomers and their predecessors. Kopec et al. (26) using administrative data reported that between 1996 and 2004, there was a 13.6% increase in age-adjusted incidence of clinical osteoarthritis (OA) among Canadian women with at least 1 medical visit or hospitalization for osteoarthritis (14.7 vs. 16.7 per 1,000 persons); there was no increase in men (11.3 vs. 11.6 per 1,000 persons). These studies did not examine knee osteoarthritis specifically.
The prevalence of musculoskeletal pain in sites outside the knee may also be on the rise. The prevalence of low back pain increased by 31% over a 16-year period (1990–2006) in Great Britain (27). In the United States, Freburger et al. (28) reported that the prevalence of chronic, impairing lower back pain increased dramatically from 3.9% in 1992 to 10.2% in 2006 using data collected in a North Carolina household survey, although no such trend was seen in National Health Interview Surveys (29). Researchers attributed the rise in low back pain prevalence to an increasing awareness and perception of pain (27). This same increase may explain the increase in reporting of knee pain. Moreover, people from younger generations may be more willing to report pain without fear of being judged as compared with people from older generations.
The increase in knee pain in the United States we report may underlie the dramatic recent increase in TKR found in Great Britain and the U.S. It is evidently not explained by increasing availability of orthopedic surgeons trained to do replacements (30). TKR and knee pain are different and, while it seems reasonable to assert that the increase in the prevalence of knee pain translates into higher demand for knee replacement, we did not follow our subjects to the point of knee replacement. Further investigation of the causes of the increased rate of knee replacement is needed.
We also acknowledge that in the Framingham Study, the increase in knee pain without a commensurate increase in radiographic osteoarthritis (KL≥2) or severe radiographic osteoarthritis (KL≥3) cannot be easily explained. It is possible that mild forms of osteoarthritis not visualized on the x-ray, or disease in the patellofemoral compartment not seen on the anteroposterior film may have increased in prevalence over time. Non-osteoarthritic knee pain could also be increasing as a result of the rise in obesity.
Our study has certain limitations. It would have been ideal to have the exact same question about knee pain in each survey of NHANES (see Table 1). However, all questions from NHANES I, II and III were similar and should not have produced marked differences in prevalence. Unlike NHANES I, II and III, identical questions about current knee pain were used in the FOA Study and in the later continuous NHANES examinations. Also, while the original Cohort of the FOA Study was representative of the population-based Framingham Heart Study and the Community Cohort was representative of the population of Framingham, Massachusetts, some members of the Offspring Cohort were related to members of the Original Cohort. Sensitivity analyses excluding the Offspring Cohort showed similar trends. The Community Cohort in Framingham was recruited using random digit dialing and subjects were not selected on the basis of having knee or other joint problems (20). Finally, we cannot rule out birth cohort or generational effects as a possible explanation for the increasing prevalence in the reporting of knee pain over time. If this were the case, knee pain would be dependent on factors common to birth cohorts and not necessarily changing in a secular fashion. Lastly, subjects from the different Framingham cohorts may be biased representatives of knee pain prevalence from their parent cohorts and this bias may have changed with time, with those in later examinations more likely to be the ones with knee pain.
Despite the limitations, our study has several strengths. We assessed knee pain similarly over three time periods in a population-based study of knee osteoarthritis in older adults. Moreover, we could radiographically define knee osteoarthritis and were able to corroborate our findings regarding the prevalence of knee pain in the FOA Study with that from nationally-representative samples. Furthermore, Framingham data permitted us to extend knee pain prevalence information from the NHANES 60–74 year range to a slightly older group, those 70 years or older.
In conclusion, our findings suggest that there has been a marked recent increase in the prevalence of knee pain and in Framingham an increase in symptomatic knee osteoarthritis. These increases may explain the surge in knee replacement surgeries and suggest a bigger burden of knee pain in our society than previously thought. Even though our findings were consistent across two studies, additional replication in other populations is needed.
ACKNOWLEDGMENTS
We thank the Framingham Osteoarthritis Study research team, and study participants for the contribution of their time, effort, and dedication. We are also grateful to the National Center for Health Statistics for access to NHANES data. Funding for this project was provided by the American College of Rheumatology Research and Education Foundation Rheumatology Scientist Development Award, the NIH AR47785 and AG18393, and support from NHLBI, Framingham Heart Study (NHLBI/NIH Contract #N01-HC-25195) and the Boston University School of Medicine. Moreover, the first, second, and corresponding authors had full access to all the data in the study and take responsibility for the integrity of the data and the accuracy of the data analysis.
Appendix
Appendix Table 1.
Number of Men and Women by Study, Time Period, Cohort/Outcome
| STUDY | MEN | WOMEN | |||||
|---|---|---|---|---|---|---|---|
| NHANES | Time Period | 1974–75 | 1976–80 | 1988–94 | 1974–75 | 1976–80 | 1988–94 |
| White/Mexican American | 588 | 1829 | 1368 | 613 | 2070 | 1429 | |
| African American | 91 | 208 | 447 | 90 | 235 | 438 | |
| NHANES | Time Period | 1999–2000 | 2001–02 | 2003–04 | 1999–2000 | 2001–02 | 2003–04 |
| White/Mexican American | 427 | 387 | 439 | 422 | 389 | 422 | |
| African American | 108 | 117 | 94 | 109 | 118 | 99 | |
| FOA | Time Period | 1983–85 | 1992–951 | 2002–052 | 1983–852 | 1992–953 | 2002–052 |
| Radiographic Knee OA | 364 Original | 371 Original | 115 Community | 537 Original | 690 Original | 140 Community | |
| 31 Offspring | 181 Offspring | 34 Offspring | 234 Offspring | ||||
| Knee Pain/Symptomatic OA | 361 Original | 359 Original | 115 Community | 524 Original | 631 Original | 135 Community | |
| 181 Offspring | 233 Offspring | ||||||
Number of participants who dropped out of the respective BMI-adjusted radiographic and knee pain/symptomatic osteoarthritis analyses due to missing BMI data:
12 and 7;
1 and 1;
39 and 8;
Abbreviations: NHANES-National Health and Nutrition Examination Surveys; FOA-Framingham Osteoarthritis Study; BMI-body mass index; OA-osteoarthritis
Appendix Table 2.
Mean (SD) Age and BMI in Men and Women According to Study, Time Period, and Cohort
| STUDY | MEN | WOMEN | |||||
|---|---|---|---|---|---|---|---|
| NHANES* | Time Period | 1974–75 | 1976–80 | 1988–94 | 1974–75 | 1976–80 | 1988–94 |
| White/Mexican American | Age | 66.7 (4.1) | 65.9 (4.1) | 67.2 (4.2) | 66.5 (4.2) | 66.2 (4.2) | 67.4 (4.2) |
| BMI | 25.4 (3.8) | 25.8 (3.9) | 27.4 (4.2) | 26.8 (5.1) | 26.5 (5.5) | 27.9 (5.8) | |
| African American | Age | 66.6 (3.8) | 66.4 (4.3) | 67.0 (4.2) | 66.5 (4.3) | 66.2 (4.2) | 66.7 (4.0) |
| BMI | 25.1 (4.9) | 25.3 (4.4) | 26.7 (5.0) | 27.4 (6.6) | 28.5 (5.6) | 30.0 (6.8) | |
| NHANES | Time Period | 1999–2000 | 2001–02 | 2003–04 | 1999–2000 | 2001–02 | 2003–04 |
| White/Mexican American | Age | 66.2 (4.3) | 67.2 (4.4) | 66.9 (4.4) | 66.6 (4.3) | 66.6 (4.4) | 66.5 (4.3) |
| BMI | 28.7 (4.9) | 28.6 (4.6) | 28.9 (5.3) | 29.1 (6.0) | 29.2 (6.2) | 29.1 (6.0) | |
| African American | Age | 66.2 (4.3) | 65.7 (3.9) | 66.0 (4.1) | 65.9 (4.4) | 66.0 (4.4) | 65.3 (4.0) |
| BMI | 27.8 (5.5) | 28.4 (6.2) | 28.1 (5.0) | 32.0 (7.2) | 31.3 (5.9) | 31.9 (6.9) | |
| FOA | Time Period | 1983–85 | 1992–95 | 2002–05 | 1983–85 | 1992–95 | 2002–05 |
| Age | 76.1 (5.2) | 78.5 (5.2) | 76.0 (4.5) | 76.1 (4.9) | 79.8 (6.0) | 75.9 (4.3) | |
| BMI | 25.4 (3.2) | 25.9 (3.9) | 28.5 (4.5) | 25.1 (4.5) | 24.9 (5.0) | 27.7 (5.5) | |
Average NHANES BMI based on available BMI data
Abbreviations: SD-standard deviation; NHANES-National Health and Nutrition Examination Surveys; FOA-Framingham Osteoarthritis Study; BMI-body mass index
Footnotes
The authors have no conflicts of interest to disclose.
Authors’ Contributions:
UDTN helped to design the study, contributed to the data analysis and statistical interpretation, and drafted the manuscript. YQZ helped to conceive and design the study, contributed to the data acquisition, analysis and statistical interpretation, and critically reviewed the manuscript. YZ, JN, BZ, and PA each helped with particular aspects of data preparation, analysis and interpretation, and contributed to the critical review of the manuscript. DTF led the conception of the study, contributed to data acquisition and interpretation of the data, and helped to draft and revise the manuscript. All authors have read and approved the final manuscript.
REFERENCES
- 1.Jinks C, Jordan K, Croft P. Measuring the population impact of knee pain and disability with the Western Ontario and McMaster Universities Osteoarthritis Index (WOMAC) Pain. 2002;100:55–64. doi: 10.1016/s0304-3959(02)00239-7. [DOI] [PubMed] [Google Scholar]
- 2.Grotle M, Hagen KB, Natvig B, Dahl FA, Kvien TK. Prevalence and Burden of Osteoarthritis: Results from a Population Survey in Norway. Journal of Rheumatology. 2008;35:677–684. [PubMed] [Google Scholar]
- 3.Peat G, McCarney R, Croft P. Knee pain and osteoarthritis in older adults: a review of community burden and current use of primary health care. Ann Rheum Dis. 2001;60:91–97. doi: 10.1136/ard.60.2.91. [DOI] [PMC free article] [PubMed] [Google Scholar]
- 4.Felson DT, Zhang Y. An update on the epidemiology of knee and hip osteoarthritis with a view to prevention. Arthritis & Rheumatism. 1998;41:1343–1355. doi: 10.1002/1529-0131(199808)41:8<1343::AID-ART3>3.0.CO;2-9. [DOI] [PubMed] [Google Scholar]
- 5.Zeni JA, Jr, Axe MJ, Snyder-Mackler L. Clinical predictors of elective total joint replacement in persons with end-stage knee osteoarthritis. BMC Musculoskeletal Disorders. 2010;11:86. doi: 10.1186/1471-2474-11-86. [DOI] [PMC free article] [PubMed] [Google Scholar]
- 6.Culliford DJ, Maskell J, Beard DJ, Murray DW, Price AJ, Arden NK. Temporal trends in hip and knee replacement in the United Kingdom: 1991 TO 2006. The Journal of Bone and Joint Surgery-British Volume. 2010;92:130–135. doi: 10.1302/0301-620X.92B1.22654. [DOI] [PubMed] [Google Scholar]
- 7.(NCHS) Centers for Disease Control and Prevention (CDC) National Center for Health Statistics. Rate of Total Knee Replacement for Persons Aged >65 Years, by Sex --- United States, 1979--2002. MMWR. 2005;54:179. [Google Scholar]
- 8.Cisternas MG, Murphy L, Croft JB, Helmick CG. Racial Disparities in Total Knee Replacement Among Medicare Enrollees --- United States, 2000--2006. MMWR. 2009;58:133–138. [PubMed] [Google Scholar]
- 9.Marks R. Obesity Profiles with Knee Osteoarthritis: Correlation with Pain, Disability, Disease Progression. Obesity. 2007;15:1867–1876. doi: 10.1038/oby.2007.221. [DOI] [PubMed] [Google Scholar]
- 10.Centers for Disease Control and Prevention (CDC) National Health and Nutrition Examination Survey Questionnaire. Hyattsville MD: U.S. Department of Health.. NHANES I; National Center for Health Statistics (NCHS) Available: http://cdcgov/nchs/nhanes/nhanesihtm. [Google Scholar]
- 11.Centers for Disease Control and Prevention (CDC) National Health and Nutrition Examination Survey Questionnaire. Hyattsville MD: U.S. Department of Health and Human Services, Centers for Disease Control and Prevention. NHANES II; National Center for Health Statistics (NCHS) Available: http://cdc.gov/nchs/nhanes/nhanesii.htm. [Google Scholar]
- 12.Centers for Disease Control and Prevention (CDC) National Health and Nutrition Examination Survey Questionnaire. Hyattsville MD: U.S. Department of Health. NHANES III; National Center for Health Statistics (NCHS) Available: http://cdc.gov/nchs/nhanes/nh3data.htm. [Google Scholar]
- 13.Centers for Disease Control and Prevention (CDC) National Health and Nutrition Examination Survey Questionnaire. Hyattsville MD: U.S. Department of Health NHANES 1999–2000; National Center for Health Statistics (NCHS) Available at: http://cdcgov/nchs/nhanes/nhanes1999-2000/nhanes99_00htm. [Google Scholar]
- 14.Centers for Disease Control and Prevention (CDC) National Health and Nutrition Examination Survey Questionnaire. Hyattsville MD: U.S. Department of Health NHANES 2001–2002; National Center for Health Statistics (NCHS) Available at: http://cdcgov/nchs/nhanes/nhanes2001-2002/nhanes01_02htm. [Google Scholar]
- 15.Centers for Disease Control and Prevention (CDC) National Health and Nutrition Examination Survey Questionnaire. Hyattsville MD: U.S. Department of Health NHANES 2003–2004; National Center for Health Statistics (NCHS) Available at: http://cdcgov/nchs/nhanes/nhanes2003-2004/nhanes03_04htm. [Google Scholar]
- 16.Wang CY, Haskell WL, Farrell SW, LaMonte MJ, Blair SN, Curtin LE, et al. Cardiorespiratory Fitness Levels Among US Adults 20–49 Years of Age: Findings From the 1999–2004 National Health and Nutrition Examination Survey. Am J Epidemiol. 2010;171:426–435. doi: 10.1093/aje/kwp412. [DOI] [PubMed] [Google Scholar]
- 17.Centers for Disease Control and Prevention (CDC) National Health and Nutrition Examination Survey Questionnaire. Hyattsville MD: U.S. Department of Health Public Use Data Tape Documentation; National Center for Health Statistics (NCHS) Health Care Needs, General Medical History Supplement, and Respiratory and Cardiovascular Supplements, Ages 25–74. Tape Number 4091. National Health and Nutrition Examination Survey, 1971–1975. [Google Scholar]
- 18.Felson DT, Naimark A, Anderson J, Kazis L, Castelli W, Meenan RF. The prevalence of knee osteoarthritis in the elderly: the Framingham Osteoarthritis Study. Arthritis & Rheumatism. 1987;30:914–918. doi: 10.1002/art.1780300811. [DOI] [PubMed] [Google Scholar]
- 19.Felson DT, Couropmitree NN, Chaisson CE, et al. Evidence for a Mendelian gene in a segregation analysis of generalized radiographic osteoarthritis. Arthritis & Rheumatism. 1998;41:1064–1071. doi: 10.1002/1529-0131(199806)41:6<1064::AID-ART13>3.0.CO;2-K. [DOI] [PubMed] [Google Scholar]
- 20.Englund M, Guermazi A, Gale D, et al. Incidental meniscal findings on knee MRI in middle-aged and elderly persons. N Eng J Med. 2008;359:1108–1115. doi: 10.1056/NEJMoa0800777. [DOI] [PMC free article] [PubMed] [Google Scholar]
- 21.Hunter DJ, Niu JB, Zhang Y. Premorbid knee osteoarthritis is not characterised by diffuse thinness: the Framingham Osteoarthritis Study. Ann Rheum Dis. 2008;67:1545–1549. doi: 10.1136/ard.2007.076810. [DOI] [PMC free article] [PubMed] [Google Scholar]
- 22.Localio AR, Margolis DJ, Berlin JA. Relative risks and confidence intervals were easily computed indirectly from multivariable logistic regression. J Clin Epidemiol. 2007;60:874–882. doi: 10.1016/j.jclinepi.2006.12.001. [DOI] [PubMed] [Google Scholar]
- 23.Raghunathan TE, Lepkowski JM, Van Hoewyk J, Solenberger P. A multivariate technique for multiply imputing missing values using a sequence of regression models. Survey Methodology. 2001;27(1):85–95. Available from the University of Michigan Institute for Social Research, http://www.isr.umich.edu/src/smp/ive/ [Google Scholar]
- 24.Rubin DB. Multiple Imputation for Nonresponse in Surveys. New York: Wiley; 1987. [Google Scholar]
- 25.Leveille SG, Wee CC, Iezzoni LI. Trends in obesity and arthritis among baby boomers and their predecessors, 1971–2002. Am J Public Health. 2005;95:1607–1613. doi: 10.2105/AJPH.2004.060418. [DOI] [PMC free article] [PubMed] [Google Scholar]
- 26.Kopec JA, Rahman MM, Sayre EC, Cibere J, Flanagan WM, Aghajanian J, et al. Trends in physician-diagnosed osteoarthritis incidence in an administrative database in British Columbia, Canada, 1996–1997 through 2003–2004. Arthritis Rheum. 2008;59:929–934. doi: 10.1002/art.23827. [DOI] [PubMed] [Google Scholar]
- 27.Leijon O, Mulder M. Prevalence of low back pain and concurrent psychological distress over a 16-year period. Occup environ Med. 2009;66:137–139. doi: 10.1136/oem.2008.040337. [DOI] [PubMed] [Google Scholar]
- 28.Freburger JK, Holmes GM, Agans RP, Jackman AM, Darter JD, Wallace AS, et al. The rising prevalence of chronic low back pain. Arch Intern Med. 2010;196:251–258. doi: 10.1001/archinternmed.2008.543. [DOI] [PMC free article] [PubMed] [Google Scholar]
- 29.Deyo RA, Mirza SK, Martin BI. Back Pain Prevalence and Visit Rates Estimates From U.S. National Surveys, 2002. Spine. 2006;31:2724–2727. doi: 10.1097/01.brs.0000244618.06877.cd. [DOI] [PubMed] [Google Scholar]
- 30.Kim S. Changes in surgical loads and economic burden of hip and knee replacements in the US:1997–2004. Arthritis & Rheumatism. 2008;59:481–488. doi: 10.1002/art.23525. [DOI] [PubMed] [Google Scholar]