Abstract
Assays for real-time investigation of exocytosis typically measure what is released from the granule. From this inferences are made about the dynamics of membrane remodeling as fusion progresses from start to finish. We have recently undertaken a different approach to investigate the fusion process, by focusing not primarily on the granule, but rather its partner in exocytosis – the plasma membrane. We have been guided by the idea that biochemical interactions between the granule and plasma membranes before and during fusion, cause changes in membrane conformation. To enable study of membrane conformation, a novel imaging technique was developed combining polarized excitation of an oriented membrane probe (diI) with Total Internal Reflection Fluorescence Microscopy (pTIRFM). Because this technique measures changes in membrane conformation (or deformations) directly, its usefulness persists even after granule cargo reporter (catecholamine, or protein), is no longer present. In this mini-review, we first summarize the workings of pTIRFM. We then discuss the application of the technique to investigate deformations in the membrane preceding fusion, and later, during fusion pore expansion. Finally, we discuss how expansion of the fusion pore may be regulated by the GTPase activity of dynamin.
Keywords: TIRFM, dynamin, exocytosis, polarization, granule, chromaffin cells
Introduction
A fundamental means of intercellular communication in higher organisms is through the regulated release of neurotransmitter and hormone signaling molecules. Membrane impermeant neurotransmitters and hormones are stored in membrane-delimited secretory organelles, or granules. In neuroendocrine cells and neurons, localized increases in intracellular Ca2+ evoked by neurotransmitter-gated ion channels and/or voltage sensitive Ca2+ channels, trigger the fusion of secretory granules with the plasma membrane. This creates a fusion pore, or continuous aqueous passage, from inside the granule to outside the cell. As the fusion pore expands, the contents of the granule diffuse or are expelled into the extracellular space. Endocytosis follows to retrieve membranes and maintain cell surface area at roughly a constant level.
For many years, it was thought that the fusion of granule and plasma membranes was the final step in the regulation of transmitter release in secretory cells. More recent evidence suggests that mechanisms have evolved to regulate the release of transmitters after fusion has occurred by controlling the rate or the extent of fusion pore expansion (Berberian et al., 2009; Doreian et al., 2008; Han et al., 2004; Lam et al., 2008; Ngatchou et al., 2010; Zhou et al., 1996). It follows that the fused granule is also not obliged to collapse into the plasma membrane. Rather, it may be retrieved largely intact via a rapid form of endocytosis (Henkel and Almers, 1996) that does not require the formation of a clathrin coat (Artalejo et al., 1995). The presence of multiple pathways for the recycling of the granule membrane after fusion has important implications for secretion. In the adrenal chromaffin cell, a preparation used in our laboratories, constraining, or conversely, promoting fusion pore expansion will affect the extent to which intercellular signaling molecules (catecholamines and neuropeptides) are released into the circulation (Fulop et al., 2005). These circulating molecules modulate the activity of target organs such as the heart and lungs, affecting how they function during rest, and during stress. They may also have local autocrine and paracrine effects.
Because of the molecular revolution of the past two decades, we now know the identity of many of the important proteins involved in granule fusion and endocytosis. However, there remain significant gaps in our understanding of some of the most basic characteristics of the processes themselves. For instance, is the plasma membrane a passive granule “acceptor” or does it play a more active role in engaging the granule membrane? Once fusion occurs, how wide does the fusion pore expand and what are the kinetics of its expansion? What happens to the granule membrane after fusion – where does it go and how is it recovered? Our understanding is partly limited by the fact that the most widely used assays for exocytosis are not always the most appropriate for answering these questions. Electrochemical detection of catecholamine release from individual granules by amperometry is excellent for investigating the initial fusion pore but is unable to report on later expansion. Conventional fluorescent imaging of granule cargo release provides valuable information about the consummation of fusion, but not about prior or later events. Electron microscopy does the best job of providing detailed information on the various stages of fusion because of its excellent spatial resolution. However, the cells must be fixed and the images capture only single moments in time. The progression of fusion from beginning to end must be pieced together from different events, or even different cells.
Most assays for real-time investigation of exocytosis measure the release of granule contents or increase in plasma membrane area (capacitance). Inferences are often made from these measurements about the dynamics of membrane remodeling as fusion and content release progress. We have recently undertaken a different approach to investigate the fusion process, by focusing not primarily on the granule, but rather its partner in exocytosis – the plasma membrane (Anantharam et al., 2010a; Anantharam et al., 2011; Anantharam et al., 2010b). We have been guided by the idea that biochemical interaction between the granule membrane and plasma membranes before and during fusion changes in membrane shape. To enable our experiments, we utilized a novel imaging technique that combines polarized excitation of an oriented membrane stain (diI) with Total Internal Reflection Fluorescence Microscopy (pTIRFM). In this mini-review, we will first summarize the workings of the technique and how it may be used to detect submicroscopic changes in plasma membrane conformation in real-time. We then discuss the application of the technique to investigate: 1) localized plasma membrane deformations occurring prior to granule fusion; 2) the expansion of the fusion pore; 3) the regulation of fusion pore expansion by the GTPase activity of dynamin.
The theory and practice of pTIRFM
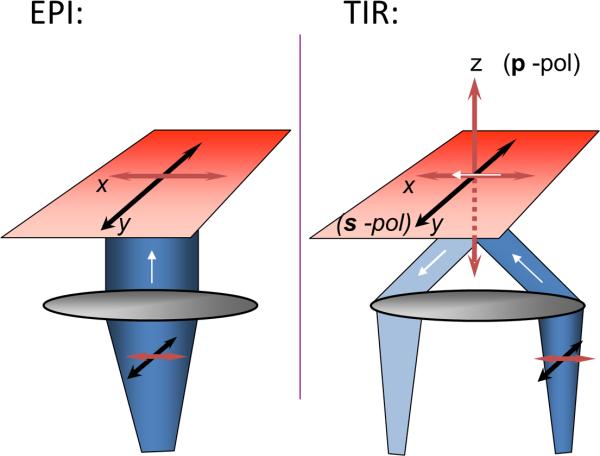
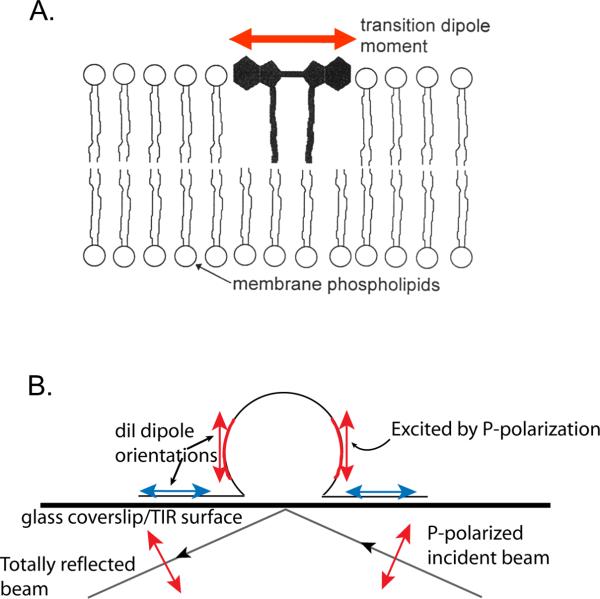
Polarization-based TIRFM detects rapid, submicroscopic changes in plasma membrane topology. The key to the technique is a polarization (p) perpendicular to the glass interface (Figure 1) that is available in TIRF, but not in epifluorescence (where only polarizations in the plane of the coverslip are possible). Together with polarization in the plane of the coverslip (s), the technique detects the orientation of a plasma membrane fluorophore, diI (Figure 2). The behavior of diI in lipid membranes is well-documented (Ethier et al., 1983; Juhasz et al., 2010; Wolf, 1985). For the polarization studies discussed here, diI is added briefly to the extracellular medium and intercalates in the plasma membrane with its transition dipoles nearly in the plane of the membrane (Axelrod, 1979; Sund et al., 1999). A powerful theoretical analysis enables interpretation of the results (Figure 3; (Anantharam et al., 2010b)).
Figure 1. TIR permits p-polarization.
The evanescent field generated by TIR permits polarization in the z-direction (p-pol) and in the y-direction (s-pol). The polarization in epifluorescence is only x or y (in the plane of the glass coverslip). The white arrow indicates direction of light propagation.
Figure 2. Polarized excitation of an idealized membrane deformation.
A. DiI intercalates in the plasma membrane with its transition dipole moments (red arrowheads) nearly parallel with the membrane head groups. B. In a p-polarized evanescent field, diI that is non-parallel with the coverslip (red arrows) is preferentially excited. If this were an s-polarized evanescent field, diI parallel to the coverslip (blue arrows) would be preferentially excited.
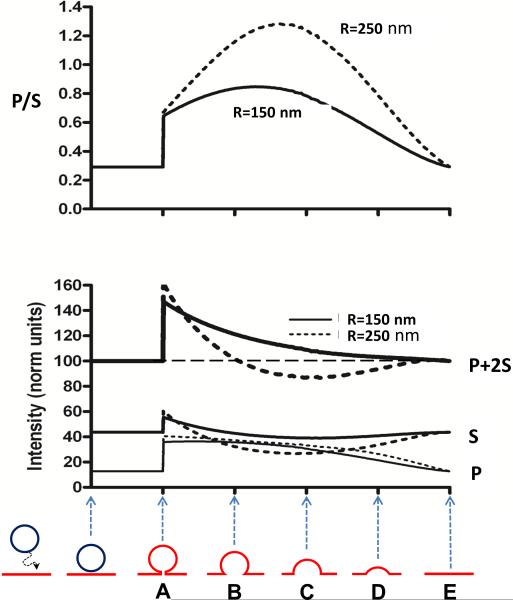
Figure 3. Simulated P/S and P + 2S as a function of spherical indentation depth.
(A–E) represent different geometries of the fused granule at the plasma membrane. The red color in A–E (bottom) indicates the diI-labeled plasma membrane while the dark blue color indicates unlabeled membrane of the vesicle (i.e., prior to fusion). Graphs for individual P and S intensities are also shown. Parameters assumed in the simulation are R = 150 nm (solid) or 250 nm (dashed) radius spherical indentation, diI labeling in both the indentation and planar areas, convolution with a point-spread function of half-width 211 nm to simulate the optical resolution limit, an evanescent field depth of 110 nm, an angle between diI dipoles and the normal to the plane of the membrane of 69° (Axelrod, 1979), and a distance between the TIR substrate and the planar parts of the structure of 50 nm. Images generated with these parameters are then pixelated in simulation with a pixel size of 73 nm. Only those pixels whose centers fall with a radius of 4-pixel widths (292 nm) from the center of the image are counted toward total intensities P and S.
Images needed to report membrane deformation are obtained by repeated sequences (as fast as10 Hz sequence frequency) of three TIR excitations: 442 nm (to obtain the image of a Cerulean labeled cargo protein – usually Neuropeptide-Y ); s-polarized 514 nm (parallel to the coverslip and perpendicular to the plane of incidence, to obtain the diI “s” image), and p-polarized 514 nm (perpendicular to the coverslip and in the plane of incidence) to obtain the diI “p” image). Regions - even submicroscopic ones - in which the membrane deviates from parallelism with the glass coverslip, are vividly highlighted by calculating pixel-by-pixel ratios of the emissions from p- and s-polarizations (abbreviated P/S) of the membrane-embedded diI fluorescence (Figure 4). The image ratio P/S reports local membrane deviations from parallelism with the glass coverslip. Any membrane deformation that changes the orientation of the plasma membrane from planar, and parallel to the coverslip, will increase P/S. The amplitude of the increase of P/S can be predicted by computer simulations (Figure 3; Anantharam et al., 2010b)), which show it is quite sensitive even to small deformations. Therefore, P/S is the main parameter used to detect and follow membrane deformations.
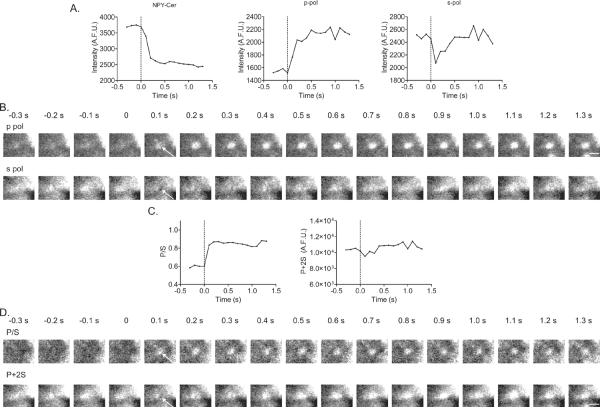
Figure 4. Polarized-TIRFM responses to granule fusion.
(A) With granule fusion and release of NPY (left panel), an increase in p (middle panel) and decrease in s (right panel) is observed. The dotted line indicates the frame before granule fusion (time 0). (B) p-pol and s-pol images corresponding to graphs shown in A. White arrows indicate areas where the increase in p-emission intensity or decrease in s-emission intensity is observed. (C, D) Based upon these data, P/S and P + 2S were calculated as described previously (Anantharam et al., 2011; Anantharam et al., 2010b). Emission intensities for P/S and P+2S calculations were based on circular ROIs of 292 nm radius. The post-fusion conformation of this granule is not intuitively obvious. However, based on computer simulations we would predict the fused granule to have a structure similar to “B” (for a 250 nm radius granule) in the bottom panel of Figure 3. Scale bar, 1 μm.
The linear combination P + 2S approximately reports total diI emission from that location, which, in theory, is proportional to the amount of diI at any x-y-z location convolved with the evanescent field intensity, which decays exponentially with z distance from the coverslip. (The approximation is valid if the collection efficiency of the objective is fairly insensitive to emission polarization over the whole range of z distances, as it is for high-aperture objectives such as the numerical aperture [NA] 1.49). The interpretation of changes in P + 2S in terms of geometrical models is more ambiguous than for P/S, with increases, decreases, or no detectable change possible, depending upon various countervailing tendencies arising from geometrical details. Computer simulations (Anantharam et al., 2010b) indicate that P + 2S will increase if the geometry results in more diI-labeled membrane close to the glass interface. This could occur if a granule is attached to the plasma membrane through a narrow neck (such as in Figure 3, structure `A'). P + 2S decreases if diI diffuses into a post-fusion membrane indentation (Figure 3, structure `C', 250 nm radius granule) placing diI farther from the substrate, and thereby in a dimmer evanescent field intensity).
Plasma membrane remodeling prior to granule fusion
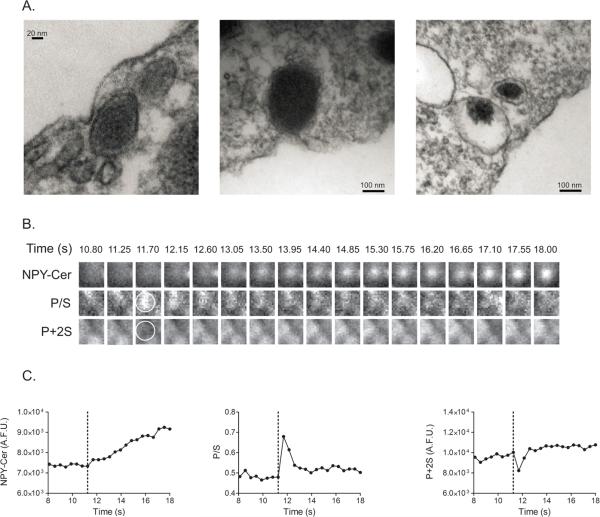
Electron micrographs sometimes show granules contacting areas of the plasma membrane that are invaginated (Figure 5A) (Anantharam et al., 2010a; Plattner et al., 1997) . We were interested in knowing whether these were snapshots of dynamic changes in membrane shape prior to fusion, or alternatively, long-lived indentations that were preferred sites of exocytosis. Using pTIRFM, we first searched for deformations (sites with increased P/S compared to surrounding areas) in the membrane, which were closely apposed to NPY-Cer-labeled granules. There was no evidence for plasma membrane deformations to be associated with granules that were already present for a long period in the evanescent field (greater than 100 granules investigated in 10 cells). Most fusion events occur from such granules (Allersma et al., 2004). There was also no tendency for pre-fusion plasma membrane deformations at sites of exocytosis. However, for the small population of granules (13) that appeared in the field during elevated K+-induced depolarization, 6 were preceded by a membrane deformation, of which two subsequently fused.
Figure 5. Granules at the sites of plasma membrane invaginations.
(A) Images taken by EM are shown of granules closely apposed to plasma membrane invaginations (left panel) or appearing to contact the plasma membrane at sites of invagination (middle and right panels). (B) A series of images are shown of the NPY-Cer and corresponding P/S and P + 2S intensities for an event where a granule moves into the field. Time after application of the high K+ stimulus is indicated. At 11.70 s, a brightening in P/S image and dimming in P+2S image is evident (circled region is approximately 870 nm). (C) The transient P/S intensity change (and decrease in P + 2S intensity) is evident immediately before the gradual increase in NPY-Cer intensity that signals a granule coming into the field (dotted line at 11.25 s).
Figure 5B shows images of one such granule appearing in the evanescent field with elevated K+ depolarization. A transient membrane deformation (P/S increase, line at 11.25 s) occurs just prior to the appearance of the granule in the field. Over the next several seconds, both the granule and plasma membrane appear to be moving closer to the coverslip (both NPY-Cer and P+2S increase). By 18.9 seconds after stimulation (“time” in B and C refer to time after the beginning of cell stimulation), the granule fuses and releases NPY-Cer (not shown).
Morphologically, the P/S increase and P+2S decrease in Fig. 5C is expected to result in indentations similar to those shown in the electron micrographs (Figure 5A). It is unclear how or why such deformations accompany granules arriving at the membrane upon stimulation. They may reflect a process by which the granule is brought to the plasma membrane or a process the primes the interaction for fusion. A more detailed investigation of this phenomenon is required.
Plasma membrane remodeling during the fusion process
The first direct demonstrations of the early fused state were electron micrographs of `omega figures' of the fused granule (Palade, 1975). Subsequently, the initial fusion event was detected using electrophysiological techniques in living cells by the groups of Zimmerberg (Zimmerberg et al., 1987) and Almers (Breckenridge and Almers, 1987a; Breckenridge and Almers, 1987b). The initial fusion pore (less than 3 nm diameter (Albillos et al., 1997; Breckenridge and Almers, 1987b; Zimmerberg et al., 1987)) expands to a much wider connection with the extracellular medium after a delay of usually tens to hundreds of milliseconds (Zhou et al., 1996). The expansion is important for controlling the selectivity and kinetics of the release of soluble granule contents (Albillos et al., 1997). The initial fusion pore is well described by amperometry, but the technique is unable to probe its wider expansion. Polarized-TIRFM can follow the wider expansion (Anantharam et al., 2011; Anantharam et al., 2010b). Because this technique measures deformations in the membrane, its signal persists after granule cargo reporter (catecholamine, or protein), is no longer present.
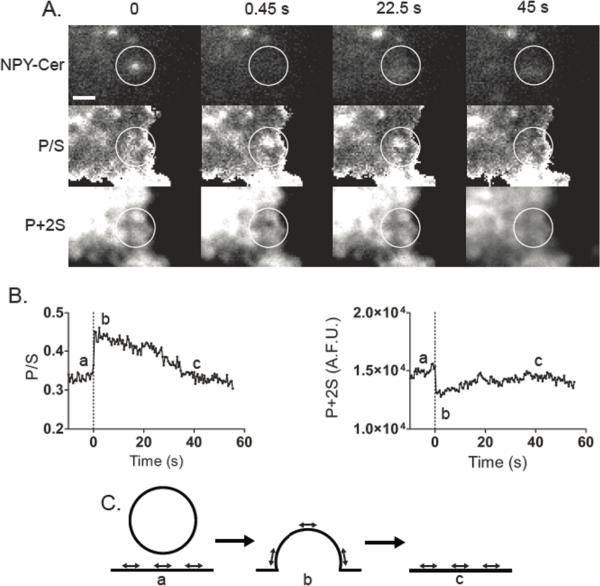
To perform pTIRFM studies, we depolarized diI-stained chromaffin cells to stimulate exocytosis, while monitoring changes in plasma membrane conformation. A sudden increase in P/S (i.e., deformation) occurred simultaneously with the release of NPY-Cer in ~90% of release events (Anantharam et al., 2011). The increase reflects the union of the granule and plasma membranes, with this new entity retaining some of the granule curvature (Figure 6A–C). Subsequent changes in P/S followed a variable time course. The deformation could last for less than one second, but often decayed more slowly (Figure 6C), sometimes not returning to baseline for tens of seconds (for examples, see Figure S3 from (Anantharam et al., 2010b)).
Figure 6. Changes in the topology of the plasma membrane at sites of exocytosis.
(A) P/S and P + 2S images were calculated and aligned to the NPY-Cer image at the times indicated. An NPY-Cer–labeled granule undergoes exocytosis between time 0 and 0.45 s. An increase in pixel intensity in the approximate location of the NPY-Cer image stack is observed, which is consistent with a change in orientation of membrane-intercalated diI. In the P + 2S image, a dimming is observed. Circles are centered over the last observed location of the granule. Bar, 1 μm. (B) Membrane P/S and P+2S were followed for almost 60 s. The dotted line at time 0 indicates the frame before fusion (i.e., the last frame in which the NPY-Cer granule was clearly visible). (C) One possible interpretation of the results in A and B is considered. DiI transition dipole moment orientation is indicated by direction of arrows.
Together, the P/S and P + 2S allow interpretation of the complex sequence of structural changes a fused granule at the plasma membrane undergoes as the pore widens. We found that the most common post-fusion outcome was collapse of the granule membrane into the plasma membrane with slow kinetics (i.e., over many seconds). Rapid endocytosis occurred infrequently (Anantharam et al., 2011).
Regulation of post-fusion deformations associated with pore expansion by dynamin
Dynamin has an established role as a master controller of fission during endocytosis (Hinshaw and Schmid, 1995; Takei et al., 1995). It forms rings or collars around the necks of budding endocytic vesicles (Hinshaw and Schmid, 1995), triggering cooperative GTP hydrolysis (Warnock et al., 1996) and membrane remodeling, leading to fission (for recent reviews, see (Doherty and McMahon, 2009; Pucadyil and Schmid, 2009; Schmid and Frolov, 2011)). A number of studies suggest that dynamin can function not only in endocytosis but also immediately upon fusion to regulate the kinetics of granule content release (Fulop et al., 2008; Gonzalez-Jamett et al., 2010; Graham et al., 2002; Holroyd et al., 2002; Tsuboi et al., 2004) and membrane protein dispersal into the plasma membrane (Jaiswal et al., 2009). Indeed, we found that dynasore, a putative inhibitor of dynamin GTPase activity and clathrin- mediated endocytosis (Macia et al., 2006), slowed the kinetics and altered the characteristics of the membrane changes detected by pTIRFM, suggesting a role for endogenous dynamin in fusion pore expansion (Anantharam et al., 2010a).
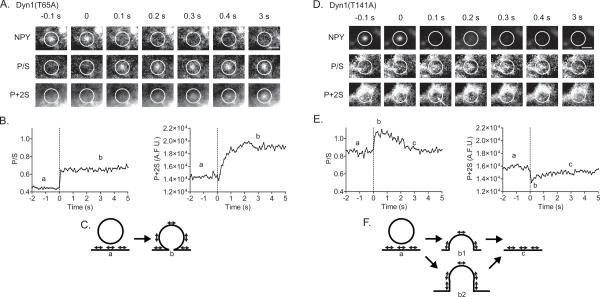
The GTPase activity of dynamin plays a critical role in catalyzing membrane fission in endocytosis. Mutants that alter the GTPase activity alter the rates of clathrin-mediated endocytosis. To determine directly whether dynamin GTPase activity regulates fusion pore expansion, adrenal chromaffin cells were transiently transfected with wild-type dynamin-1 (Dyn1WT), dynamin-1 mutant T65A (Dyn1(T65A)) with reduced GTPase activity, or dynamin-1 mutant T141A (Dyn1(T141A)) with elevated GTPase activity (Marks et al., 2001; Song et al., 2004). We found that expression of dynamin-1 mutants with either decreased or increased GTPase activity substantially altered the characteristics of membrane dynamics detected upon fusion. The effects of the mutants could be distinguished both by the time course of membrane deformations (P/S) and their possible geometries (as suggested by changes in P + 2S). Representative examples of P/S and P + 2S changes in cells expressing the mutants are shown in Figure 7 and discussed below.
Figure 7. Examples of membrane topological changes after fusion in cells expressing Dyn1 GTPase mutants.
Chromaffin cells were co-transfected with NPY-Cer and either Dyn1(T65A) or Dyn1(T141A) mutants. (A) Images are shown of pTIRFM responses (P/S and P + 2S) to exocytosis in a cell with transfected human Dyn1(T65A). (B) The P/S and P + 2S increase is long-lived in a cell transfected with Dyn1(T65A) with low GTPase activity. (C) One interpretation of the event is considered in the cartoon. The data are also consistent with a diI-labeled granule having undergone endocytosis at the site of fusion and remaining close to the plasma membrane (not shown). DiI transition dipole moment orientation is indicated by direction of arrowheads. (D, E) Conversely, the P/S increase after fusion is transient in a cell transfected with Dyn1(T141A) with elevated GTPase activity. P + 2S transiently decreases in region highlighted by white arrow (D). (F) The changes observed are consistent with computer simulations of structures shown in the cartoon. Structures b1 and b2 represent two possible curvature transitions leading to granule membrane collapse into the plasma membrane Both structures results in increased P/S and decreased P+2S emission. Another possibility not shown is rapid endocytosis with retreat of the diI-labeled granule into the cell.
Cells expressing Dyn1(T65A) with low GTPase activity display a long-lived deformation upon fusion associated with an increased amount of diI-labeled membrane (i.e., increased P + 2S; Figure 7A–C). This is consistent with a granule membrane connected to a plasma membrane via a short neck. Such an event would occur if expansion of the pore is limited after fusion (Figure 7C). Long-lived increases in P/S and P + 2S might also result from a diI-labeled granule undergoing endocytosis but remaining close to the plasma membrane. However, this outcome is unlikely given the lower rather than higher frequency of endocytosis with Dyn1(T65A) (Anantharam et al., 2011; Song et al., 2004). Conversely, in cells expressing Dyn1(T141A) with high GTPase activity, deformations (P/S increases) after fusion are transient and are usually accompanied by decreases, rather than increases, in P + 2S. These changes suggest that higher GTPase activity speeds expansion of the pore, resulting in rapid collapse of the granule membrane into the plasma membrane (Figure 7D–F). Indeed, in the presence of Dyn1(T141A), 45% of the fusion events were not associated with a change in P/S compared to 13% in control cells, 13% in cells expressing Dyn1WT and 0% in cells expressing Dyn1(T65A). The increased incidence of fusion events without evident changes in P/S in cells expressing Dyn1(T141A) likely reflects topological changes occurring faster than the temporal resolution of the technique (consistent with the amperometry, below).
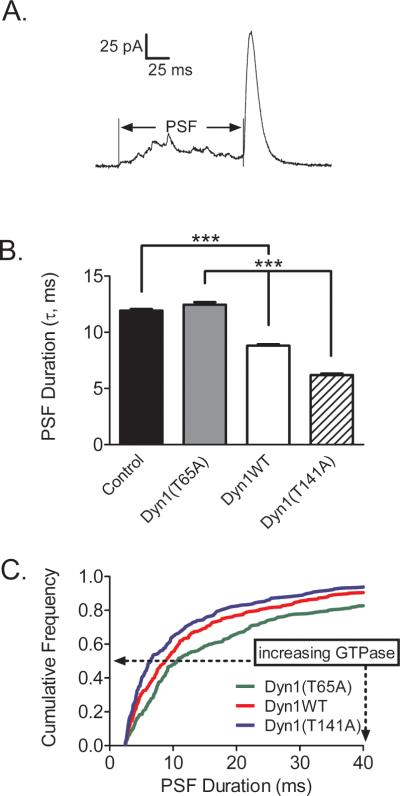
The membrane events detected by pTIRFM are associated with intermediate and late fusion pore expansion with deformations detected with a time resolution of approximately 100 ms. To address the possibility that the dynamin GTPase activity regulates fusion pore expansion within milliseconds of exocytosis, carbon-fiber amperometry was performed. Figure 8A shows an example of an amperometric spike detected after depolarization of a chromaffin cell with a long pre-spike foot (PSF). Expression of Dyn1WT in chromaffin cells had no effect on the percentage of spikes detected with a PSF compared with the control group. Expression of Dyn1(T141A) with increased GTPase activity significantly reduced the percentage of spikes with a PSF from 46% for Dyn1WT to 34% (p < 0.05, Student's unpaired t test). The duration of the PSF was also significantly reduced in cells expressing Dyn1(T141A) compared to cells expressing Dyn1WT (Figure 8B). Conversely, the duration of the PSF was increased in cells with the slow GTPase mutant, Dyn1(T65A). Further analysis of these events showed that this mutant significantly increased the fraction of PSFs with relatively long durations (Figure 8C). These data indicate that the properties of the early fusion pore are affected by dynamin in ways that are self-consistent with dynamin's effects on later pore expansion (pTIRFM).
Figure 8. Amperometry of individual catecholamine release events indicates that Dyn1 GTPase activity regulates early fusion pore expansion.
(A) An example of an amperometric spike with a long PSF. (B) PSF durations (τ) were calculated as described in (Anantharam et al., 2011) (***p < 0.001, Student's t test). (C) Relative cumulative histogram of PSF durations for Dyn1WT and mutants.
The effects of dynamin on the amperometric prespike foot suggested to us that it might already be at or close to fusion sites before exocytosis. Indeed, immunocytochemistry demonstrated that endogenous dynamin (in the absence of transfected dynamin) is highly concentrated on the plasma membrane in adjoining puncta, labeling most of the exposed membrane (Anantharam et al., 2011). Transiently expressed dynamin (detected by immunocytochemistry) also localizes to the plasma membrane (usually as puncta) and is significantly expressed in the adjacent cytoplasm. TIRFM imaging of chromaffin cells also revealed GFP-tagged dynamin to be on or near the plasma membrane, sometimes organized into discrete puncta (Anantharam et al., 2011). Live cell imaging did not reveal localized accumulation of dynamin immediately upon fusion, perhaps because of transient and/or small amounts of accumulation over background. The experiments may also have been limited by the 10 Hz image acquisition or countervailing effects of displacement by the granule membrane or diffusion into the fused and recessed granule membrane.
Possible mechanism of dynamin action to regulate fusion pore expansion
We are struck by the remarkable coherence between current and past studies concerning the effects of varying dynamin's GTPase activity. Increased GTPase activity increases the rates of fusion pore expansion (Anantharam et al., 2011), rapid endocytosis (Anantharam et al., 2011) and slower, clathrin-mediated endocytosis (Song et al., 2004). One explanation for an effect of dynamin on fusion pore expansion is that it is an indirect consequence of dynamin's role in endocytosis, with fusion pore expansion being restricted and eventually reversed along the pathway to fission. However, it is difficult to reconcile our data with this model. This scenario would predict that a mutant that increases the frequency of rapid endocytosis would also inhibit fusion pore expansion. Just the opposite occurred. The high GTPase mutant (T141A) increased the incidence of rapid endocytosis and also greatly hastened (rather than slowed) the flattening of granules not undergoing endocytosis (Anantharam et al., 2011).
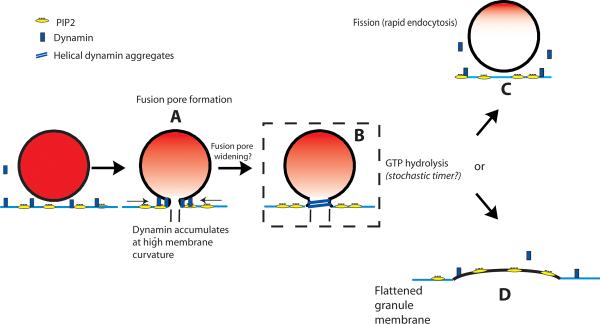
We favor a mechanism based upon dynamin's membrane sculpting ability and an additional property that is also essential in endocytosis: its self-limited assembly on lipids in the presence of GTP. GTP hydrolysis is enhanced many-fold by dynamin assembly, which, in turn, reverses assembly and interaction with lipid (Ramachandran and Schmid, 2008; Warnock et al., 1996), and only sometimes leads to endocytosis (Bashkirov et al., 2008; Pucadyil and Schmid, 2009; Schmid and Frolov, 2011). Membrane fission may therefore be considered a stochastic result of GTP hydrolysis. This notion fits well with the results in this study. We speculate that dynamin assembly restricts fusion pore expansion until GTP hydrolysis-stimulated disassembly. Higher GTPase (Dyn1(T141A)) activity causes the decision between fission (Figure 9, B→C) or fusion pore expansion (Figure 9, B→D) to be made earlier, with a somewhat elevated incidence of rapid endocytosis. Lower GTPase (Dyn1(T65A)) activity delays the decision, often stabilizing the narrow-neck fusion intermediate (Figure 9, B). Indeed, there is evidence that a high curvature protein/lipid intermediate such as B is rendered unstable when dynamin reduces its lipid interaction upon GTP hydrolysis leaving a high curvature lipid neck no longer stabilized by interaction with dynamin (Bashkirov et al., 2008; Schmid and Frolov, 2011).
Figure 9. Possible functions of dynamin up granule fusion with plasma membrane.
Dynamin may have a role in the enlargement of the fusion pore (A→B) and the `decision' (B) to either undergo rapid endocytosis (C) or relatively stable incorporation of the granule membrane into the plasma membrane (D). The decision is stochastic, the timing of which is dependent upon dynamin GTPase activity. Slow, clathrin-dependent endocytosis (also dynamin dependent, not shown) follows the incorporation of the granule membrane into the plasma membrane. There is evidence that dynamin 1 is involved in rapid endocytosis (C) and dynamin 2 in slow, clathrin-mediated endocytosis. A role for PIP2 is also indicated. Dynamin interaction with PIP2 through its PH domain is required for its function in membrane fission. PIP2 is also required for exocytosis.
Although numerous proteins have been shown to influence fusion pore expansion, dynamin is unique. Its intrinsic membrane-shaping capacity provides a direct biochemical and mechanistic link between fusion pore expansion and membrane fission in endocytosis. Dynamin may not be acting alone. Some of the proteins that have been shown to alter fusion pore expansion (measured by amperometry or protein release) interact with dynamin either directly or indirectly through its proline/arginine-rich domain (PRD). These include actin (Berberian et al., 2009; Gu et al., 2010; Lee and De Camilli, 2002; Witke et al., 1998), the SNAREs (Galas et al., 2000; Lam et al., 2008; Ngatchou et al., 2010; Okamoto et al., 1999; Robinson and Bonifacino, 2001), and synaptotagmin (Lynch et al., 2008; Robinson and Bonifacino, 2001; Wang et al., 2001; Zhang et al., 2011). Thus, dynamin may be an integral component of the pathway that controls fusion pore expansion and the release of lumenal contents.
A role for dynamin based upon the effects of dynamin inhibitors and dynamin mutants has recently been suggested for another curvature generation process: viral fusion protein-induced cell-to-cell fusion. Thus, dynamin may function in multiple cell biological processes in involving high curvature intermediates addition to membrane fission in endocytosis (Richard et al., 2011).
Summary
pTIRFM is a powerful and sensitive technique to investigate biological processes that involve plasma membrane shape changes and deformations. In this mini-review, we discussed the application of the technique to visualize deformations occurring before the fusion event, and later, during fusion pore expansion. Recent work supports the idea that events associated with the fusion pore can take distinct pathways (Fulop et al., 2005; Perrais et al., 2004; Taraska et al., 2003; Tsuboi and Rutter, 2003). This has important implications for the extent to which plasma membrane morphology is reordered upon fusion. It is from this perspective that we have approached the study of fusion pore expansion – not by studying what is released from the granule, but rather the dynamics of the membrane itself.
Our studies provide three important insights into the sequence of events accompanying fusion. First, in a small number of cases, plasma membrane invaginations precede the appearance of a granule within the evanescent field (Anantharam et al., 2010a). The deformations likely indicate an intimate interaction of the granule with the plasma membrane. They may reflect a process by which the granule is brought to the plasma membrane or a process the primes the interaction for fusion.
Second, we find that upon fusion, the granule membrane often does not rapidly collapse into the plasma membrane (Anantharam et al., 2010b). Rather, the deformations detected suggest a varying time course of fusion pore widening, usually leading to substantial collapse of the granule membrane into the plasma membrane. The fused granule sometimes collapses into the plasma membrane in less than a second, but typically, it retains curvature for many seconds. We also found that upon elevated K+-induced depolarization, rapid endocytosis with retrieval of the granule membrane occurs infrequently.
Third, we find that the post-fusion fate of the granule membrane is regulated by dynamin GTPase activity (Anantharam et al., 2011; Anantharam et al., 2010b). When dynamin GTPase activity is reduced (by inhibitor or expression of a dynamin mutant), expansion of the fusion pore is slowed with concomitant long-lasting membrane deformations. When dynamin GTPase activity is elevated by mutation, fusion pore expansion is accelerated, with more rapid curvature transitions. The ability to identify specific effects of the GTPase activity suggests a mechanism that may explain its function. The findings expand the membrane-sculpting repertoire of dynamin to include the regulation of immediate post-fusion events in exocytosis and provide a direct biochemical and mechanistic link between secretion and endocytosis.
Acknowledgements
This work was supported by NIH grants R01-NS38129, R56-NS38129 and R21-NS073686 to RWH and DA, and NIH fellowships T32-DA007268 and F32-GM086169 to AA.
Abbreviations
- A.F.U.
arbitrary fluorescence units
- diI
1,1'-dioctadecyl-3,3,3',3'-tetramethylindocarbocyanine perchlorate
- Dyn1
Dynamin-1
- p-pol
p-polarization
- P/S
(p-pol emission)/(s-pol emission)
- P+2S
p-pol emission + 2(s-pol emission)
- s-pol
s-polarization
- TIRFM
total internal reflection fluorescence microscopy
- WT
wild-type
References
- Albillos A, Dernick G, Horstmann H, Almers W, Alvarez de Toledo G, Lindau M. The exocytotic event in chromaffin cells revealed by patch amperometry. Nature. 1997;389(6650):509–512. doi: 10.1038/39081. [DOI] [PubMed] [Google Scholar]
- Allersma MW, Wang L, Axelrod D, Holz RW. Visualization of Regulated Exocytosis with a Granule-Membrane Probe using Total Internal Reflection Microscopy. Molecular Biology of the Cell. 2004;15:4658–4668. doi: 10.1091/mbc.E04-02-0149. [DOI] [PMC free article] [PubMed] [Google Scholar]
- Anantharam A, Axelrod D, Holz RW. Polarized TIRFM reveals changes in plasma membrane topology before and during granule fusion. Cell Mol Neurobiol. 2010a;30:1343–1349. doi: 10.1007/s10571-010-9590-0. [DOI] [PMC free article] [PubMed] [Google Scholar]
- Anantharam A, Bittner MA, Aikman RL, Stuenkel EL, Schmid SL, Axelrod D, Holz RW. A new role for the dynamin GTPase in the regulation of fusion pore expansion. Mol Biol Cell. 2011;22:1907–1918. doi: 10.1091/mbc.E11-02-0101. [DOI] [PMC free article] [PubMed] [Google Scholar]
- Anantharam A, Onoa B, Edwards RH, Holz RW, Axelrod D. Localized topological changes of the plasma membrane upon exocytosis visualized by polarized TIRFM. J Cell Biol. 2010b;188:415–428. doi: 10.1083/jcb.200908010. [DOI] [PMC free article] [PubMed] [Google Scholar]
- Artalejo CR, Henley JR, McNivan MA, Palfrey HC. Rapid endocytosis coupled to excocytosis in adrenal chromaffin cells involves Ca 2+, GTP, and dynamin but not clathrin. Proceedings of the National Academy of Sciences of the United States of America. 1995;92:8328–8332. doi: 10.1073/pnas.92.18.8328. [DOI] [PMC free article] [PubMed] [Google Scholar]
- Axelrod D. Carbocyanine dye orientation in red cell membrane studied by microscopic fluorescence polarization. Biophys.J. 1979;26:557–574. doi: 10.1016/S0006-3495(79)85271-6. [DOI] [PMC free article] [PubMed] [Google Scholar]
- Bashkirov PV, Akimov SA, Evseev AI, Schmid SL, Zimmerberg J, Frolov VA. GTPase Cycle of Dynamin Is Coupled to Membrane Squeeze and Release, Leading to Spontaneous Fission. Cell. 2008;135:1276–1286. doi: 10.1016/j.cell.2008.11.028. [DOI] [PMC free article] [PubMed] [Google Scholar]
- Berberian K, Torres AJ, Fang Q, Kisler K, Lindau M. F-Actin and Myosin II Accelerate Catecholamine Release from Chromaffin Granules. Journal of Neuroscience. 2009;29:863–870. doi: 10.1523/JNEUROSCI.2818-08.2009. [DOI] [PMC free article] [PubMed] [Google Scholar]
- Breckenridge LJ, Almers W. Currents through the fusion pore that forms during exocytosis of a secretory vesicle. Nature. 1987a;328:814–817. doi: 10.1038/328814a0. [DOI] [PubMed] [Google Scholar]
- Breckenridge LJ, Almers W. Final steps in exocytosis observed in a cell with giant secretory granules. Proceedings of the National Academy of Sciences of the United States of America. 1987b;84:1945–1949. doi: 10.1073/pnas.84.7.1945. [DOI] [PMC free article] [PubMed] [Google Scholar]
- Doherty GJ, McMahon HT. Mechanisms of endocytosis. Annu Rev Biochem. 2009;78:857–902. doi: 10.1146/annurev.biochem.78.081307.110540. [DOI] [PubMed] [Google Scholar]
- Doreian BW, Fulop TG, Smith CB. Myosin II activation and actin reorganization regulate the mode of quantal exocytosis in mouse adrenal chromaffin cells. J Neurosci. 2008;28:4470–4478. doi: 10.1523/JNEUROSCI.0008-08.2008. [DOI] [PMC free article] [PubMed] [Google Scholar]
- Ethier MF, Wolf DE, Melchior DL. Calorimetric investigation of the phase partitioning of the fluorescent carbocyanine probes in phosphatidylcholine bilayers. Biochemistry. 1983;22:1178–1182. doi: 10.1021/bi00274a029. [DOI] [PubMed] [Google Scholar]
- Fulop T, Doreian B, Smith C. Dynamin I plays dual roles in the activity-dependent shift in exocytic mode in mouse adrenal chromaffin cells. Archives of Biochemistry and Biophysics. 2008;477:146–154. doi: 10.1016/j.abb.2008.04.039. [DOI] [PMC free article] [PubMed] [Google Scholar]
- Fulop T, Radabaugh S, Smith C. Activity-Dependent Differential Transmitter Release in Mouse Adrenal Chromaffin Cells. Journal of Neuroscience. 2005;25:7324–7332. doi: 10.1523/JNEUROSCI.2042-05.2005. [DOI] [PMC free article] [PubMed] [Google Scholar]
- Galas MC, Chasserot-Golaz S, Dirrig-Grosch S, Bader MF. Presence of dynamin--syntaxin complexes associated with secretory granules in adrenal chromaffin cells. Journal of Neurochemistry. 2000;75(4):1511–9. doi: 10.1046/j.1471-4159.2000.0751511.x. [DOI] [PubMed] [Google Scholar]
- Gonzalez-Jamett AM, Baez-Matus X, Hevia MA, Guerra MJ, Olivares MJ, Martinez AD, Neely A, Cardenas AM. The association of dynamin with synaptophysin regulates quantal size and duration of exocytotic events in chromaffin cells. The Journal of neuroscience : the official journal of the Society for Neuroscience. 2010;30:10683–10691. doi: 10.1523/JNEUROSCI.5210-09.2010. [DOI] [PMC free article] [PubMed] [Google Scholar]
- Graham ME, O'Callaghan DW, McMahon HT, Burgoyne RD. Dynamin-dependent and dynamin-independent processes contribute to the regulation of single vesicle release kinetics and quantal size. Proceedings of the National Academy of Sciences. 2002;99:7124–7129. doi: 10.1073/pnas.102645099. [DOI] [PMC free article] [PubMed] [Google Scholar]
- Gu C, Yaddanapudi S, Weins A, Osborn T, Reiser J, Pollak M, Hartwig J, Sever S. Direct dynamin-actin interactions regulate the actin cytoskeleton. EMBO J. 2010;29:3593–3606. doi: 10.1038/emboj.2010.249. [DOI] [PMC free article] [PubMed] [Google Scholar]
- Han X, Wang CT, Bai J, Chapman ER, Jackson MB. Transmembrane Segments of Syntaxin Line the Fusion Pore of Ca2+-Triggered Exocytosis. Science. 2004;304:289–292. doi: 10.1126/science.1095801. [DOI] [PubMed] [Google Scholar]
- Henkel AW, Almers W. Fast steps in exocytosis and endocytosis studied by capacitance measurements in endocrine cells. Current Opinion in Neurobiology. 1996;6:350–357. doi: 10.1016/s0959-4388(96)80119-x. [DOI] [PubMed] [Google Scholar]
- Hinshaw JE, Schmid SL. Dynamin self-assembles into rings suggesting a mechanism for coated vesicle budding. Nature. 1995;374:190–192. doi: 10.1038/374190a0. [DOI] [PubMed] [Google Scholar]
- Holroyd P, Lang T, Wenzel D, De Camilli P, Jahn R. Imaging direct, dynamin-dependent recapture of fusing secretory granules on plasma membrane lawns from PC12 cells. Proceedings of the National Academy of Sciences. 2002;99:16806–16811. doi: 10.1073/pnas.222677399. [DOI] [PMC free article] [PubMed] [Google Scholar]
- Jaiswal JK, Rivera VM, Simon SM. Exocytosis of post-Golgi vesicles is regulated by components of the endocytic machinery. Cell. 2009;137:1308–1319. doi: 10.1016/j.cell.2009.04.064. [DOI] [PMC free article] [PubMed] [Google Scholar]
- Juhasz J, Davis JH, Sharom FJ. Fluorescent probe partitioning in giant unilamellar vesicles of `lipid raft' mixtures. Biochem J. 2010;430:415–423. doi: 10.1042/BJ20100516. [DOI] [PubMed] [Google Scholar]
- Lam AD, Tryoen-Toth P, Tsai B, Vitale N, Stuenkel EL. SNARE-catalyzed Fusion Events Are Regulated by Syntaxin1A-Lipid Interactions. Molecular Biology of the Cell. 2008;19:485–497. doi: 10.1091/mbc.E07-02-0148. [DOI] [PMC free article] [PubMed] [Google Scholar]
- Lee E, De Camilli P. Dynamin at actin tails. Proc.Natl.Acad.Sci U.S.A. 2002;99:161–166. doi: 10.1073/pnas.012607799. [DOI] [PMC free article] [PubMed] [Google Scholar]
- Lynch KL, Gerona RRL, Kielar DM, Martens S, McMahon HT, Martin TFJ. Synaptotagmin-1 Utilizes Membrane Bending and SNARE Binding to Drive Fusion Pore Expansion. Molecular Biology of the Cell. 2008;19:5093–5103. doi: 10.1091/mbc.E08-03-0235. [DOI] [PMC free article] [PubMed] [Google Scholar]
- Macia E, Ehrlich M, Massol R, Boucrot E, Brunner C, Kirchhausen T. Dynasore, a Cell-Permeable Inhibitor of Dynamin. Developmental Cell. 2006;10:839–850. doi: 10.1016/j.devcel.2006.04.002. [DOI] [PubMed] [Google Scholar]
- Ngatchou AN, Kisler K, Fang Q, Walter AM, Zhao Y, Bruns D, Sorensen JB, Lindau M. Role of the synaptobrevin C terminus in fusion pore formation. Proc.Natl.Acad.Sci U.S.A. 2010;107:18463–18468. doi: 10.1073/pnas.1006727107. [DOI] [PMC free article] [PubMed] [Google Scholar]
- Okamoto M, Schoch S, Sudhof TC. EHSH1/Intersectin, a Protein That Contains EH and SH3 Domains and Binds to Dynamin and SNAP-25. A PROTEIN CONNECTION BETWEEN EXOCYTOSIS AND ENDOCYTOSIS? Journal of Biological Chemistry. 1999;274:18446–18454. doi: 10.1074/jbc.274.26.18446. [DOI] [PubMed] [Google Scholar]
- Palade G. Intracellular aspects of the process of protein synthesis. Science. 1975;189:347–358. doi: 10.1126/science.1096303. [DOI] [PubMed] [Google Scholar]
- Perrais D, Kleppe IC, Taraska JW, Almers W. Recapture after exocytosis causes differential retention of protein in granules of bovine chromaffin cells. The Journal of Physiology Online. 2004;560:413–428. doi: 10.1113/jphysiol.2004.064410. [DOI] [PMC free article] [PubMed] [Google Scholar]
- Plattner H, Artalejo AR, Neher E. Ultrastructural organization of bovine chromaffin cell cortex- analysis by cryofixation and morphometry of aspects pertinent to exocytosis [In Process Citation] Journal of Cell Biology. 1997;139(7):1709–1717. doi: 10.1083/jcb.139.7.1709. [DOI] [PMC free article] [PubMed] [Google Scholar]
- Pucadyil TJ, Schmid SL. Conserved functions of membrane active GTPases in coated vesicle formation. Science. 2009;325:1217–1220. doi: 10.1126/science.1171004. [DOI] [PMC free article] [PubMed] [Google Scholar]
- Ramachandran R, Schmid SL. Real-time detection reveals that effectors couple dynamin's GTP-dependent conformational changes to the membrane. EMBO J. 2008;27:27–37. doi: 10.1038/sj.emboj.7601961. [DOI] [PMC free article] [PubMed] [Google Scholar]
- Richard JP, Leikina E, Langen R, Henne WM, Popova M, Balla T, McMahon HT, Kozlov MM, Chernomordik LV. Intracellular curvature-generating proteins in cell-to-cell fusion. Biochem J. 2011;440:185–193. doi: 10.1042/BJ20111243. [DOI] [PMC free article] [PubMed] [Google Scholar]
- Robinson MS, Bonifacino JS. Adaptor-related proteins. Current Opinion in Cell Biology. 2001;13:444–453. doi: 10.1016/s0955-0674(00)00235-0. [DOI] [PubMed] [Google Scholar]
- Schmid SL, Frolov VA. Dynamin: functional design of a membrane fission catalyst. Annu Rev Cell Dev Biol. 2011;27:79–105. doi: 10.1146/annurev-cellbio-100109-104016. [DOI] [PubMed] [Google Scholar]
- Song BD, Leonard M, Schmid SL. Dynamin GTPase Domain Mutants That Differentially Affect GTP Binding, GTP Hydrolysis, and Clathrin-mediated Endocytosis. Journal of Biological Chemistry. 2004;279:40431–40436. doi: 10.1074/jbc.M407007200. [DOI] [PubMed] [Google Scholar]
- Sund SE, Swanson JA, Axelrod D. Cell membrane orientation visualized by polarized total internal reflection fluorescence. Biophysical Journal. 1999;77:2266–2283. doi: 10.1016/S0006-3495(99)77066-9. [DOI] [PMC free article] [PubMed] [Google Scholar]
- Takei K, McPherson PS, Schmid SL, De Camilli P. Tubular membrane invaginations coated by dynamin rings are induced by GTP-gamma S in nerve terminals. Nature. 1995;374:186–190. doi: 10.1038/374186a0. [DOI] [PubMed] [Google Scholar]
- Taraska JW, Perrais D, Ohara-Imaizumi M, Nagamatsu S, Almers W. Secretory granules are recaptured largely intact after stimulated exocytosis in cultured endocrine cells. Proceedings of the National Academy of Sciences of the United States of America. 2003;100:2070–2075. doi: 10.1073/pnas.0337526100. [DOI] [PMC free article] [PubMed] [Google Scholar]
- Tsuboi T, McMahon HT, Rutter GA. Mechanisms of Dense Core Vesicle Recapture following “Kiss and Run” (“Cavicapture”) Exocytosis in Insulin-secreting Cells. Journal of Biological Chemistry. 2004;279:47115–47124. doi: 10.1074/jbc.M408179200. [DOI] [PubMed] [Google Scholar]
- Tsuboi T, Rutter GA. Multiple Forms of “Kiss-and-Run” Exocytosis Revealed by Evanescent Wave Microscopy. Current Biology. 2003;13:563–567. doi: 10.1016/s0960-9822(03)00176-3. [DOI] [PubMed] [Google Scholar]
- Wang CT, Grishanin R, Earles CA, Chang PY, Martin TFJ, Chapman ER, Jackson MB. Synaptotagmin Modulation of Fusion Pore Kinetics in Regulated Exocytosis of Dense-Core Vesicles. Science. 2001;294:1111–1115. doi: 10.1126/science.1064002. [DOI] [PubMed] [Google Scholar]
- Warnock DE, Hinshaw JE, Schmid SL. Dynamin self-assembly stimulates its GTPase activity. J Biol Chem. 1996;271:22310–22314. doi: 10.1074/jbc.271.37.22310. [DOI] [PubMed] [Google Scholar]
- Witke W, Podtelejnikov AV, Di Nardo A, Sutherland JD, Gurniak CB, Dotti C, Mann M. In mouse brain profilin I and profilin II associate with regulators of the endocytic pathway and actin assembly. EMBO J. 1998;17:967–976. doi: 10.1093/emboj/17.4.967. [DOI] [PMC free article] [PubMed] [Google Scholar]
- Wolf DE. Determination of the sidedness of carbocyanine dye labeling of membranes. Biochemistry. 1985;24:582–586. doi: 10.1021/bi00324a006. [DOI] [PubMed] [Google Scholar]
- Zhang Z, Wu Y, Wang Z, Dunning FM, Rehfuss J, Ramanan D, Chapman ER, Jackson MB. Release mode of large and small dense-core vesicles specified by different synaptotagmin isoforms in PC12 cells. Mol Biol Cell. 2011;22:2324–2336. doi: 10.1091/mbc.E11-02-0159. [DOI] [PMC free article] [PubMed] [Google Scholar]
- Zhou Z, Misler S, Chow RH. Rapid fluctuations in transmitter release from single vesicles in bovine adrenal chromaffin cells. Biophysical Journal. 1996;70:1543–1552. doi: 10.1016/S0006-3495(96)79718-7. [DOI] [PMC free article] [PubMed] [Google Scholar]
- Zimmerberg J, Curran M, Cohen FS, Brodwick M. Simultaneous electrical and optical measurements show that membrane fusion precedes secretory granule swelling during exocytosis of beige mouse mast cells. Proceedings of the National Academy of Sciences of the United States of America. 1987;84:1585–1589. doi: 10.1073/pnas.84.6.1585. [DOI] [PMC free article] [PubMed] [Google Scholar]


