

Background: A series of distal DNA elements regulates the human growth hormone gene.
Results: Deletion of one of these elements, HSII, results in reduced growth hormone expression and changes in several activating phenomena at the locus.
Conclusion: HSII is a unique regulator of growth hormone expression.
Significance: Elucidating complex regulation determinants is imperative to the understanding of metazoan gene expression.
Keywords: Chromatin, Gene Expression, Growth Hormone, Histone Modification, RNA Polymerase II, Locus Control Region
Abstract
Locus control regions (LCRs) comprise sets of DNA elements capable of establishing autonomous chromatin domains that support robust and physiologically appropriate expression of target genes, often working over extensive distances. Human growth hormone (hGH-N) expression in the pituitary is under the regulation of a well characterized LCR containing four DNase I hypersensitive sites (HSs). The two pituitary-specific HS, HSI and HSII, are located 14.5 and 15.5 kb 5′ to the hGH-N promoter. HSI is essential for activation of hGH-N during pituitary development and for sustaining robust activity in the adult. To determine whether the closely linked HSII has a role in hGH-N expression, it was deleted from a previously validated hGH/P1 transgene. Analysis of three independent hGH/P1(ΔHSII) transgenic mouse lines revealed that this deletion had no adverse effect on the formation of HSI, yet resulted in a substantial loss (70%) in hGH-N mRNA expression. This loss of expression was accompanied by a corresponding reduction in recruitment of the pituitary-specific transcription factor Pit-1 to the hGH-N promoter and a selective decrease in promoter occupancy of the elongation-linked isoform of RNA polymerase II. Sufficiency of HSI and HSII in LCR activity was explored by establishing two additional sets of mouse transgenic lines in which DNA segments containing these HS were positioned within the λ phage genome. In this “neutral” DNA context, HSII was required for the recruitment of HAT activity. These data establish HSII as a nonredundant component of the hGH LCR essential for establishment of robust levels of hGH-N gene expression.
Introduction
Locus control regions (LCRs)3 are long-range DNA transcriptional determinants that function to establish specific chromatin structures as part of the transcription process (1). Components of LCRs usually co-localize with sites of deoxyribonuclease I (DNase I) hypersensitivity (HS) and are operationally verified in transgenic studies by their ability to enhance transcription of their linked target gene in a copy number-dependent and tissue-specific manner when inserted at ectopic chromatin sites (2). The importance of LCR determinants in metazoan gene activation has been highlighted in numerous mouse models (3–6) and by the identification of LCR mutations in human disease (7–10). A variety of mechanisms have been proposed regarding the mode of action for such regions (for a review, see Ref. 11). Many of these studies have focused on the functions of individual LCR elements, as identified by distinct HS determinants, in a variety of experimental models (12–16).
The human growth hormone gene (hGH) cluster contains the pituitary somatotrope-specific hGH-N gene and four highly homologous placenta-specific genes (Fig. 1A). This locus has been established as a model for studying the dynamics of LCR activities. A region extending from 14.5 to 32 kb upstream of the hGH-N promoter encompasses five DNase I hypersensitive sites (HS) comprising the hGH LCR (Fig. 1A) (17). This region is required for robust and spatially regulated expression of both the pituitary (17) and placental (3) genes within the cluster. The hGH LCR establishes distinct patterns of epigenetic modifications at the hGH locus in these two tissues (18, 19). The LCR and cluster are arranged on the chromosome in close proximity to the SCN4A and CD79b genes. This arrangement contributes to the regulatory complexity of this region (20, 21). SCN4A encodes the α-subunit of the skeleton muscle voltage-gated sodium channel (22). CD79b gene encodes the Igβ protein that forms heterodimers with Igα to create a subunit of the B-cell antigen receptor complex (23). CD79b was initially considered to be expressed specifically in B cells (24). However, our published results demonstrated that CD79b is also robustly transcribed in human pituitary (25). In the case of hGH LCR actions in the pituitary, it has been specifically demonstrated that transcription of the region between the LCR and hGH-N, containing the CD79b gene (Fig. 1A), constitutes an essential step in the pathway of hGH-N gene activation (26).
FIGURE 1.

Verification of hGH/P1(ΔHSII) transgene structure and determination of transgene copy number. A, map of the hGH locus and surrounding region on chromosome 17q22-23. The locations of the SCN4A and CD79b genes are shown. The vertical arrows indicate the positions of the DNase I hypersensitive sites of the hGH LCR. Maps of the intact hGH/P1 and hGH/P1(ΔHSII) constructs are shown below the map of the locus. The BglII (B) and EcoRI (E) sites used to confirm the target deletion and determine the copy numbers of the transgene are labeled (short vertical lines). The position of the 1.2-kb deletion is shown in the map of hGH/P1(ΔHSII). B, Southern blot analysis to confirm the targeted HSII deletion and determine the copy numbers of the transgene in each line. Genomic DNA from three hGH/P1 (WT) and three HSII deletion lines (Δ) was digested with BglII or EcoRI, run on an agarose gel, transferred, and hybridized with radiolabeled probes corresponding to the HSI region and to the endogenous mouse ζ-globin gene. Fragments resulting from the constructs and probes are indicated with arrows on the right-hand side of the image. A total of five digestion/copy number analyses were conducted. The 1.2-kb deletion resulted in loss of one BglII site 5′ to the HSII. Therefore, the 1.6-kb BglII fragment in the WT hGH/P1 is shifted to 5 kb in the hGH/P1(ΔHSII) transgenic pituitaries. The three previous described WT hGH/P1 lines were used as references to determine the copy numbers of the transgene (3), as indicated below the Southern blot.
The two hypersensitive sites most proximal to hGH-N, HSI and HSII, are selectively established in pituitary chromatin and have been implicated in the regulation of hGH-N. The region encompassing HSI and HSII has been shown to physically interact with the hGH-N promoter, creating a higher-order chromatin “loop” in cells expressing hGH-N (27). HSI contains three critical binding sites for the pituitary-specific transcription factor Pit-1 (28). HSI activity is necessary for occupancy of Pit-1 at two cognate binding sites within the hGH-N promoter (28, 29). Deletion of two of the Pit-1 binding sites at HSI leads to a dramatic reduction of histone acetylation and noncoding transcription throughout the LCR, loss of Pit-1 recruitment to the hGH-N promoter, loss of LCR looping to the hGH-N promoter, and a significant relaxation of somatotrope restriction of hGH-N expression. The deletion of HSI also leads to greatly reduced hGH-N expression, amounting to only about 5% of that of the intact locus. Thus, HSI has been shown to be an essential and pivotal component of the hGH LCR (27, 30, 31).
In contrast to the detailed analysis of HSI, the role(s) of HSII in hGH-N expression remains less clear. However, several lines of evidence suggest that HSII plays an important role in this process. Detailed analyses of hGH/P1-derived transgenes demonstrate that HSII can form in the absence of HSI (31). Furthermore, in the absence of HSI, looping of the LCR to the hGH-N promoter is lost, but a second loop between the HSII region and the more 5′ components of the LCR (HSIII-V) is retained (27). Finally, when directly linked to hGH-N and assayed as transgenes in vivo, HSII on its own has no activity, HSI has a relatively low level of activity, whereas the combined presence of HSI and HSII results in a dramatic activation of hGH-N with generation of a consequent phenotype of gigantism (17). In the current report we directly assessed the roles of HSII in LCR function by deleting it from its native context in the hGH/P1 transgene. The data provide evidence that HSII is a distinct entity within the hGH LCR, playing a significant role in the establishment of robust levels of hGH-N in the mouse pituitary. The data further suggest unique mechanisms for HSII action that distinguish it from HSI and involve it in the assembly of an actively transcribing PolII complex. Finally, an analysis of a second set of transgenic lines in which we studied the actions of HSI/II in isolation from the rest of the locus suggests that HSII may be involved in the initial stages of histone modification and gene activation.
EXPERIMENTAL PROCEDURES
Deletion of the HSII Region from hGH/P1 and Establishment of Transgenic Mouse Lines
A P1 clone containing the entire hGH LCR and four of the most 5′ genes in the cluster had been previously reported and manipulated for the study of HSI (Fig. 1A) (3, 31). A similar homologous recombination approach was used to delete HSII. Two targeting arms, A and B, each of ∼700 base pairs were amplified from the hGH/P1 and amended with restriction sites for HindIII (5′ free end), BamHI (joined ends), or SalI (3′ free end) (Table 1 contains the primer sequences). The arms were joined together in their native orientation with splice-overlap extension PCR and cloned into the pGEM3z (Promega) vector. The fragment was excised from the pGEM3z vector using HindIII and SalI and cloned into the pSVI.RecA shuttle vector (a gift from N. Heintz, Rockefeller University). The resultant vector was transformed into Escherichia coli DH10B competent cells along with the hGH/P1 plasmid. Transformed bacteria were grown on tetracycline (10 μg/ml)(Tet) and kanamycin (25 μg/ml) (Kan) containing plates at 30 °C overnight. Eight colonies were picked and spread on Tet and Kan plates, then incubated at 43 °C overnight in a temperature selection step. Surviving colonies were screened for co-integration at arm B by PCR between primers located near the 3′ end of the A arm and downstream of the B arm. Co-integrants were then plated onto Kan LB plates and grown at 43 °C overnight to select for the second “resolution” recombination followed by selection on Kan and fusaric acid (TB) plates at 37 °C for 48 h (32). Fusaric acid was used as a selection for Tet-sensitive colonies (33, 34). The desired clones were identified by their failure to hybridize to a probe representing the deleted segment, a negative PCR result for sequences within HSII, and a PCR product length assay. The resulting plasmid was purified and verified by sequencing and restriction analysis. Once verified and linearized with NotI, the DNA was used for pronuclear injection. Three positive founder mice were identified and lines were established from each. Further testing of the transgene structure was performed by Southern blot using genomic DNA from hGH/P1(ΔHSII) F1 mice digested with BglII or EcoRI (Fig. 1B).
TABLE 1.
Primers used in these studies
| Purpose | Name | Sequence |
|---|---|---|
| hGH/P1 modification | Arm A 5′ | 5′-CCCAAGCTTCTGGGCAACAGAGCAAGACT-3′ |
| Arm A 3′ | 5′-CGCGGATCCGAGTGCAGTGGTGCAATCTC-3′ | |
| Arm B 5′ | 5′-CGCGGATCCCCAAGCCTTTCCCAGTTATA-3′ | |
| Arm B 3′ | 5′-CCGGAATTCCGGTGGACGAGCCACAGTGCTCAGGAAC-3′ | |
| hGH/P1 DNase I mapping | HSI, II probe 5′ | 5′-ACAGGCTGCAGCCGGTGCAGTT-3′ |
| HSI, II probe 3′ | 5′-CCCTCCTGCAGGGACTGGGTCC-3′ | |
| mhGH co-RT-PCR assay | mhGH 5′ | 5′-GCCTGCTCTGCCTGC-3′ |
| mhGH 3′ | 5′-GACTGGATGAGCAGCAG-3′ | |
| CD79b co-RT-PCR assay | mhCD79b 5′ | 5′-GGAGGAAGATCACACCT-3′ |
| mhCD79b 3′ | 5′-ATCCCCAGAGAACTCC-3′ | |
| Transcript analysis | HSV 5′ | 5′-TGTTCCTGGCTCTGCTGCTGAG-3′ |
| HSV 3′ | 5′-CAGGTCGGACTCCTCGGAGGCG-3 | |
| p5 5′ | 5′-GCCTCAAAACCTGATTGG-3′ | |
| p5 3′ | 5′-GGAGATCTCTGAGGCTGG-3 | |
| p4 5′ | 5′-GCTGTATTCTTCCAGACAAG-3′ | |
| p4 3′ | 5′-GAGCTAAGCTATGAGGATGC-3 | |
| F14 5′ (HSI) | 5′-CCAAGCCTTTCCCAGTTATAC-3′ | |
| F14 3′ (HSI) | 5′-GATCTTGGCCTAGGCCTCGGA-3′ | |
| CD79b Ex. 6 5′ | 5′-AGAGCCAGGTCGCCCCATGACC-3′ | |
| CD79b Ex. 6 3′ | 5′-TCACCTCATAGCACCCCCAGAA-3′ | |
| p1 5′ | 5′-GATTACAAGCGCCCACTACC-3′ | |
| p1 3′ | 5′-GAGAGAATAAGCCAGGAGGTG-3′ | |
| hGH-N Ex. 5 5′ | 5′-TGGAAGATGGCAGCCCCCGGAC-3′ | |
| hGH-N Ex. 5 3′ | 5′-TTTATTAGGACAAGGCTGGTGG-3′ | |
| p9 5′ | 5′-GA TGACACCCCTCTTGGA TC-3′ | |
| p9 3′ | 5′-TAGCACTTGACTCTGTAGAA-3 | |
| GAPDH 5′ | 5′-GCCAAAAGGGTCATCATCTC-3′ | |
| GAPDH 3′ | 5′-CTGCTTCACCACCTTCTTGA-3′ | |
| hGH/P1 ChIP | F14 5′ | Same sequence as in transcription analysis |
| F14 3′ | Same sequence as in transcription analysis | |
| hGH-Np 5′ | 5′-CAGGGCTATGGGAGGAAGAGCTT-3′ | |
| hGH-Np 3′ | 5′-CTTCTCTCCCACTGTTGCCC-3′ | |
| myoD 5′ | 5′-TTCCAGTCTAGCA AGTCCTCAGTT-3′ | |
| myoD 3′ | 5′-TTAGGGATGCCCCCTCTGGCGGA-3′ | |
| λHSI/II DNase I mapping | λ probe 5′ | 5′-AACAGTTCTGGCTGGAGTC-3′ |
| λ probe 3′ | 5′-ACGAGGTTTCTTCCTTCG-3′ | |
| λ Construct ChIP | HSI 5′ | 5′-TCCCAGATTTTGCCCCAC-3′ |
| HSI 3′ | 5′-AGGACCTGAGCCACGGAAG-3′ | |
| λ 5′ | 5′-TTCCCTGCCTCCAAACGATAC-3′ | |
| λ 3′ | 5′-CCGAGATAAAAACAAACCCGC-3′ | |
| mGH 5′ | 5′-CTGGGATCTTGCATAACC-3′ | |
| mGH 3′ | 5′-CCTCGACCCCAAGGCTCC-3′ | |
| myoD 5′ | Same sequence as in hGH/P1 ChIP | |
| myoD 3′ | Same sequence as in hGH/P1 ChIP |
DNase I Hypersensitive Site Mapping
The isolation of intact nuclei and Southern blots were performed to map the DNase I HSs as described with minor modifications (31). Briefly, nuclei constituting 100 μg of DNA from hGH/P1 and hGH/P1(ΔHSII) animals doubly transgenic for hGRF (see “Results”) were progressively digested with 100 units of DNase I nuclease. The resulting fragments were digested overnight with proteinase K, and the DNA was extracted with phenol:chloroform:isoamyl alcohol, precipitated with EtOH, and dissolved in 10 mm Tris-HCl, pH 8.0, 0.1 mm (Na)2EDTA buffer. The fragments were then digested with EcoRI, run on a 0.8% agarose gel, and transferred to a Zetabind nylon membrane (3M, Saint Paul, MN). The probe was amplified using Choice BlueTaq (Denville Scientific, Metuchen, NJ) and hGH/P1 genomic DNA as a template. Probes were labeled with [32P]dCTP (Table 1).
Co-RT-PCR Expression Assays
RNA was isolated from pituitary tissue using TRIzol (Invitrogen) and purified using the RNeasy Mini Kit with a RNase-free DNase set (Qiagen). cDNA generation and the co-RT-PCR method for the co-amplification of both mouse (m) and human (h) GH and CD79b were conducted as previously described with some modifications (17, 25). 0.5 μg of RNA was reverse transcribed with avian myeloblastosis virus reverse transcriptase and the radiolabeled 3′ mhGH primer. The entirety of the reverse transcription reaction volume was used for gene-specific amplification. Either the 5′ or 3′ primer was labeled with 32P-labeled ATP using T4 polynucleotide kinase (Table 1). Choice BlueTaq was used for the amplification. Mouse and human products were differentiated by digestion with restriction enzymes: hGH-N was selectively cut by BstNI, mCD79b by HinfI, and hCD79b by SfcI. Products were run on 6% acrylamide and imaged with a Storm 840 PhosphorImager (GE Healthcare). ImageQuant software was used for quantification (GE Healthcare).
Quantitative PCR
RNA was isolated as above. All products used for the rest of the procedure were obtained from Applied Biosystems (Foster City, CA). cDNA libraries were generated using the High-Capacity cDNA Reverse Transcription Kit with 1 μg of RNA. The TaqMan Universal PCR Master Mix and 7900HT machine were used to perform the amplification on specific genes. Probe products were Hs00236859-m1 (hGH1), Hs00236881-m1 (hCD79b), and Mm99999915-gl (mGAPDH). The results were analyzed with SDS2.2 software and were normalized to the signal from mouse GAPDH.
Immunostaining and Cell Imaging
Immunostaining was conducted as previously described (30). Whole pituitaries were dissociated into single-cell suspensions using enzyme-free cell dissociation buffer (Invitrogen), washed, and suspended in DMEM with 10% fetal bovine serum, and applied directly to polylysine-coated slides. Cells were fixed with 4% formaldehyde in PBS at room temperature for 10 min and washed three times with PBS. Cells were permeabilized by incubation in a solution of 0.5% saponin and 0.5% Triton X-100 for 10 min at room temperature. Blocking was performed with 5% donkey serum, 2% BSA, and 0.1% Tween 20 in 4× SSC at room temperature in a damp chamber for 20 min. For reaction with anti-mGH, a monkey anti-rat antibody (National Institutes of Health, Torrance, CA) was used at a dilution of 1:1000. This anti-rGH antibody also recognizes mGH. For hGH-specific detection, the described mAb9 monoclonal antibody (35) was used at a dilution of 1:2000. Dilutions were prepared in the blocking buffer and the primary antibodies were allowed to react for 1 h in a damp chamber. Subsequently, the primary antibody was washed off with 4× SSC and 0.1% Triton X-100 three times for 5 min each. Cy3 donkey anti-human secondary antibody and Cy2 donkey anti-mouse antibody (Jackson ImmunoResearch, West Grove, PA) diluted 1:200 were applied for reaction with mGH and hGH, respectively, and allowed to react for 1 h in a damp chamber. Cell nuclei were stained with TO-PRO-3 iodide (Invitrogen). The cells were washed three times as before and mounted with fluorescent mounting medium (KPL, Gaithersburg, FL). Cells were imaged by confocal microscopy (Leica TCS SP) and captured by Leica TCS software.
Quantitation of Noncoding Transcripts
The protocol was conducted as previously described with several modifications (31). From each pituitary, a cDNA library was generated using 1 μg of total DNase-treated RNA and the High-Capacity cDNA Reverse Transcription Kit (Applied Biosystems). A control reaction, without reverse transcriptase (RT), was included for each sample to control for contamination with genomic DNA. 1 μl of the 20 μl of reaction was used for each site-specific primer set. Products were run on agarose gels and transferred to Zetabind nylon membranes. Probes with the same sequence as the PCR products were generated from hGH/P1 genomic DNA, labeled with [32P]dCTP, and hybridized to the membranes. Background signal from the RT(−) control sample was subtracted before normalizations to GAPDH, copy number, and probe signal strength (between separate hybridization reactions) were performed (Table 1).
Chromatin Immunoprecipitation Assays
ChIP was conducted as previously described (31). Cells were dissociated in enzyme-free buffer (Invitrogen) and transferred to DMEM with 10% fetal bovine serum. Cross-linking was performed in 1% formaldehyde and quenched with 0.125 m glycine followed by two washes with cold PBS. Nuclei were pelleted and resuspended in lysis buffer (50 mm Tris-HCl, pH 8.1, 10 mm EDTA, 1% SDS, 10 mm sodium butyrate, and 0.1 mm PMSF) and incubated on ice for 10 min. Chromatin was sheared to an average size of 500 bp using a Sonic Dismembrator (Fisher Scientific). Soluble chromatin was concentrated using an Amicon Ultra column (Millipore). A fraction of the material was kept as an input control, and the chromatin was pre-cleared using Protein A-agarose beads. Chromatin (50 μg) was incubated with 20 mg of polyclonal antibody (acetylated H3 or H4 antibody, Millipore; Pit-1 antibody, Santa Cruz; total PolII antibody, Santa Cruz; phosphorylated Ser-5 PolII antibody, Abcam, Cambridge, MA) or IgG (Santa Cruz) with Protein A-agarose beads overnight at 4 °C. The following day, the beads were washed 5 min each with low salt buffer (20 mm Tris-HCl, pH 8.1, 150 mm NaCl, 0.1% SDS, 1% Triton X-100, 2 mm EDTA, 10 mm NaBT, 0.1 mm PMSF and protease inhibitor), high salt buffer (same composition as previous buffer, but with 500 mm NaCl), LiCl buffer (10 mm Tris-Cl, pH 8.1, 250 mm LiCl, 1% Nonidet P-40, 1% sodium deoxycholoate, 1 mm EDTA, 10 mm NaBT), and TE. DNA was eluted from beads twice using 1% SDS and 0.1 m NaHCO3 at room temperature for 15 min and cross-links were reversed by overnight incubation at 65 °C in 0.2 m NaCl and 40 μg/ml of RNase. Proteins were subsequently digested with the addition of proteinase K and incubated at 42 °C for 2 h. DNA was extracted with phenol:chloroform:isoamyl alcohol, resuspended in water, and analyzed by PCR with the specified primer pairs (Table 1). Products were run on 2% agarose gels and transferred to Zetabind nylon membranes. Membranes were hybridized at 65 °C with 32P-labeled probe generated with the same primer pairs (using hGH/P1 plasmid as a template). The membrane was subsequently washed with buffers containing decreasing concentrations of SSC and 0.1% SDS. Band intensities were quantified using a Storm 840 PhosphorImager and expressed relative to the signal obtained from normal IgG.
RESULTS
Development of an in Vivo Model for Study of HSII
Previous work has established and validated an hGH/P1 transgenic mouse model for the study of hGH gene regulation. This hGH/P1 transgene (Fig. 1A) accurately recapitulates the selective and robust expression of hGH-N in pituitary somatotropes with the corresponding assembly of the full array of hGH LCR HS sites as originally mapped in primary human somatotrope chromatin (31). HSI and HSII are encompassed within a 1.6-kb BglII fragment4 located 14.5–16.1 kb 5′ to the hGH-N promoter (17). HSI is located within a 404-bp subsegment at the 3′ end of this fragment and HSII has been mapped to the more 5′ 1.2-kb segment (35). Therefore, to selectively remove HSII, the 1.2-kb region was deleted from the hGH/P1 transgene (Fig. 1A). A two-step recombineering strategy was used to effect this HSII deletion. The deletion from the plasmid was verified by restriction enzyme fingerprinting and sequencing through the deletion site. The resultant P1 plasmid was linearized and microinjected into fertilized mouse oocytes, followed by re-implantation into a pseudo-pregnant recipient. Pups from five litters were screened for transgene insertion and three independent transgenic founders were identified. Each line was subjected to targeted PCR across the deletion site and Southern blot “fingerprinting” was carried out to verify that the transgene was intact (see “Experimental Procedures”). The target deletion was confirmed by Southern blot of BglII-digested mouse genomic DNA (Fig. 1B). The transgene copy number was determined for each line by PhosphorImager/ImageQuant volume analysis of Southern blots of EcoRI-digested mouse genomic DNA (Fig. 1B). Three previously described hGH/P1 lines were used as references for the copy number determinations (3). Each of the three founder mice was crossed with CD1 mates to establish lines for further analysis. In a subset of studies, mice carrying the hGH transgene were crossed with mice carrying a human growth hormone-releasing factor (hGRF) transgene. The ectopic overexpression of this trophic hormone stimulates pituitary hyperplasia, specifically expanding the somatotrope population for subsequent chromatin studies (36).
HSI and HSII Form Independently
The impact of the HSII deletion was first assayed with regard to known hypersensitive sites at the locus. HS mapping was carried out by indirect end labeling Southern analysis of pituitary nuclei isolated from compound transgenic mice carrying either the hGH/P1 or hGH/P1(ΔHSII) along with the hGRF transgene (Fig. 2A). As expected, HSI and HSII could be clearly identified in the chromatin isolated from the hGH/P1 pituitaries (17). Consistent with the targeted deletion of HSII, the mapping of the pituitary chromatin from the hGH/P1(ΔHSII) mouse showed a single band that co-migrated with HSI (Fig. 2B). This analysis confirmed the deletion of HSII and revealed that the formation of HSI is independent of the presence of HSII. Previous studies of the hGH/P1(ΔHSI) transgene demonstrated that HSII forms in the absence of HSI (31). Taken together, these results suggested that the two hypersensitive sites form independently of one another. Interestingly, HSI morphology in the hGH/P1(ΔHSII) pituitary locus appeared slightly broader than in the hGH/P1 locus suggesting that its extent might have been slightly altered in the absence of HSII (Fig. 2, C and D) and a possible new HS was detected (Fig. 2, B–D).
FIGURE 2.

HSI is assembled independent of the actions of HSII. A, hGH-N locus and DNase I mapping strategy. The hGH gene cluster and upstream genes are shown. Previously identified DNase I HS that form in pituitary chromatin (17) are indicated by the labeled vertical arrows. An expanded view of the region 5′ to the hGH-N gene (below) highlights the indirect end-labeling strategy used for the DNase I HS mapping in this region. EcoRI restriction sites were utilized for DNase I mapping, as shown. The region encompassing HSII that was deleted from hGH/P1 to generate the hGH/P1(ΔHSII) is indicated (dashed lines). Fragments expected to result from each HS are shown below. B, representative Southern blot showing the HS bands detected 5′ to the hGH-N gene in the pituitary chromatin of the hGH/P1 transgene locus and in the locus containing the derivative hGH/P1(ΔHSII) transgene. Pituitary nuclei from compound transgene mice carrying the hGRF transgene and either the hGH/P1 (line 811D) or the HSII-deleted derivative transgene (line 1374M3) were permeabilized and digested with DNase I. Aliquots were removed at the selected time points and digested to completion with EcoRI. The resulting DNA fragments were run on an agarose gel, transferred to a nylon membrane, and probed with the probe fragment shown in A. The HS visualized on the autoradiogram are labeled in accordance with the diagram in A. Site HSI* represents the HS in the hGH/P1(ΔHSII) transgene that co-migrated with HSI. DNA size markers are indicated (left). Observed HS are indicated with arrows (left and right). C, densitometric scan of the HS mapping autoradiogram shown in B. Scans were performed linearly with single pixel depth, from top to bottom of the image, using ImageJ software. The y axis is designated in arbitrary density units, and peaks representing hypersensitive sites are labeled with arrows. The hGH/P1 data are indicated above and the hGH/P1(ΔHSII) below. D, summary of HS that form 5′ to hGH-N in the hGH/P1 and the hGH/P1(ΔHSII) transgenic loci in pituitary chromatin. Migration distances of observed fragments were compared with standard size markers to determine positions of the HS and are shown by the arrows.
Deletion of HSII from the hGH/P1 Transgene Results in a Significant Reduction in hGH-N mRNA Expression
Next, we investigated the impact of HSII inactivation on the expression of the remote hGH-N gene. The levels of hGH-N mRNA in the hGH/P1 pituitary were compared with that in the hGH/P1(ΔHSII) pituitary by a previously validated co-RT-PCR method (17). In this procedure, the mRNA encoding mouse and human growth hormones (mGH and hGH) are simultaneously co-amplified and then differentiated from one another based on restriction enzyme digestion (31). hGH-N mRNA levels in the pituitaries of mice from four distinct hGH/P1 lines (3) were compared with those in the three hGH/P1(ΔHSII) lines. The hGH mRNA levels in each line were normalized to the corresponding transgene copy number. In all three of the transgenic lines, levels of human growth hormone were reduced more than 4-fold from average hGH/P1 levels (Fig. 3, A and B). An independent quantitative PCR assay using a probe set that was specific for hGH mRNA verified these results (Fig. 3C). These data demonstrated that HSII of the hGH LCR has a nonredundant role in enhancement of hGH-N expression in the pituitary.
FIGURE 3.
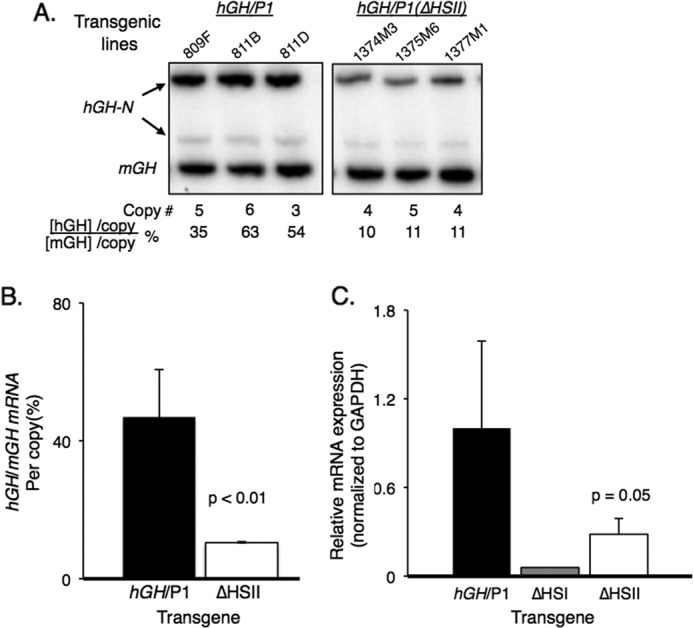
Deletion of HSII from the hGH/P1 transgene resulted in significant loss of hGH-N transgene expression. A, RT-PCR analysis of hGH-N transgene expression. Total RNA was extracted from the pituitaries of three hGH/P1 and three hGH/P1(ΔHSII) transgenic mice. Each RNA sample was reverse transcribed to generate a cDNA library. A PCR was conducted with 32P-radiolabeled primers that co-amplify human and mouse GH mRNAs. The amplified cDNA products were digested with BstNI to separate mouse from human products, and the samples were visualized on an acrylamide gel. The mouse- and human-specific GH cDNA fragments are labeled. The faint band represents an alternatively spliced hGH-N transcript that was not included in the quantification. Transgene copy numbers for each mouse line and the normalized percent hGH-N expression are shown below the autoradiogram. B, quantification of hGH-N transgene expression by co-RT-PCR. All three hGH/P1(ΔHSII) transgenic lines were analyzed in parallel with four hGH/P1 lines. A minimum of seven mice carrying each line was assayed. Error bars indicate 1 S.D. The difference between the products from each construct was significant; p < 0.01 (Student's t test, two-tailed). C, quantification of hGH-N transgene expression by quantitative PCR. Quantitative PCR was conducted on RNA isolated from pituitaries of three hGH/P1(ΔHSII) and three hGH/P1 transgenic mice. A single sample from an hGH/P1(ΔHSI) mouse was included for an additional comparison. The reduced expression in the ΔHSII animals was significant; p = 0.05 (Student's t test, two-tailed).
Somatotrope Restriction of hGH-N Transgene Expression Is Fully Retained in the Absence of HSII
We have previously reported that HSI, in addition to its role in enhancing hGH-N expression, also plays a role in restricting hGH-N transgene expression to somatotropes (30). Although the overall expression of hGH-N mRNA from the hGH/P1(ΔHSI) transgene is much reduced when compared with that of the structurally intact transgene, we observed that 14% of the hGH-expressing cells in the pituitary were mGH(−). This means that the somatotrope restriction of hGH-N was relaxed subsequent to HSI deletion (30). To assess the impact of HSII on cell type specification, we subjected pituitary cells from hGH/P1(ΔHSII) mice to immunofluorescent microscopy analysis. In a study of over 100 hGH-N-expressing cells from each of two transgenic lines, there was no evidence of hGH-N expression in mGH(−) cells (Fig. 4). These data indicated that HSII differs significantly from HSI in that its role in enhancing hGH-N expression is not coupled with activity regulating the cell type-specific restriction of hGH-N.
FIGURE 4.

Cell-type specificity of hGH-N expression is maintained in the hGH(ΔHSII) transgenic pituitary. Disaggregated pituitary cells from two hGH/P1(ΔHSII) transgenic lines were stained with antibodies specifically recognizing mouse (red) or human (green) growth hormone. Nuclei were also visualized with TO-PRO-3 iodide (blue). In an analysis of >100 cells from each of two transgenic lines, no cells were found to be positive for hGH-N in the absence of the mouse GH. All cells shown in the sample figure express both proteins. Thus, the deletion of HSII did not alter the strict somatotrope specificity of hGH expression.
The HSII-deleted Locus Retains Full Levels of Noncoding Transcription Across the CD79b Gene
Prior studies have mapped a B-cell expressed gene, CD79b, to a position between the hGH LCR and the hGH gene cluster (20) (see Fig. 1A). Remarkably, hCD79b mRNA is highly expressed in the pituitaries of humans and in the pituitaries of mice carrying the hGH/P1 transgene (25). The hCD79b protein product, Igβ, is specific to B cells and is not present in the pituitary. For this reason, this CD79b transcription in the pituitary is considered to be “noncoding.” Importantly, the transcription across the hCD79b gene in the pituitary is essential for HSI-dependent enhancement of hGH-N expression (26). HSI deletion dramatically reduced CD79b transcription, commensurate with a dramatic reduction in hGH-N expression (26). Furthermore, selective blockade of the CD79b transcription has a similar repressive effect on hGH-N expression (26). With these data in mind, it was of interest to assess the impact of deleting HSII on hCD79b expression. CD79b mRNA levels were assessed in the pituitaries of hGH/P1(ΔHSII) mice by a previously validated RT-PCR co-amplification assay (Fig. 5A) and in parallel by quantitative RT-PCR (37). Both assays revealed that the levels of CD79b mRNA were unaltered by the deletion of HSII from the hGH/P1 transgene (Fig. 5, B and C). These data demonstrated that the negative impact of the HSII deletion on hGH-N mRNA expression reflects a mechanism distinct from that occurring subsequent to the deletion of HSI.
FIGURE 5.
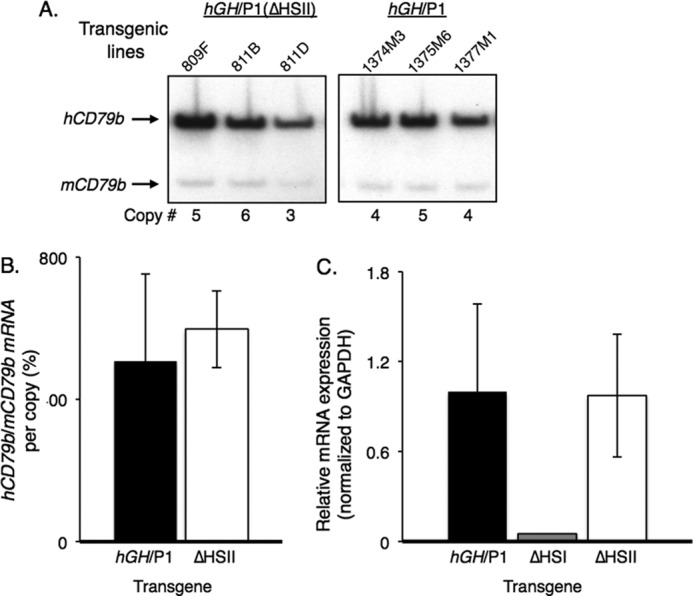
Deletion of HSII from the hGH/P1 transgene does not alter transcription through the intervening hCD79b gene. A, representative assay of hCD79b transcription. Human and mouse cDNA products of the RT-PCR analyses in hGH/P1 and hGH/P1(ΔHSII) pituitaries are indicated (labeled arrows). B, quantification of CD79b co-RT-PCR analyses. At least three samples were analyzed from each construct. No significant differences in transcripts produced was observed between the two transgenes. C, quantitative RT-PCR analyses of hCD79b expression. Quantitative PCR was conducted on cDNAs from three ΔHSII pituitaries and three hGH/P1 control animals. A single sample from an hGH/P1(ΔHSI) mouse was included for comparison. The results were similar to those obtained through the co-RT-PCR assay and confirmed previous analyses of the hGH/P1(ΔHSI) transgene (31). No significant reduction was seen in the hCD79b expression from the hGH/P1(ΔHSII) transgene, whereas transcripts in hGH/P1(ΔHSI) were nearly ablated.
Studies were next undertaken to determine whether the deletion of HSII had any adverse effects on noncoding transcription in the remainder of the hGH LCR (26). Although such transcription is at significantly lower levels than at CD79b and has not been shown to be of functional importance, alterations might reflect general alterations in the configuration of the chromatin locus. Amplimer sets both upstream and downstream of HSI and HSII and the hGH-N gene were used to detect transcribed RNA in hGH/P1(ΔHSII) pituitaries (Fig. 6A). Whereas the transcript levels were highly variable between samples, the transcriptional profile across the locus was similar to the profiles seen in the hGH/P1 transgene (26). The hGH-N and CD79b regions were robustly transcribed relative to other regions in the locus, as was the upstream p5 region at the 3′ end of the SCN4 gene. The p1 region, between the CD79b and hGH-N genes, and p9 region, downstream of hGH-N, were transcribed at low levels (Fig. 6B). This pattern of relative transcription levels at different regions of the LCR was in accordance with those observed from the hGH/P1 transgene (26). Thus, the negative impact of the HSII deletion on hGH-N expression did not appear to be linked to alterations in noncoding transcription within the hGH LCR.
FIGURE 6.

The hGH/P1(ΔHSII) transgene retains active transcription across the hGH LCR. A, amplimers used to assess transcription across the hGH transgene locus are indicated below the map. B, transcription across the hGH/P1(ΔHSII) locus. The levels of pituitary transcripts at each amplimer site were normalized to the corresponding signal from hGH/P1 plasmid DNA. Amplifications were performed within the linear range, as determined by analysis of 10-fold plasmid dilutions (not shown). As in the hGH/P1 locus, levels of transcription of hGH-N and hCD79b were significantly higher than those within the LCR. Low-level transcription occurred both upstream and downstream of the hCD79b and hGH-N genes. Bar heights represent average signal value, with error bars indicating 1 mean ± S.D.
Deletion of HSII Fails to Alter the Levels of Histone H4 Acetylation at HSI or the hGH-N Promoter
The domain of histone acetylation at the active hGH/P1 locus in the pituitary extends for 32 kb from HSV to the hGH-N promoter, peaking in intensity at a region coincident with HSI and HSII. Deletion of HSI results in a dramatic decrease of acetylation at both the LCR and hGH-N promoter regions in concert with the loss of hGH-N expression (31). Acetylation levels of the hGH/P1(ΔHSII) locus were similarly tested by chromatin immunoprecipitation (ChIP). Despite the significant negative effect on hGH-N expression observed in the hGH/P1(ΔHSII), no change was seen in acetylation at either HSI or the hGH-N promoter in the absence of HSII (Fig. 7, A and B). These data suggested that the impact of HSII on hGH-N expression is not directly related to an effect on histone H4 acetylation.
FIGURE 7.
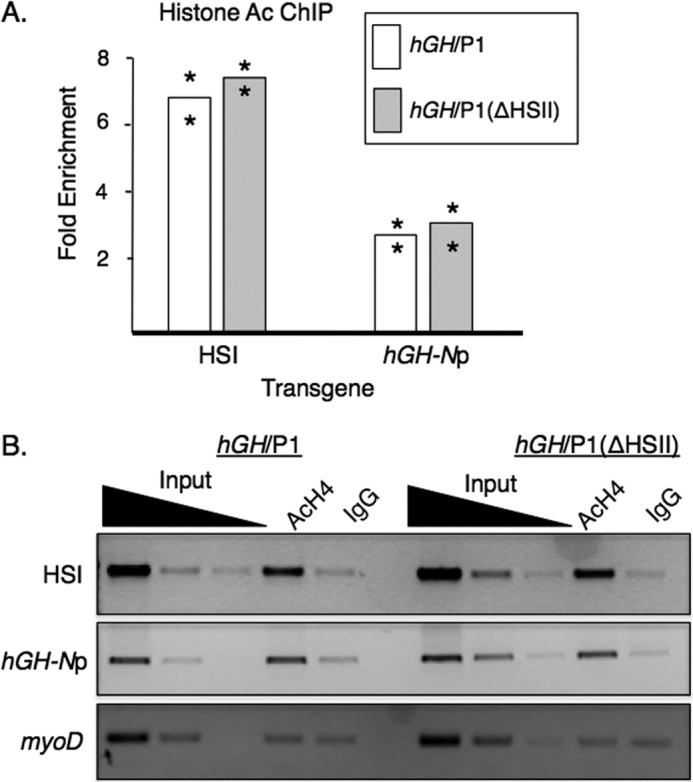
Deletion of HSII did not alter histone H4 acetylation at HSI or the hGH-N promoter. A, ChIP analysis of histone H4 acetylation in pituitary chromatin from the hGH/P1 and hGH/P1(ΔHSII) transgenic lines. ChIP assays were performed on pituitary chromatin from animals doubly transgenic for either hGH/P1 or hGH/P1(ΔHSII) and the hGRF transgene. The fold-enrichment was calculated from the antibody-bound fraction over IgG-bound background and normalized to the signal at the inactive promoter of myoD. Bar heights represent averages. Two independent lines were analyzed; asterisks indicate values for each line. HSI and hGH-Np below the graph indicate the respective primer locations. B, representative histone H4 acetylation ChIP assay. An ethidium bromide-stained agarose gel is shown. Input dilutions are serially 10-fold. The control IgG antibody recognizes total rabbit immunoglobulin G.
HSII Promotes Pit-1 Recruitment at the hGH-N Promoter
The pituitary-specific transcription factor Pit-1 has been shown to occupy both the hGH-N promoter sequence and the HSI region in the pituitary of the intact hGH/P1 transgene (28, 38, 39). Inactivation of HSI by targeted deletion of its Pit-1 binding sites effectively eliminates Pit-1 occupancy at the hGH-N promoter 15 kb downstream (31). As Pit-1 binding at the promoter is required for hGH-N activation (29, 39), this loss is consistent with the dramatic reduction in hGH-N expression seen in the ΔHSI transgenic pituitary. With this in mind, we analyzed whether deletion of HSII resulted in a loss of Pit-1 occupancy at either of the known Pit-1 recruitment regions, HSI or the hGH-N promoter. HSII deletion resulted in reduced recruitment of Pit-1 by ∼60% at the hGH-N promoter. Remarkably, binding at the HSI region was unaffected (Fig. 8A). These data indicated that HSII, like HSI, promotes effective transcription of hGH-N at least in part by facilitating Pit-1 binding to the target promoter.
FIGURE 8.
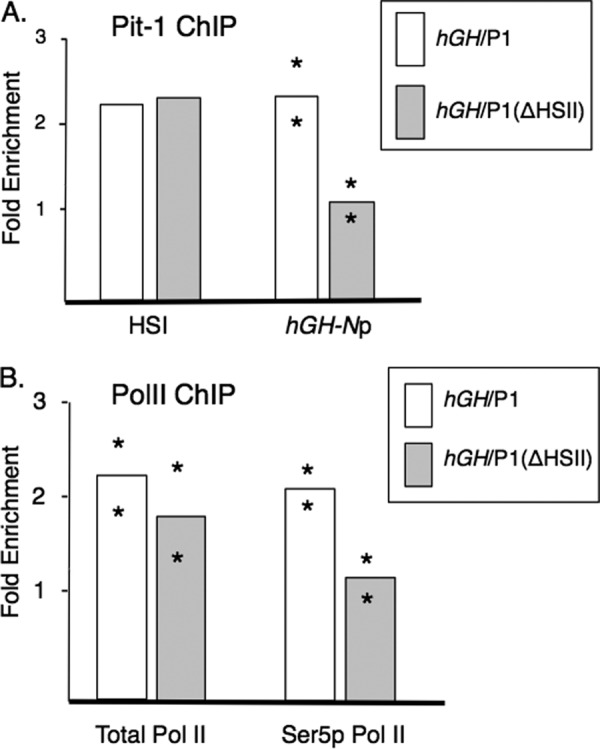
Deletion of HSII resulted in significant loss of Pit-1 recruitment and selective decrease in the phosphorylated Ser-5 isoform of PolII at the hGH-N promoter. A, ChIP was performed on pituitary chromatin from hGH/P1 or hGH/P1(ΔHSII) transgenic mice using an antibody that was raised against full-length Pit-1 protein. The fold-enrichment was calculated as antibody signal over the IgG background, normalized to the signal at myoD, an inactive promoter. Two lines were tested for enrichment at the hGH-N promoter, and one line was assayed for enrichment at HSI. All mice analyzed were compound transgenics carrying the indicated hGH transgenes and a transgene overexpressing hGRF. Bar heights represent averages, with asterisks indicating individual results from independent lines. Note that Pit-1 was decreased at the hGH-N promoter but not at HSI. B, deletion of HSII from the hGH transgene locus resulted in decreased occupancy by the elongation-competent isoform of RNA polymerase II (Ser5p PolII) at the hGH promoter. ChIP was performed against total RNA polymerase II (left) and with an antibody that is selective to PolII phosphorylated at Ser-5 of the CTD (right). Mice that were compound transgenic for the noted hGH transgene along with the hGRF transgene were assayed. Calculation and notation are the same as in Fig. 7.
Absence of HSII Results in Decreased Levels of Serine 5 Phosphorylated PolII at the hGH-N Promoter
The marked decrease in hGH-N mRNA expression from the hGH/P1(ΔHSII) transgene led to an investigation of PolII occupancy at the target hGH-N promoter. A ChIP assay directed against total PolII was conducted on pituitary chromatin isolated from intact hGH/P1 and the hGH/P1(ΔHSII) transgenic mice. The chromatin enrichment for PolII was assessed in the immunoprecipitated fraction with a primer set specific to the hGH-N promoter. Despite the reduction of hGH-N transcripts in the hGH/P1(ΔHSII) pituitaries as compared with hGH/P1, the assay revealed no significant difference in total PolII recruitment at the hGH-N promoter between the two transgenic constructs (Fig. 8B, left). This result contrasts with that obtained for the hGH/P1(ΔHSI) transgene, in which PolII occupancy at the hGH-N promoter and LCR was markedly reduced (26).
Next it was determined whether HSII was involved in a more distal step in PolII action. Whereas multiple prior studies had demonstrated that the PolII recruited to a promoter is unmodified, these studies have also shown that release of PolII from the promoter during the initiation of transcription is tightly linked to phosphorylation of its C-terminal domain (CTD). The initial phosphorylation at Ser-5 of the heptad CTD repeat is carried out by a transcription factor IIH-dependent mechanism (40). With this in mind ChIP assays were performed with an antibody against the phosphorylated Ser-5 PolII isoform. Results of this ChIP analysis revealed a decrease in the presence of phosphorylated Ser-5 PolII at the promoter in the HSII deletion versus the hGH/P1 construct (Fig. 8B, right). These data suggest that the HSII sequence may play a role in PolII release from the hGH-N promoter.
HSII Cooperates with HSI in HAT Recruitment
The essential role of a particular LCR determinant can be effectively assessed by deleting it from an otherwise intact locus, as described above. However, the sufficiency of such elements in carrying out specific functions can best be assessed by complementary models in which the determinant is isolated in the context of a “neutral” environment. With this in mind, we isolated HSI and HSI/HSII from the hGH/P1 plasmid and inserted these segments into a unique XbaI site centrally located in the 48-kb λ-phage genome. A construct containing HSII alone was not generated, as the HSII sequence was previously found to have no activity in the absence of HSI (35). λ-Phage DNA has previously been used successfully as a neutral “spacer” sequence in a vertebrate model (41). Transgene constructs were made comprising the 404-bp fragment encompassing HSI or the 1.6-kb BglII encompassing HSI and -II (Fig. 9A). A set of transgenic founders were identified and crossed with mice carrying the hGRF transgene to generate sufficient pituitary somatotrope chromatin for analysis.
FIGURE 9.

The ability of HSI to recruit H4 HAT activity is dependent on the action of HSII. A, structure of the λHSI/II and λHSI transgenes. The hGH-N LCR and surrounding region is shown, as are the transgenic constructs that utilized the λ phage genome framework. A fragment of the LCR was inserted centrally into the 48-kb λ phage genome at a unique XbaI site. Two fragments were individually inserted: a 1.6-kb BglII fragment containing the contiguous HSI and HSII sequences in their native context and a 404-bp fragment encompassing the isolated HSI. The positions of the DNase I HS segments are indicated by the labeled arrows (above). Small black bars represent PCR amplicons used in the ChIP assays. B, histone H3 and H4 acetylation and Pit-1 occupancy at the LCR insertion within the λ transgenes. Two lines carrying λHSI/II and one line carrying λHSI were tested. In the case of the Pit-1 ChIP assay, a single hGH/P1 line was used as a positive control. Bars represent averages; asterisks represent values for independent lines. C, representative results for histone H4 acetylation and Pit-1 ChIPs. An agarose gel is shown. Input dilutions are serially 10-fold. Analysis of acetylation at the endogenous mGHp served as a positive control for the ChIP assay. A downstream region (λ3′) was tested to determine whether a domain of acetylation was established surrounding the HSI/II region; these results were negative in the two lines tested.
The HSI or HSI and HSII sequence within the λ constructs was tested for their ability to recruit Pit-1, generate local transcription, or target HAT activity (Fig. 9 B, and C, and data not shown). All studies for Pit-1 enrichment or for locally generated RNA were essentially negative (data not shown). Assessment for acetylation of histone H4 was more revealing. HSI alone in the λ phage DNA context (λ/HSI transgene) proved insufficient for establishment of histone acetylation at HSI. However, ChIP performed on pituitary chromatin from the λ/HSI/II transgenic mouse revealed acetylation above background levels, although much lower than that measured in the native transgene (Fig. 9, B and C). These data suggested that HSII works in conjunction with HSI to generate an activity that is sufficient for recruitment of H4 HAT activity. Although present, this activity alone is insufficient to support local Pit-1 occupancy or to recruit active polymerase (Fig. 9, B and C).
DISCUSSION
Previous work had elucidated functions for HSI in its native setting and orientation. In contrast, prior studies of the HSII determinant have been less definitive and have been conducted in artificial contexts. The current study serves to analyze HSII function both within the context of the native LCR in intact pituitary, and in an isolated environment independently of other LCR determinants and the target hGH-N promoter. The data support a model in which HSII may an play essential role(s) in the activation and transcription of hGH-N. These data further suggest that activity of HSII is distinct from that of HSI and that these two determinants may work in very different ways to coordinately support full levels of hGH-N expression in the pituitary.
The data regarding hGH-N expression demonstrated that the 1.2-kb sequence encompassing HSII, located 15.5 kb 5′ to the hGH-N promoter, plays an essential and nonredundant role in hGH-N expression (Fig. 3). The deletion of HSII from the hGH/P1 transgene resulted in a significant decrease in hGH-N mRNA levels. This negative effect occurred in a context in which HSI is still formed (Fig. 2). These data, along with our prior studies, demonstrated that HSI and HSII can assemble independent of each other and that both serve essential roles in the support of robust hGH-N expression. Importantly, the tight linkage of HSI-dependent enhancement of hGH-N expression with the level of noncoding transcription across CD79b is clearly not evident in the case of HSII (Fig. 6). This distinction indicates that the role of HSII is distinct in nature: HSII may be involved in a higher-order structure at the active locus, perhaps stabilizing the LCR contact with the downstream hGH-N gene rather than establishing the concentrated focus of PolII activity over CD79b that appears to be essential for the HSI effect (26).
Our prior studies have demonstrated that Pit-1 occupies cognate sites both at HSI and at the hGH-N promoter when analyzed in the context of the hGH/P1 transgene in pituitary chromatin. A recent report carried out in an in vitro system indicates that Pit-1 may also bind HSII (42). Our prior analysis of the hGH/P1(ΔHSI) transgene does not support independent Pit-1 binding to HSII in vivo, as there is no significant binding to this region in the absence of HSI although HSII is effectively assembled at this mutant locus.
Although the work in the current study has elucidated several functions facilitated by the HSII sequence, we have not as of yet been able to identify specific trans-acting proteins that correspond to HSII formation and function. It is possible to envision a model in which HSI and HSII work in concert, both facilitated by binding of Pit-1 protein. As in the case of HSI deletion, hGH/P1(ΔHSII) pituitary cells experience a loss of Pit-1 recruitment at the hGH-N promoter when compared with hGH/P1 levels (Fig. 8A). This observation, along with the results for transcription throughout the locus, may be indicative of a role for HSII in establishing physical proximity between the LCR and gene. The maintenance of histone acetylation at both LCR and HSI in the ΔHSII transgene represents another distinction between the roles of HSI and HSII and suggests that HSII may be involved in processes other than recruitment of histone acetyltransferases (Fig. 7).
One of the more interesting findings in this study was the discovery that deletion of HSII had no significant impact on total PolII recruitment to the hGH-N promoter and yet resulted in a decrease in the levels of phosphorylated Ser-5 RNA polymerase II at that site (Fig. 8B, right). This decrease could reflect a number of models, but the current understanding of PolII activity suggests an impediment of release of PolII from the hGH-N promoter. Namely, the decrease in levels of modified PollI in the hGH/P1(ΔHSII) transgene at the hGH-N promoter may reflect a defect in the recruitment of a required kinase necessary for PolII modification and initiation of transcriptional elongation. Several such kinases have been identified, including a subset that acts on Ser-5 of RNA PolII. These include the cyclin-dependent kinases CDK8 and CDK9 in addition to transcription factor IIH (40, 43). The loss of kinase activity would decrease the conversion of PolII to the Ser-5 phosphorylated isoform and diminish release of PolII to the active elongation (44, 45). This would be consistent with the normal level of total PolII at the promoter of the hGH-N gene in the hGH/P1(ΔHSII) locus and yet the decreased overall generation of hGH-N transcripts. This model would also be consistent with prior studies of the human β-globin LCR in which the β-globin gene promoter has been shown to recruit RNA polymerase independently of its LCR. The essential function of the LCR appears to be to enhance β-globin transcription at the elongation step, both by recruitment of elongation complexes (such as FACT and DSIF) and increased phosphorylation of the Ser-5 residue of the CTD. These activities result in a corresponding enhancement of PolII release and induction of the elongation step of transcription (46, 47).
Another significant finding of this study was that HSII can exert a histone-modifying activity in the absence of the hGH-N promoter. HSI in a neutral context, centrally located in the λ genome transgene, proved insufficient to recruit HAT activity. However, HSI and HSII together led to an appreciable accumulation of H4 acetylation (Fig. 9B). Although not at the level of enrichment observed in the native locus, this histone modification could represent an initial step in chromatin domain activation that could be enhanced and amplified by other determinants, including interactions with the hGH-N promoter, with a final reconfiguration of the higher-order structure of the locus. These data would be consistent with an HSII-dependent “initiation” role for the pituitary-specific determinants taking place upstream of other activating events at the locus.
In summary, HSII of the hGH locus control region has been demonstrated to be a distinct and essential contributor to the robust expression of the pituitary-specific hGH-N gene. This regulatory element affects the recruitment of Pit-1 and post-translational modification of RNA polymerase II. This analysis clearly demonstrates that the enhancing actions of HSII on hGH-N expression are mediated via mechanisms that are distinct from those of the adjacent HSI. These studies establish a foundation for future research on the structure of the hGH/P1(ΔHSII) locus, and support a rationale for further investigations directed at both the identification of additional protein trans factors active in hGH-N expression and the determination of the order of events that occur during activation of the pituitary locus.
Acknowledgments
We thank Dr. Brian Shewchuk (East Carolina University, Department of Biochemistry and Molecular Biology) for the λ phage construct. We are grateful to the Transgenic and Chimeric Mouse Core of the University of Pennsylvania for generation of all transgenic lines (supported by National Institutes of Health Center Grants P30DK050306, P30DK019525, and P30CA016520).
This work was supported, in whole or in part, by National Institutes of Health Grants R01HD/DK25147 and R01HD/DK046737 (to N. E. C. and S. A. L).
B. K. Jones, unpublished observations.
- LCR
- locus control region
- HS
- hypersensitive site
- hGRF
- human growth hormone-releasing factor
- mGH
- mouse growth hormone
- CTD
- C-terminal domain
- PolII
- polymerase II
- hGH
- human growth hormone.
REFERENCES
- 1. Bresnick E. H., Johnson K. D., Kim S. I., Im H. (2006) Prog. Nucleic Acids Res. Mol. Biol. 81, 435–471 [DOI] [PubMed] [Google Scholar]
- 2. Li Q., Peterson K. R., Fang X., Stamatoyannopoulos G. (2002) Locus control regions. Blood 100, 3077–3086 [DOI] [PMC free article] [PubMed] [Google Scholar]
- 3. Su Y., Liebhaber S. A., Cooke N. E. (2000) The human growth hormone gene cluster locus control region supports position-independent pituitary- and placenta-specific expression in the transgenic mouse. J. Biol. Chem. 275, 7902–7909 [DOI] [PubMed] [Google Scholar]
- 4. Peterson K. R., Clegg C. H., Huxley C., Josephson B. M., Haugen H. S., Furukawa T., Stamatoyannopoulos G. (1993) Transgenic mice containing a 248-kb yeast artificial chromosome carrying the human β-globin locus display proper developmental control of human globin genes. Proc. Natl. Acad. Sci. U.S.A. 90, 7593–7597 [DOI] [PMC free article] [PubMed] [Google Scholar]
- 5. Wang Y., Macke J. P., Merbs S. L., Zack D. J., Klaunberg B., Bennett J., Gearhart J., Nathans J. (1992) A locus control region adjacent to the human red and green visual pigment genes. Neuron 9, 429–440 [DOI] [PubMed] [Google Scholar]
- 6. Greaves D. R., Wilson F. D., Lang G., Kioussis D. (1989) Human CD2 3′-flanking sequences confer high-level, T cell-specific, position-independent gene expression in transgenic mice. Cell 56, 979–986 [DOI] [PubMed] [Google Scholar]
- 7. Curtin P., Pirastu M., Kan Y. W., Gobert-Jones J. A., Stephens A. D., Lehmann H. (1985) A distant gene deletion affects β-globin gene function in an atypical γδβ-thalassemia. J. Clin. Invest. 76, 1554–1558 [DOI] [PMC free article] [PubMed] [Google Scholar]
- 8. Driscoll M. C., Dobkin C. S., Alter B. P. (1989) γδβ-Thalassemia due to a de novo mutation deleting the 5′ β-globin gene activation region hypersensitive sites. Proc. Natl. Acad. Sci. U.S.A. 86, 7470–7474 [DOI] [PMC free article] [PubMed] [Google Scholar]
- 9. Forrester W. C., Epner E., Driscoll M. C., Enver T., Brice M., Papayannopoulou T., Groudine M. (1990) A deletion of the human β-globin locus activation region causes a major alteration in chromatin structure and replication across the entire β-globin locus. Genes Dev. 4, 1637–1649 [DOI] [PubMed] [Google Scholar]
- 10. Kioussis D., Vanin E., deLange T., Flavell R. A., Grosveld F. G. (1983) β-Globin gene inactivation by DNA translocation in γβ-thalassaemia. Nature 306, 662–666 [DOI] [PubMed] [Google Scholar]
- 11. Dean A. (2006) On a chromosome far, far away. LCRs and gene expression. Trends Genet. 22, 38–45 [DOI] [PubMed] [Google Scholar]
- 12. Fang X., Xiang P., Yin W., Stamatoyannopoulos G., Li Q. (2007) Cooperativeness of the higher chromatin structure of the β-globin locus revealed by the deletion mutations of DNase I hypersensitive site 3 of the LCR. J. Mol. Biol. 365, 31–37 [DOI] [PMC free article] [PubMed] [Google Scholar]
- 13. Fedosyuk H., Peterson K. R. (2007) Deletion of the human β-globin LCR 5′HS4 or 5′HS1 differentially affects β-like globin gene expression in β-YAC transgenic mice. Blood Cells Mol. Dis. 39, 44–55 [DOI] [PMC free article] [PubMed] [Google Scholar]
- 14. Jin Y., Oomah K., Cattini P. A. (2011) Enhancer-blocking activity is associated with hypersensitive site V sequences in the human growth hormone locus control region. DNA Cell Biol. 30, 995–1005 [DOI] [PubMed] [Google Scholar]
- 15. Papachatzopoulou A., Kaimakis P., Pourfarzad F., Menounos P. G., Evangelakou P., Kollia P., Grosveld F. G., Patrinos G. P. (2007) Increased γ-globin gene expression in β-thalassemia intermedia patients correlates with a mutation in 3′HS1. Am. J. Hematol. 82, 1005–1009 [DOI] [PubMed] [Google Scholar]
- 16. Yang X., Jin Y., Cattini P. A. (2010) Appearance of the pituitary factor Pit-1 increases chromatin remodeling at hypersensitive site III in the human GH locus. J. Mol. Endocrinol. 45, 19–32 [DOI] [PMC free article] [PubMed] [Google Scholar]
- 17. Jones B. K., Monks B. R., Liebhaber S. A., Cooke N. E. (1995) The human growth hormone gene is regulated by a multicomponent locus control region. Mol. Cell Biol. 15, 7010–7021 [DOI] [PMC free article] [PubMed] [Google Scholar]
- 18. Kimura A. P., Liebhaber S. A., Cooke N. E. (2004) Epigenetic modifications at the human growth hormone locus predict distinct roles for histone acetylation and methylation in placental gene activation. Mol. Endocrinol. 18, 1018–1032 [DOI] [PubMed] [Google Scholar]
- 19. Elefant F., Su Y., Liebhaber S. A., Cooke N. E. (2000) Patterns of histone acetylation suggest dual pathways for gene activation by a bifunctional locus control region. EMBO J. 19, 6814–6822 [DOI] [PMC free article] [PubMed] [Google Scholar]
- 20. Bennani-Baïti I. M., Cooke N. E., Liebhaber S. A. (1998) Physical linkage of the human growth hormone gene cluster and the CD79b (Igβ/B29) gene. Genomics 48, 258–264 [DOI] [PubMed] [Google Scholar]
- 21. Bennani-Baiti I. M., Jones B. K., Liebhaber S. A., Cooke N. E. (1995) Physical linkage of the human growth hormone gene cluster and the skeletal muscle sodium channel α-subunit gene (SCN4A) on chromosome 17. Genomics 29, 647–652 [DOI] [PubMed] [Google Scholar]
- 22. McClatchey A. I., Lin C. S., Wang J., Hoffman E. P., Rojas C., Gusella J. F. (1992) The genomic structure of the human skeletal muscle sodium channel gene. Hum. Mol. Genet. 1, 521–527 [DOI] [PubMed] [Google Scholar]
- 23. Campbell K. S., Hager E. J., Friedrich R. J., Cambier J. C. (1991) IgM antigen receptor complex contains phosphoprotein products of B29 and mb-1 genes. Proc. Natl. Acad. Sci. U.S.A. 88, 3982–3986 [DOI] [PMC free article] [PubMed] [Google Scholar]
- 24. Hermanson G. G., Eisenberg D., Kincade P. W., Wall R. (1988) B29, a member of the immunoglobulin gene superfamily exclusively expressed on β-lineage cells. Proc. Natl. Acad. Sci. U.S.A. 85, 6890–6894 [DOI] [PMC free article] [PubMed] [Google Scholar]
- 25. Cajiao I., Zhang A., Yoo E. J., Cooke N. E., Liebhaber S. A. (2004) Bystander gene activation by a locus control region. EMBO J. 23, 3854–3863 [DOI] [PMC free article] [PubMed] [Google Scholar]
- 26. Ho Y., Elefant F., Liebhaber S. A., Cooke N. E. (2006) Locus control region transcription plays an active role in long-range gene activation. Mol. Cell 23, 365–375 [DOI] [PubMed] [Google Scholar]
- 27. Ho Y., Tadevosyan A., Liebhaber S. A., Cooke N. E. (2008) The juxtaposition of a promoter with a locus control region transcriptional domain activates gene expression. EMBO Rep. 9, 891–898 [DOI] [PMC free article] [PubMed] [Google Scholar]
- 28. Shewchuk B. M., Asa S. L., Cooke N. E., Liebhaber S. A. (1999) Pit-1 binding sites at the somatotrope-specific DNase I hypersensitive sites I and II of the human growth hormone locus control region are essential for in vivo hGH-N gene activation. J. Biol. Chem. 274, 35725–35733 [DOI] [PubMed] [Google Scholar]
- 29. Nelson C., Albert V. R., Elsholtz H. P., Lu L. I., Rosenfeld M. G. (1988) Activation of cell-specific expression of rat growth hormone and prolactin genes by a common transcription factor. Science 239, 1400–1405 [DOI] [PubMed] [Google Scholar]
- 30. Ho Y., Liebhaber S. A., Cooke N. E. (2011) The role of the hGH locus control region in somatotrope restriction of hGH-N gene expression. Mol. Endocrinol. 25, 877–884 [DOI] [PMC free article] [PubMed] [Google Scholar]
- 31. Ho Y., Elefant F., Cooke N., Liebhaber S. (2002) A defined locus control region determinant links chromatin domain acetylation with long-range gene activation. Mol. Cell 9, 291–302 [DOI] [PubMed] [Google Scholar]
- 32. Yang X. W., Model P., Heintz N. (1997) Homologous recombination based modification in Escherichia coli and germline transmission in transgenic mice of a bacterial artificial chromosome. Nat. Biotechnol. 15, 859–865 [DOI] [PubMed] [Google Scholar]
- 33. Maloy S. R., Nunn W. D. (1981) Selection for loss of tetracycline resistance by Escherichia coli. J. Bacteriol. 145, 1110–1111 [DOI] [PMC free article] [PubMed] [Google Scholar]
- 34. Bochner B. R., Huang H. C., Schieven G. L., Ames B. N. (1980) Positive selection for loss of tetracycline resistance. J. Bacteriol. 143, 926–933 [DOI] [PMC free article] [PubMed] [Google Scholar]
- 35. Bennani-Baïti I. M., Asa S. L., Song D., Iratni R., Liebhaber S. A., Cooke N. E. (1998) DNase I-hypersensitive sites I and II of the human growth hormone locus control region are a major developmental activator of somatotrope gene expression. Proc. Natl. Acad. Sci. U.S.A. 95, 10655–10660 [DOI] [PMC free article] [PubMed] [Google Scholar]
- 36. Mayo K. E., Hammer R. E., Swanson L. W., Brinster R. L., Rosenfeld M. G., Evans R. M. (1988) Dramatic pituitary hyperplasia in transgenic mice expressing a human growth hormone-releasing factor gene. Mol. Endocrinol. 2, 606–612 [DOI] [PubMed] [Google Scholar]
- 37. Yoo E. J., Cajiao I., Kim J. S., Kimura A. P., Zhang A., Cooke N. E., Liebhaber S. A. (2006) Tissue-specific chromatin modifications at a multigene locus generate asymmetric transcriptional interactions. Mol. Cell Biol. 26, 5569–5579 [DOI] [PMC free article] [PubMed] [Google Scholar]
- 38. Bodner M., Karin M. (1987) A pituitary-specific trans-acting factor can stimulate transcription from the growth hormone promoter in extracts of nonexpressing cells. Cell 50, 267–275 [DOI] [PubMed] [Google Scholar]
- 39. Lefevre C., Imagawa M., Dana S., Grindlay J., Bodner M., Karin M. (1987) Tissue-specific expression of the human growth hormone gene is conferred in part by the binding of a specific trans-acting factor. EMBO J. 6, 971–981 [DOI] [PMC free article] [PubMed] [Google Scholar]
- 40. Komarnitsky P., Cho E. J., Buratowski S. (2000) Different phosphorylated forms of RNA polymerase II and associated mRNA processing factors during transcription. Genes Dev. 14, 2452–2460 [DOI] [PMC free article] [PubMed] [Google Scholar]
- 41. Chung J. H., Whiteley M., Felsenfeld G. (1993) A 5′ element of the chicken β-globin domain serves as an insulator in human erythroid cells and protects against position effect in Drosophila. Cell 74, 505–514 [DOI] [PubMed] [Google Scholar]
- 42. Hunsaker T. L., Jefferson H. S., Morrison J. K., Franklin A. J., Shewchuk B. M. (2012) POU1F1-mediated activation of hGH-N by deoxyribonuclease I hypersensitive site II of the human growth hormone locus control region. J. Mol. Biol. 415, 29–45 [DOI] [PubMed] [Google Scholar]
- 43. Ramanathan Y., Rajpara S. M., Reza S. M., Lees E., Shuman S., Mathews M. B., Pe'ery T. (2001) Three RNA polymerase II carboxyl-terminal domain kinases display distinct substrate preferences. J. Biol. Chem. 276, 10913–10920 [DOI] [PubMed] [Google Scholar]
- 44. Min I. M., Waterfall J. J., Core L. J., Munroe R. J., Schimenti J., Lis J. T. (2011) Regulating RNA polymerase pausing and transcription elongation in embryonic stem cells. Genes Dev. 25, 742–754 [DOI] [PMC free article] [PubMed] [Google Scholar]
- 45. Rahl P. B., Lin C. Y., Seila A. C., Flynn R. A., McCuine S., Burge C. B., Sharp P. A., Young R. A. (2010) c-Myc regulates transcriptional pause release. Cell 141, 432–445 [DOI] [PMC free article] [PubMed] [Google Scholar]
- 46. Bender M. A., Ragoczy T., Lee J., Byron R., Telling A., Dean A., Groudine M. (2012) The hypersensitive sites of the murine beta-globin locus control region act independently to affect nuclear localization and transcriptional elongation. Blood 119, 3820–3827 [DOI] [PMC free article] [PubMed] [Google Scholar]
- 47. Sawado T., Halow J., Bender M. A., Groudine M. (2003) The β-globin locus control region (LCR) functions primarily by enhancing the transition from transcription initiation to elongation. Genes Dev. 17, 1009–1018 [DOI] [PMC free article] [PubMed] [Google Scholar]