

Background: Laforin deficiency causes glycogen hyperphosphorylation, which converts glycogen to aggregate-prone poorly branched polyglucosans. Malin deficiency also causes polyglucosans.
Results: Malin deficiency increases total and glycogen-associated laforin, which renders glycogen aggregate-prone and poorly branched.
Conclusion: Malin deficiency causes polyglucosans through increased laforin.
Significance: Phosphate and laforin (and perhaps other proteins) must be cleared to enable normal glycogen construction and to prevent fatal polyglucosan disease.
Keywords: Animal Models, Carbohydrate Structure, Epilepsy, Glycogen, Glycogen Synthase, Mouse, Neurodegenerative Diseases, Neurological Diseases, Lafora Disease
Abstract
The solubility of glycogen, essential to its metabolism, is a property of its shape, a sphere generated through extensive branching during synthesis. Lafora disease (LD) is a severe teenage-onset neurodegenerative epilepsy and results from multiorgan accumulations, termed Lafora bodies (LB), of abnormally structured aggregation-prone and digestion-resistant glycogen. LD is caused by loss-of-function mutations in the EPM2A or EPM2B gene, encoding the interacting laforin phosphatase and malin E3 ubiquitin ligase enzymes, respectively. The substrate and function of malin are unknown; an early counterintuitive observation in cell culture experiments that it targets laforin to proteasomal degradation was not pursued until now. The substrate and function of laforin have recently been elucidated. Laforin dephosphorylates glycogen during synthesis, without which phosphate ions interfere with and distort glycogen construction, leading to LB. We hypothesized that laforin in excess or not removed following its action on glycogen also interferes with glycogen formation. We show in malin-deficient mice that the absence of malin results in massively increased laforin preceding the appearance of LB and that laforin gradually accumulates in glycogen, which corresponds to progressive LB generation. We show that increasing the amounts of laforin in cell culture causes LB formation and that this occurs only with glycogen binding-competent laforin. In summary, malin deficiency causes increased laforin, increased laforin binding to glycogen, and LB formation. Furthermore, increased levels of laforin, when it can bind glycogen, causes LB. We conclude that malin functions to regulate laforin and that malin deficiency at least in part causes LB and LD through increased laforin binding to glycogen.
Introduction
Glycogen is the largest macromolecule in mammalian cytosol. It is constructed by two enzymes, glycogen synthase (GS)4 and glycogen branching enzyme (BE). GS catalyzes the following reaction: glycogen + UDP-Glc → glycogen (n + 1) + UDP, which attaches successive glucose units, through α1–4 linkages, to a pre-existing glucose oligosaccharide bound to the glycogenin protein. When six glucose units are added, BE detaches them en bloc as a hexamer and reattaches the hexamer, through an α1–6 linkage, to one of the glucose units of the original oligosaccharide upstream of its terminus. This generates a fork with two prongs, each of which GS now extends, and BE branches, as described above. Repetitions of these concerted GS and BE actions lead to growth of the molecule radially into an extremely dense sphere composed of up to 55,000 glucose units (40 nm in diameter). This organization buries the glycogen strands, which are hydrophobic, within the sphere and exposes at the surface only the ends of chains, which are hydrophilic, thus allowing solubility (1).
Every 1/10,000 times an error occurs in the GS reaction. Instead of glucose, the enzyme transfers phosphoglucose from UDP-Glc to glycogen. The GS error reaction is as follows: glycogen + UDP-Glc → glycogen-phosphoglucose + UMP. The phosphate incorporated into glycogen with this reaction is deleterious, as described below, and is removed by the glycogen-binding phosphatase named laforin (2–5).
Glycogen synthesis is regulated through regulation of GS. GS activity is increased through dephosphorylation by the pleiotropic phosphatase PP1, which is targeted to glycogen and GS by one of several homologous proteins, including PTG (protein targeting to glycogen) (6). GS is down-regulated through phosphorylation by one or more of at least five pleiotropic kinases, including GSK3 (1).
BE deficiency results in GS outpacing the ability of BE to branch and in the generation of malformed glycogen molecules, called polyglucosans, with abnormally long strands. Polyglucosans are poorly soluble and precipitate, aggregate, resist digestion, and accumulate in many tissues (e.g. liver, muscle, heart, and brain); replace cell cytoplasm; and lead to type IV glycogenosis (Andersen disease) characterized by death in infancy from hepatic failure (7–10).
Laforin deficiency (due to mutations in the EPM2A gene) also leads to polyglucosan formation and Lafora disease (LD) (10–13). Pathologically, LD exhibits cellular inclusions called Lafora bodies (LB), which consist of aggregated masses of polyglucosans, more normal-looking spherical glycogen, and a very small amount of protein. Histochemically, LB are characterized by their large size (up to 20 μm; for reference, an average glycogen particle is 20 nm); strong staining with the carbohydrate-specific periodic acid-Schiff (PAS) stain; and, unlike normal soluble glycogen, resistance to digestion by amylase (11, 14–16). Large as they are, sizes attained by LB appear to be too small to cause symptoms in liver, muscle, and heart cells, but not in the narrow confines of neuronal dendrites in the brain. By the teenage years, replacement of the cytoplasm of numerous dendrites by LB results in onset and then inexorable worsening of epilepsy and neurodegeneration, leading to death by early adulthood (11, 14, 15, 17). Studies in mice show that glycogen from laforin-deficient tissues is hyperphosphorylated (∼1/375 glucoses phosphorylated versus 1/1500 in the wild type), poorly branched, and less soluble and tends to precipitate and aggregate, all of which are reversed by dephosphorylation with laforin (2, 3). These results led to the hypothesis that the primary mechanism of polyglucosan formation in laforin deficiency is phosphate accumulation in glycogen. In this hypothesis, the aggregated precipitated glycogen subsequently converts to polyglucosan through mechanisms to be identified (2, 3).
EPM2A mutations account for 50% of LD patients. The other 50% have mutations in a second gene, EPM2B, encoding an E3 ubiquitin ligase named malin (18), which interacts with laforin (19–22). Malin expressed in cell culture with laforin leads to proteasome-dependent decreases in PTG and GS proteins and GS activity, but not in two control proteins (22–25). This suggests that malin down-regulates PTG and GS and that malin deficiency up-regulates GS activity, which, by outpacing BE, would cause polyglucosans in the same way that occurs in BE deficiency. The requirement of laforin coexpression for these results suggests that laforin acts through malin and that laforin deficiency causes polyglucosans through loss of the degradative down-regulation of PTG and GS by malin (22–25), a very different theory than the increased glycogen phosphate hypothesis. Finally, malin and laforin coexpression also leads to decreased laforin, again in a proteasome-dependent manner (19, 20, 22) (this experiment went beyond those with PTG and GS to demonstrate actual polyubiquitination of laforin by malin (20)), suggesting a third hypothesis: that malin acts through laforin removal, and malin deficiency causes polyglucosans and LB through increased laforin, which is paradoxical for obvious reasons.
The two hypotheses of LD generation (increased GS activity and increased glycogen phosphate) have been tested in tissues from laforin-deficient (Epm2a−/−) and malin-deficient (Epm2b−/−) LD mouse models and led to crucial insights (2, 26–29). To avoid repetition, we review these under “Results” as lead-ins to our own experiments. Together with the prior advances, our results suggest a unifying hypothesis of laforin-malin function: laforin clears phosphates, and malin clears laforin and possibly other glycogen-acting proteins from glycogen particles under construction to allow unimpeded progression of the intricate geometric synthesis required to generate the massively dense yet soluble spheres of glycogen.
EXPERIMENTAL PROCEDURES
Histology
Animal experiments were approved by the Toronto Centre for Phenogenomics. Epm2a−/− and Epm2b−/− mice were described previously (17, 28, 30). Mice were killed by cervical dislocation, and tissues were quickly dissected and either frozen immediately in liquid nitrogen or fixed in 10% formalin. PAS staining following diastase (amylase) treatment (PASD) was as described previously (17, 28).
Immunogold labeling was performed on material from tissue fixed in 4% paraformaldehyde with 0.1% glutaraldehyde in 0.1 m phosphate buffer (pH 7.4). Samples were washed with phosphate buffer, stored in PBS containing 20 mm azide at 4 °C, infused with 2.3 m sucrose overnight, mounted on aluminum microtomy pins, and frozen in liquid N2. Ultrathin cryosections were prepared at −120 °C using a diamond knife and a cryo-ultramicrotome, transferred in a loop of molten sucrose to Formvar-coated grids, washed with PBS containing 0.15% glycine and 0.5% BSA followed by washes with PBS/BSA, incubated with anti-laforin monoclonal antibody (Abnova) for 1 h, rinsed with PBS/BSA, incubated with 8-nm gold-conjugated goat anti-mouse IgG for 1 h, rinsed with PBS followed by rinsing with distilled water, stabilized in a thin film of methylcellulose containing 0.2% uranyl acetate, dried, and examined in a JEOL JEM-1200EXII transmission electron microscope modified with a phase plate to enhance detail. Gold particle determinations were calculated on a minimum of 50 images per group from pictures taken at a nominal magnification of ×50,000. Particle density was calculated using the NIH ImageJ image analysis program.
Glycogen and Phosphate Measurements
Glycogen and glycogen phosphate quantification was performed as described previously (17, 28). Briefly, tissue was ground in liquid nitrogen using a mortar and pestle before boiling in 30% KOH and filtering to remove fat. Glycogen was then precipitated with ethanol and dissolved in H2O followed by additional purifications using methanol/chloroform and TCA/ethanol. After dialysis, glycogen was again precipitated with ethanol and pelleted. Glycogen was quantified after digestion with amyloglucosidase (Sigma) using a glucose assay kit (Sigma). Glycogen phosphate content was measured after hydrolysis using Malachite green.
Western Blotting
Lysates for all experiments were prepared from tissue ground in liquid nitrogen using homogenization buffer (31) and protease/phosphatase inhibitors (Roche Applied Science). For total protein levels, lysates were loaded directly onto SDS-polyacrylamide gels without centrifugation. For low speed fractionations, lysates were centrifuged at 10,000 × g to separate insoluble and soluble fractions and then loaded onto SDS-polyacrylamide gels. For high speed fractionations, lysates were ultracentrifuged at 200,000 × g for 45 min. Membranes were probed using anti-laforin (Abnova), anti-GAPDH (Santa Cruz Biotechnology), anti-β-actin (Abcam), or anti-GS (Cell Signaling) antibody. Secondary antibodies were from Santa Cruz Biotechnology.
Quantitative RT-PCR
RNA was extracted from brain using an RNeasy kit (Qiagen). RNA was treated with DNase I and converted to cDNA using random hexamer primers and a SuperScript first-strand synthesis kit (Invitrogen). For quantitative PCR (Stratagene Mx3005P), each 25-μl reaction contained 1 μl of cDNA, 40 ng each of forward and reverse primer, and 10 μl of SYBR Green (Bio-Rad). Laforin levels were normalized to levels of a control gene, hydroxymethylbilane synthase. All samples were run in triplicate.
GS Activity
GS activity assays were performed as described previously (28). Activity was measured in the presence (8 mm) and absence of the GS allosteric activator Glc-6-P, which fully activates the enzyme. The activity ratio, calculated as the activity without Glc-6-P divided by that with Glc-6-P, reflects the actually active fraction of total possible GS activity (1).
Laforin and Laforin Mutant Transfection Experiments
HEK293 cells (Invitrogen) were cultured overnight on coverslips in DMEM supplemented with 10% fetal bovine serum, 2 mm glutamine, and 2% ampicillin and transfected using Lipofectamine 2000 (Invitrogen) in Opti-MEM I (Invitrogen) for 24 h before fixation. Cells were fixed in cold methanol, permeabilized using 0.3% Triton X-100, incubated with primary antibody (rabbit anti-Myc (C3956, Sigma) and mouse anti-glycogen (kind gift from Dr. Otto Baba) (32)) and 2% BSA overnight at 4 °C, washed, and then incubated with secondary antibody (Invitrogen) and 2% BSA for 2–4 h at room temperature. Images were acquired using a Leica DM5000B microscope with Image-Pro MDA6.0 software and merged using Adobe Photoshop CS3. For PAS staining, permeabilized cells were oxidized with 0.5% PAS for 30 min at 37 °C followed by the Schiff reaction at room temperature for 10 min. For PASD staining, permeabilized cells were first treated with 0.2 units/ml amylase (diastase) for 15 min before PAS staining.
LB Isolation from Transfected Cell Lines
Cells transfected as described above were trypsinized; put on ice for 15 min in HEPES buffer containing 10 mm HEPES (pH 7.9), 10 mm KCl, 0.1 mm EDTA, and 0.1 mm EGTA; and then lysed with 0.55% Nonidet P-40 for 1 min on ice. The lysate was centrifuged at 1000 × g for 5 min to separate cytosolic and nuclear fractions. The latter was resuspended in HEPES and recentrifuged at 1000 × g. Its supernatant was combined with the cytosolic fraction followed by centrifugation at 8000 × g for 10 min to remove debris. The resultant supernatant was centrifuged again at 18,000 × g for 45 min at 4 °C, and pellets were suspended in H2O by heating at 85 °C for 10 min. This isolation enriched for poorly soluble forms of glycogen from LB-forming cells while still allowing adequate amounts of normal glycogen to be collected from non-LB-forming cells for determination of iodine spectra.
Determination of Iodine Spectra
The degree of polysaccharide branching in the above suspensions (or of glycogen purified from skeletal muscle) was analyzed according as described by Krisman (33). Briefly, 50 μl of an iodine/iodide solution containing 1.5 m KI and 100 mm I2 was added to 13 ml of saturated solution of CaCl2 and mixed. 100 μl of the suspension as prepared in the previous paragraph was added to 600 μl of the CaCl2/iodine/iodide solution and incubated at room temperature. After 7 min of incubation, the spectra of visible light absorbed at wavelengths from 400 to 700 nm were obtained and plotted, and the wavelengths at which maximal absorbance occurred were determined. The amylopectin control was from Sigma.
Statistical Analysis
All data are shown as means ± S.E. Significance was evaluated using Student's unpaired t test, and results were considered significant at p < 0.05 unless stated otherwise.
RESULTS
LB Generation in LD Is Not Due to Increased GS or GS Activity
As mentioned above, laforin and malin expressed together in cell culture selectively and drastically reduce PTG and GS protein quantities and GS activity in a proteasome-dependent manner, suggesting that polyglucosans in LD form as a result of increased GS protein and activity (22). When GS activity was measured in tissues of 9–12-month-old Epm2a−/− and Epm2b−/− animals, no increase was found. However, GS protein was vastly increased, and this increase segregated with a low speed (10,000 × g centrifugation) pellet (LSP), which contained the LB (2, 29). Similar measurements taken at 3 months, when LB were less than at 9–12 months, also showed increased GS in the LSP (26). These results were interpreted in two opposite ways. One was that increased GS activity does not underlie polyglucosan generation and that the increased GS protein in the LSP is GS trapped with precipitated glycogen and polyglucosans (2). The alternative view was that the cell culture results combined with the great increase in polyglucosan-associated GS in mouse tissues confirm the role of increased GS in polyglucosan formation (29). To resolve this controversy, we measured GS protein and activity in young 1 month-old Epm2b−/− mice, which do not have detectable LB (in these young mice, glycogen quantity and branching are also still normal) (Fig. 1). We found no increase in total or LSP GS and no increased GS activity (Fig. 2), supporting the view that increased GS and GS activity are not at the origin of LB generation in LD.
FIGURE 1.

Brain LB and glycogen quantity and quality in young and old malin-deficient (Epm2b−/−) mice. A–C, representative brain sections (hippocampal region) from Epm2b−/− mice stained with PASD. LB, examples of which are shown by arrows, were absent at 1 month (1M; A), present by 3 months (3M; B), and profuse by 12 months (12M; C) of age. D, equivalent section from an Epm2a−/− mouse at 12 months. Scale bars = 50 μm. E, total brain glycogen (including normal and abnormal (polyglucosan) glycogen) at 1 and 12 months in Epm2b−/− and Epm2a−/− mice (n = five to six animals per genotype). Data are reported in micromoles of glucose from glycogen/g of tissue. WT, wild-type; KO, knock-out. F, branching degree of glycogen from skeletal muscle in 1-month-old Epm2b−/− mice is the same as in wild-type mice (n = three animals per genotype). Iodine intercalates polysaccharide helical chains to generate characteristic spectra of visible light absorption, and the degree of branching is inversely proportional to the wavelength at which maximal amount of light is absorbed (33).
FIGURE 2.

GS quantity and activity in 1-month-old malin-deficient (Epm2b−/−) mice. A, GS quantity in total brain extract (n = three mice per genotype). B, GS quantity in the LSS (10,000 × g) and LSP of brain extracts (n = three mice per genotype). C, GS activity in skeletal muscle (activity ratio = GS activity in the absence of any added Glc-6-P (G6P) divided by that at 8 mm Glc-6-P; n = five mice per genotype). WT, wild-type; KO, knock-out.
Glycogen Hyperphosphorylation Contributes to LB Formation in Malin Deficiency
In Epm2a−/− mice, glycogen phosphate increases in time-dependent fashion. In muscle, for example, it increased by ∼4-fold compared with controls at 3 months and by 6-fold at 9–12 months (2). When glycogen phosphate was measured in Epm2b−/− mice, it was found to be elevated, but very modestly (1.3-fold). This measurement was performed in 6-month-old animals without simultaneous measurement in Epm2a−/− mice, leaving it uncertain whether the difference from the results reported in Epm2a−/− mice was methodological and whether the increase in Epm2b−/− mice was meaningful. In this study, we measured muscle glycogen phosphate in 12-month-old Epm2b−/− and Epm2a−/− mice simultaneously and found increases of 2.8-fold in the former and 4.2-fold in the latter (Fig. 3). These results confirm that glycogen is hyperphosphorylated in malin deficiency but, at the same time, that the increase is to a lesser degree than in laforin deficiency, suggesting that glycogen hyperphosphorylation contributes to LB generation in malin deficiency but is likely not its sole determinant.
FIGURE 3.
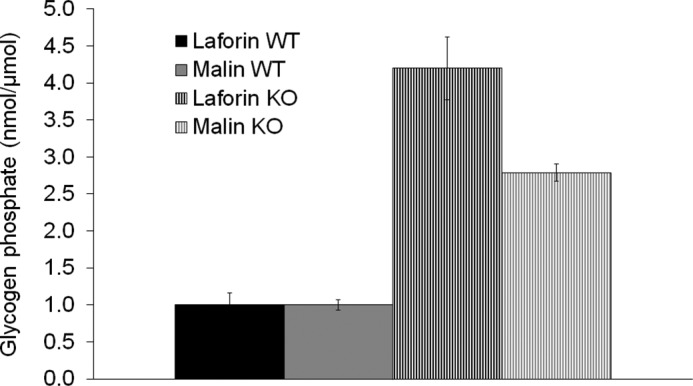
Glycogen phosphate in skeletal muscle (nanomoles of phosphate/μmol of glucose from glycogen). WT, wild-type; KO, knock-out.
Laforin Is Increased in Malin Deficiency and Is Progressively Confined to Glycogen
Laforin binds glycogen through a well characterized CBM20 type of carbohydrate-binding module (4, 34, 35). Laforin has been quantified in malin-deficient mice at 3 and 6 months and shown to be increased at both ages (26, 28). In both cases, the increase was in the LSP, raising the same question as with GS, namely whether the increase is primary or merely due to binding to and accumulation with the polyglucosan masses. We performed Western blotting on brain extracts at 1, 3, and 12 months of age. Total laforin in the Epm2b−/− mice was increased at 3 and 12 months (Fig. 4A). All of the increase was in the LSP (10,000 × g) containing the LB, and the amount of laforin in the low speed supernatant (LSS) was normal (Fig. 4B). Total laforin in Epm2b−/− mice was also increased at 1 month (Fig. 4A), when there were no LB and when glycogen was still normal in both quantity and quality (degree of branching) (Fig. 1). In this case, all of the increase was in the LSS, with no increase in the LSP (Fig. 4B), indicating that malin deficiency causes increased laforin quantity and that this increase occurs early and is not due to any accumulation in LB. Quantitative immunogold electron microscopy confirmed this result, showing a >2-fold increase in situ (Fig. 4C). We also measured the quantity of brain Epm2a mRNA and found it to be normal (Fig. 4D), indicating that the increased laforin is not transcriptional. Collectively, these results, with the prior cell culture experiments (20), indicate that malin regulates the quantity of laforin through proteasomal degradation.
FIGURE 4.

Laforin in brain tissue of malin-deficient (Epm2b−/−) mice. A, total laforin levels. B, laforin levels in the LSS (10,000 × g) and LSP. C, left and middle panels, laforin immunogold electron microscopy. Note the increase in laforin levels (gold particles (black dots)) in knock-out (KO) mice. The asterisks indicate post-synaptic density. Right panel, gold particle density quantification. D, Epm2a quantitative RT-PCR in Epm2b−/− brain. Quantity is relative to levels of the control gene hydroxymethylbilane synthase. E, laforin levels in high speed (200,000 × g) supernatants (HSS) and high speed glycogen-containing pellets (HSP).
Phosphates enter glycogen as errors during glycogen synthesis and are thought to interfere by their high charges with the proper packing of glycogen branches around them and thus expose these strands' hydrophobic surfaces, leading glycogen to precipitate (2, 3). We reasoned that if phosphate ions entering during synthesis can destabilize glycogen packing, so should proteins, if they do not detach or are not removed. Because the action of malin on laforin is to reduce laforin, and the action of laforin on glycogen is to enter glycogen during synthesis, we hypothesized that the function of malin might be to control the amount of laforin entering glycogen or the removal of laforin that has entered and acted on glycogen.
Soluble glycogen fractionates for the most part with the LSS (10,000 × g) (2), as does the increased laforin in young 1-month-old Epm2b−/− mice (Fig. 4B). The great majority of soluble glycogen precipitates at 200,000 × g (high speed pellet) (31). Applying this force to the 1-month-old mice, we found that the excess laforin in Epm2b−/− mice distributed between the high speed supernatant, i.e. unbound to glycogen, and the high speed pellet, i.e. with glycogen (Fig. 4E). The quantity of glycogen in these mice was no different from that in controls (Fig. 1E). These results indicate that the amount of free laforin is increased in early malin deficiency, as is the amount of laforin precipitating with glycogen. When the 200,000 × g fractionation was performed at later ages, laforin in Epm2b−/− mice (but not in controls) increasingly and then nearly totally precipitated with glycogen (Fig. 4E). Taken together, the 10,000 × g and 200,000 × g fractionation results indicate that malin deficiency leads to increased laforin (Fig. 4B, 1 MONTH), which increasingly associates with glycogen (Fig. 4E, 1, 3, and 12 MONTHS), which progressively converts to insoluble forms that pellet at 10,000 × g (Fig. 4B, 3 and 12 MONTHS).
Increased Laforin in Cell Culture Results in LB-like Structures
To test the hypothesis that excess laforin drives LB formation, we overexpressed laforin or three well characterized laforin mutants in HEK293 cells. The mutants were C265S (murine sequence), a phosphatase domain mutation that eliminates the catalytic cysteine and phosphatase activity but does not affect the binding of the protein to glycogen, and W32G and F83L, carbohydrate-binding domain mutations that prevent laforin binding to glycogen (4, 27, 36–38). Cells transfected with wild-type or C265S mutant laforin developed large 0.2–2-μm aggregates, which stained intensely with a glycogen-specific antibody and with PAS and which resisted digestion with amylase. These aggregates did not occur with overexpression of the laforin mutants that could not bind glycogen (Figs. 5 and 6 and supplemental Fig. 1).
FIGURE 5.

Glycogen binding-competent laforin overexpression results in formation of LB-like structures. First row, empty Myc vector; second and third rows, glycogen binding-competent Myc-tagged wild-type and C265S mutant laforin; fourth and fifth rows, Myc-tagged W32G and F83L mutant laforin, which did not bind glycogen. Green, Myc immunostaining; red, glycogen; blue, DAPI. Scale bars = 10 μm. See also supplemental Fig. 1 for a lower magnification showing a wider field of cells.
FIGURE 6.

LB-like aggregates resulting from laforin overexpression resist amylase digestion. See the legend to Fig. 5 for description of rows. Left panels, staining with PAS; right panels, staining with PASD. Scale bars = 10 μm.
Digestion-resistant Aggregating Glycogen Resulting from Increased Laforin Is Structurally Abnormal
How glycogen hyperphosphorylation in laforin deficiency contributes to poor solubility and aggregation is unknown but, as mentioned, is hypothesized to induce a disturbance of the proper packing of the glycogen helical chains, exposing them and rendering the whole molecule insoluble (2). Likewise, how laforin accumulation in glycogen in malin deficiency results in glycogen insolubility and aggregation is unknown but may involve a similar mechanism. In laforin deficiency, the hyperphosphorylated aggregate-prone glycogen becomes increasingly less branched over time. By 9–12 months in mice, it has a branching degree close to that of the plant polysaccharide amylopectin, as determined by absorption spectra of visible light in the presence of iodine (2). Low branching is considered the principal reason for insolubility in amylopectin, again due to exposure of long stretches of helical chains to aqueous cytosol (39).
To determine whether the abnormal digestion-resistant aggregating glycogen masses generated by overexpression of glycogen-binding laforin (wild-type and C265S mutant) are structurally abnormal, we isolated them and determined their spectra of visible light absorption in the presence of iodine. The wavelengths at which they absorbed maximal light were high, close to that of amylopectin, indicating abnormal branching, whereas the wavelength maxima for glycogen from cells transfected with non-glycogen-binding laforin (W32G and F83L) were low, similar to that of glycogen from cells transfected with empty vector (Fig. 7, A and B). In these short-term experiments, the total quantities of glycogen were not increased to a significant degree in the cells with the qualitatively abnormal glycogen, although there was a trend toward an increase in glycogen in the aggregate-containing cells (Fig. 7C). Although the lack of significance of the increase in glycogen content as measured biochemically might contrast with the accumulations of glycogen as detected by immunofluorescence in the cells with the abnormal glycogen, this could be due to several reasons. It is possible that the aggregates of abnormal glycogen co-aggregate substantial amounts of the cell's normal glycogen. In addition, it must be recalled that only a fraction of the cells are actually transfected in these experiments, the other cells having normal amounts of glycogen. Finally, it is possible that the anti-glycogen antibody has stronger immunocytochemical affinity toward abnormal versus normal glycogen.
FIGURE 7.

Glycogen is poorly branched in LB-like aggregates. A, iodine spectra of glycogen preparations enriched for the insoluble glycogen aggregates from cells transfected as described for Figs. 5 and 6. Note that the wavelengths of maximal visible light absorption by glycogen in cells overexpressing glycogen-binding laforin (red curves) are shifted close to that of amylopectin (AP; green curve), whereas those of non-glycogen-binding laforin (black curves) are close to that of glycogen from cells transfected with empty vector (blue curve). B, same experiment as in A repeated three times (three separate transfections per clone). The average wavelength at maximal absorption is shown for each clone. C, glycogen quantities in the cells from B.
DISCUSSION
Described 101 years ago (15), LD is the most common teenage-onset progressive myoclonus epilepsy and is fatal (11) and is caused in large part by widespread progressive accumulation of polyglucosan masses (11, 17). A major breakthrough in understanding the function of laforin came with the demonstration that it is a glycogen phosphatase (5, 27), to date unique in the animal kingdom, and that its deficiency leads to polyglucosan formation via glycogen hyperphosphorylation (2). We have now shown that glycogen is hyperphosphorylated also in Epm2b−/− mice and that malin deficiency therefore also leads to polyglucosan generation via glycogen hyperphosphorylation. However, equally importantly, phosphorylation is substantially lower in malin than in laforin deficiency, and therefore, polyglucosan formation in the former likely includes additional mechanisms.
The polyubiquitination and degradation of laforin by malin in cell culture experiments were observed soon after its discovery (20), at a time when glycogen phosphate was considered inconsequential, glycogen (and starch) phosphatases were unknown, and the laforin substrate was thought to be an unknown protein. That the function of malin would be laforin removal was inconsistent with laforin deficiency being causative of LD. Nonetheless, the authors who performed the malin cell culture experiment predicted that “laforin's CBD [carbohydrate-binding domain] would function to localize laforin [on glycogen] and allow laforin to dephosphorylate substrate X; after dephosphorylation, the next event … would not occur until laforin is polyubiquitinated and degraded” (20). In light of the subsequent uncovering that substrate X is glycogen itself (5, 27), we reasoned here that the function of malin would be to remove laforin after it docked glycogen to remove phosphate and before glycogen construction proceeded to entrap it. In this work, we found that laforin is increased in the earliest phases of malin deficiency both in the free state and in the glycogen pellet. As time passes, laforin is increasingly and then almost exclusively associated with glycogen, which correlates with the conversion of glycogen pools into abnormal digestion-resistant aggregates (LB). While this paper was in review, Criado et al. (40) also reported increased laforin in young Epm2b−/− mice (16 days old) and subsequent confinement to the insoluble pellet in 3-month-old mice exhibiting abundant LB.
To directly test the role of increased laforin in LB formation, we raised the amount of laforin in cell culture, which led to formation of abnormally aggregated digestion-resistant glycogen masses. This occurred only if laforin could bind glycogen, underscoring the role of excessive laforin binding to glycogen in LB generation.
In addition to being hyperphosphorylated, poorly soluble, aggregate-prone, and digestion-resistant glycogen in LD is also poorly structured, namely inadequately branched, which is a main contributor to its insolubility and aggregation. Here, we have shown that increased laforin provokes also this change in glycogen and thus that the abnormal glycogen aggregates generated by increased laforin are bona fide LB.
The model (Fig. 8) that emerges from our and previous results is as follows. The function of laforin is to intervene when phosphate is incorporated during glycogen synthesis and to remove the phosphate. The function of malin is 1) to prevent indiscriminate binding of laforin to glycogen by controlling its cytosolic amounts and 2) to remove laforin from glycogen as soon as laforin has removed its target phosphate. In the absence of malin, excessive amounts of laforin bind glycogen and, like excess phosphate, render glycogen precipitation- and aggregation-prone, digestion-resistant, and poorly branched, leading to LB formation. Additionally, accumulation of laforin in glycogen and then in LB depletes the cytosol of free laforin, leading to a secondary laforin deficiency (Fig. 4C) that exacerbates the malin deficiency. This last concept was suggested previously (26) and has now been confirmed.
FIGURE 8.

Model of LB pathogenesis. In normal glycogen metabolism, a recurring GS enzymatic error incorporates phosphate into glycogen. Laforin (laf) removes this phosphate and then is itself removed by malin (mal)-mediated degradation. In laforin deficiency, phosphate cannot be removed and accumulates. In malin deficiency, laforin binds glycogen to remove the phosphate but then cannot be removed, itself accumulating in glycogen. In laforin or malin deficiency, non-removal of phosphate or laforin disrupts the intricate spherical structure of glycogen, leading it to precipitate and accumulate in LB. Ub, ubiquitin.
Exactly how the structure of glycogen is altered toward lessened branching (polyglucosan formation) remains unknown. One explanation could come from the observation that GS is present on precipitating glycogen in LD mice (Refs. 2, 27, and 29 and this study), whereas BE is not (at least as tested in laforin-deficient LD mice) (2, 27). Possibly, GS remains active to a certain degree on precipitating glycogen, leading to chain extensions without branching. Whatever the mechanism of the lost normal branching, in the present situation, i.e. in tissue culture under laforin excess, it was a rapid (within 24 h) and early event in LB formation.
As mentioned above, laforin and malin coexpression in cell culture leads to proteasome-dependent reduction of PTG and GS, but not hexokinase or GSK3 (22). PTG and GS both bind glycogen directly, whereas hexokinase and GSK3 do not. It is tempting to consider the possibility that the role of the laforin-malin complex extends beyond phosphate and laforin elimination from glycogen. The complex might function to remove any proteins, including PTG and GS, that might be entrapped by glycogen during synthesis and that would disturb the intricate geometric construction required to generate soluble spheres of glycogen.
Supplementary Material
This work was supported, in whole or in part, by National Institutes of Health Grant 1R21NS062391 (to Y. L.). This work was also supported by Canadian Institutes of Health Research Grant MOP14667 (to B. A. M.).

This article contains supplemental Fig. 1.
- GS
- glycogen synthase
- BE
- branching enzyme
- LD
- Lafora disease
- LB
- Lafora bodies/body
- PAS
- periodic acid-Schiff
- PASD
- PAS staining following diastase (amylase) treatment
- LSP
- low speed pellet
- LSS
- low speed supernatant.
REFERENCES
- 1. Roach P. J. (2002) Glycogen and its metabolism. Curr. Mol. Med. 2, 101–120 [DOI] [PubMed] [Google Scholar]
- 2. Tagliabracci V. S., Girard J. M., Segvich D., Meyer C., Turnbull J., Zhao X., Minassian B. A., Depaoli-Roach A. A., Roach P. J. (2008) Abnormal metabolism of glycogen phosphate as a cause for Lafora disease. J. Biol. Chem. 283, 33816–33825 [DOI] [PMC free article] [PubMed] [Google Scholar]
- 3. Tagliabracci V. S., Heiss C., Karthik C., Contreras C. J., Glushka J., Ishihara M., Azadi P., Hurley T. D., DePaoli-Roach A. A., Roach P. J. (2011) Phosphate incorporation during glycogen synthesis and Lafora disease. Cell Metab. 13, 274–282 [DOI] [PMC free article] [PubMed] [Google Scholar]
- 4. Wang J., Stuckey J. A., Wishart M. J., Dixon J. E. (2002) A unique carbohydrate-binding domain targets the Lafora disease phosphatase to glycogen. J. Biol. Chem. 277, 2377–2380 [DOI] [PubMed] [Google Scholar]
- 5. Worby C. A., Gentry M. S., Dixon J. E. (2006) Laforin, a dual specificity phosphatase that dephosphorylates complex carbohydrates. J. Biol. Chem. 281, 30412–30418 [DOI] [PMC free article] [PubMed] [Google Scholar]
- 6. Ceulemans H., Bollen M. (2004) Functional diversity of protein phosphatase-1, a cellular economizer and reset button. Physiol. Rev. 84, 1–39 [DOI] [PubMed] [Google Scholar]
- 7. Andersen D. H. (1956) Familial cirrhosis of the liver with storage of abnormal glycogen. Lab. Invest. 5, 11–20 [PubMed] [Google Scholar]
- 8. Bao Y., Kishnani P., Wu J. Y., Chen Y. T. (1996) Hepatic and neuromuscular forms of glycogen storage disease type IV caused by mutations in the same glycogen branching enzyme gene. J. Clin. Invest. 97, 941–948 [DOI] [PMC free article] [PubMed] [Google Scholar]
- 9. Brown B. I., Brown D. H. (1966) Lack of an α-1,4-glucan:α-1,4-glucan 6-glycosyltransferase in a case of type IV glycogenosis. Proc. Natl. Acad. Sci. U.S.A. 56, 725–729 [DOI] [PMC free article] [PubMed] [Google Scholar]
- 10. Schochet S. S., Jr., McCormick W. F., Zellweger H. (1970) Type IV glycogenosis (amylopectinosis). Light and electron microscopic observations. Arch. Pathol. 90, 354–363 [PubMed] [Google Scholar]
- 11. Minassian B. A. (2001) Lafora disease: towards a clinical, pathologic, and molecular synthesis. Pediatr. Neurol. 25, 21–29 [DOI] [PubMed] [Google Scholar]
- 12. Minassian B. A., Lee J. R., Herbrick J. A., Huizenga J., Soder S., Mungall A. J., Dunham I., Gardner R., Fong C. Y., Carpenter S., Jardim L., Satishchandra P., Andermann E., Snead O. C., 3rd, Lopes-Cendes I., Tsui L. C., Delgado-Escueta A. V., Rouleau G. A., Scherer S. W. (1998) Mutations in a gene encoding a novel protein-tyrosine phosphatase cause progressive myoclonus epilepsy. Nat. Genet. 20, 171–174 [DOI] [PubMed] [Google Scholar]
- 13. Robitaille Y., Carpenter S., Karpati G., DiMauro S. D. (1980) A distinct form of adult polyglucosan body disease with massive involvement of central and peripheral neuronal processes and astrocytes: a report of four cases and a review of the occurrence of polyglucosan bodies in other conditions such as Lafora disease and normal ageing. Brain 103, 315–336 [DOI] [PubMed] [Google Scholar]
- 14. Cavanagh J. B. (1999) Corpora-amylacea and the family of polyglucosan diseases. Brain Res. Brain Res. Rev. 29, 265–295 [DOI] [PubMed] [Google Scholar]
- 15. Lafora G. R., Glueck B. (1911) Beitrag zur Histopathologie der myoklonischen Epilepsie. Z. Gesamte Neurol. Psy. 6, 1–14 [Google Scholar]
- 16. Van Heycop Ten Ham M. (1975) Lafora Disease, a Form of Progressive Myoclonus Epilepsy, Elsevier, Amsterdam [Google Scholar]
- 17. Turnbull J., DePaoli-Roach A. A., Zhao X., Cortez M. A., Pencea N., Tiberia E., Piliguian M., Roach P. J., Wang P., Ackerley C. A., Minassian B. A. (2011) PTG depletion removes Lafora bodies and rescues the fatal epilepsy of Lafora disease. PLoS Genet. 7, e1002037. [DOI] [PMC free article] [PubMed] [Google Scholar]
- 18. Chan E. M., Young E. J., Ianzano L., Munteanu I., Zhao X., Christopoulos C. C., Avanzini G., Elia M., Ackerley C. A., Jovic N. J., Bohlega S., Andermann E., Rouleau G. A., Delgado-Escueta A. V., Minassian B. A., Scherer S. W. (2003) Mutations in NHLRC1 cause progressive myoclonus epilepsy. Nat. Genet. 35, 125–127 [DOI] [PubMed] [Google Scholar]
- 19. Dubey D., Ganesh S. (2008) Modulation of functional properties of laforin phosphatase by alternative splicing reveals a novel mechanism for the EPM2A gene in Lafora progressive myoclonus epilepsy. Hum. Mol. Genet. 17, 3010–3020 [DOI] [PubMed] [Google Scholar]
- 20. Gentry M. S., Worby C. A., Dixon J. E. (2005) Insights into Lafora disease: malin is an E3 ubiquitin ligase that ubiquitinates and promotes the degradation of laforin. Proc. Natl. Acad. Sci. U.S.A. 102, 8501–8506 [DOI] [PMC free article] [PubMed] [Google Scholar]
- 21. Lohi H., Ianzano L., Zhao X. C., Chan E. M., Turnbull J., Scherer S. W., Ackerley C. A., Minassian B. A. (2005) Novel glycogen synthase kinase-3 and ubiquitination pathways in progressive myoclonus epilepsy. Hum. Mol. Genet. 14, 2727–2736 [DOI] [PubMed] [Google Scholar]
- 22. Vilchez D., Ros S., Cifuentes D., Pujadas L., Vallès J., García-Fojeda B., Criado-García O., Fernández-Sánchez E., Medraño-Fernández I., Domínguez J., García-Rocha M., Soriano E., Rodríguez de Córdoba S., Guinovart J. J. (2007) Mechanism suppressing glycogen synthesis in neurons and its demise in progressive myoclonus epilepsy. Nat. Neurosci. 10, 1407–1413 [DOI] [PubMed] [Google Scholar]
- 23. Couarch P., Vernia S., Gourfinkel-An I., Lesca G., Gataullina S., Fedirko E., Trouillard O., Depienne C., Dulac O., Steschenko D., Leguern E., Sanz P., Baulac S. (2011) Lafora progressive myoclonus epilepsy: NHLRC1 mutations affect glycogen metabolism. J. Mol. Med. 89, 915–925 [DOI] [PMC free article] [PubMed] [Google Scholar]
- 24. Vernia S., Solaz-Fuster M. C., Gimeno-Alcañiz J. V., Rubio T., García-Haro L., Foretz M., de Córdoba S. R., Sanz P. (2009) AMP-activated protein kinase phosphorylates R5/PTG, the glycogen targeting subunit of the R5/PTG-protein phosphatase-1 holoenzyme, and accelerates its down-regulation by the laforin-malin complex. J. Biol. Chem. 284, 8247–8255 [DOI] [PMC free article] [PubMed] [Google Scholar]
- 25. Worby C. A., Gentry M. S., Dixon J. E. (2008) Malin decreases glycogen accumulation by promoting the degradation of protein targeting to glycogen (PTG). J. Biol. Chem. 283, 4069–4076 [DOI] [PMC free article] [PubMed] [Google Scholar]
- 26. DePaoli-Roach A. A., Tagliabracci V. S., Segvich D. M., Meyer C. M., Irimia J. M., Roach P. J. (2010) Genetic depletion of the malin E3 ubiquitin ligase in mice leads to Lafora bodies and the accumulation of insoluble laforin. J. Biol. Chem. 285, 25372–25381 [DOI] [PMC free article] [PubMed] [Google Scholar]
- 27. Tagliabracci V. S., Turnbull J., Wang W., Girard J. M., Zhao X., Skurat A. V., Delgado-Escueta A. V., Minassian B. A., Depaoli-Roach A. A., Roach P. J. (2007) Laforin is a glycogen phosphatase, deficiency of which leads to elevated phosphorylation of glycogen in vivo. Proc. Natl. Acad. Sci. U.S.A. 104, 19262–19266 [DOI] [PMC free article] [PubMed] [Google Scholar]
- 28. Turnbull J., Wang P., Girard J. M., Ruggieri A., Wang T. J., Draginov A. G., Kameka A. P., Pencea N., Zhao X., Ackerley C. A., Minassian B. A. (2010) Glycogen hyperphosphorylation underlies Lafora body formation. Ann. Neurol. 68, 925–933 [DOI] [PubMed] [Google Scholar]
- 29. Valles-Ortega J., Duran J., Garcia-Rocha M., Bosch C., Saez I., Pujadas L., Serafin A., Cañas X., Soriano E., Delgado-García J. M., Gruart A., Guinovart J. J. (2011) Neurodegeneration and functional impairments associated with glycogen synthase accumulation in a mouse model of Lafora disease. EMBO Mol. Med. 3, 667–681 [DOI] [PMC free article] [PubMed] [Google Scholar]
- 30. Ganesh S., Delgado-Escueta A. V., Sakamoto T., Avila M. R., Machado-Salas J., Hoshii Y., Akagi T., Gomi H., Suzuki T., Amano K., Agarwala K. L., Hasegawa Y., Bai D. S., Ishihara T., Hashikawa T., Itohara S., Cornford E. M., Niki H., Yamakawa K. (2002) Targeted disruption of the Epm2a gene causes formation of Lafora inclusion bodies, neurodegeneration, ataxia, myoclonus epilepsy, and impaired behavioral response in mice. Hum. Mol. Genet. 11, 1251–1262 [DOI] [PubMed] [Google Scholar]
- 31. Nielsen J. N., Derave W., Kristiansen S., Ralston E., Ploug T., Richter E. A. (2001) Glycogen synthase localization and activity in rat skeletal muscle is strongly dependent on glycogen content. J. Physiol. 531, 757–769 [DOI] [PMC free article] [PubMed] [Google Scholar]
- 32. Baba O. (1993) Production of monoclonal antibody that recognizes glycogen and its application for immunohistochemistry. Kokubyo Gakkai Zasshi 60, 264–287 [DOI] [PubMed] [Google Scholar]
- 33. Krisman C. R. (1962) A method for the colorimetric estimation of glycogen with iodine. Anal. Biochem. 4, 17–23 [DOI] [PubMed] [Google Scholar]
- 34. Girard J. M., Lê K. H., Lederer F. (2006) Molecular characterization of laforin, a dual specificity protein phosphatase implicated in Lafora disease. Biochimie 88, 1961–1971 [DOI] [PubMed] [Google Scholar]
- 35. Wang W., Parker G. E., Skurat A. V., Raben N., DePaoli-Roach A. A., Roach P. J. (2006) Relationship between glycogen accumulation and the laforin dual specificity phosphatase. Biochem. Biophys. Res. Commun. 350, 588–592 [DOI] [PMC free article] [PubMed] [Google Scholar]
- 36. Fernández-Sánchez M. E., Criado-García O., Heath K. E., García-Fojeda B., Medraño-Fernández I., Gomez-Garre P., Sanz P., Serratosa J. M., Rodríguez de Córdoba S. (2003) Laforin, the dual phosphatase responsible for Lafora disease, interacts with R5 (PTG), a regulatory subunit of protein phosphatase-1 that enhances glycogen accumulation. Hum. Mol. Genet. 12, 3161–3171 [DOI] [PubMed] [Google Scholar]
- 37. Ganesh S., Tsurutani N., Suzuki T., Hoshii Y., Ishihara T., Delgado-Escueta A. V., Yamakawa K. (2004) The carbohydrate-binding domain of Lafora disease protein targets Lafora polyglucosan bodies. Biochem. Biophys. Res. Commun. 313, 1101–1109 [DOI] [PubMed] [Google Scholar]
- 38. Wang W., Roach P. J. (2004) Glycogen and related polysaccharides inhibit the laforin dual specificity protein phosphatase. Biochem. Biophys. Res. Commun. 325, 726–730 [DOI] [PubMed] [Google Scholar]
- 39. Pérez S., Bertoft E. (2010) The molecular structures of starch components and their contribution to the architecture of starch granules: a comprehensive review. Starch-Stärke 62, 389–420 [Google Scholar]
- 40. Criado O., Aguado C., Gayarre J., Duran-Trio L., Garcia-Cabrero A. M., Vernia S., San Millán B., Heredia M., Romá-Mateo C., Mouron S., Juana-López L., Domínguez M., Navarro C., Serratosa J. M., Sanchez M., Sanz P., Bovolenta P., Knecht E., Rodriguez de Cordoba S. (2012) Lafora bodies and neurological defects in malin-deficient mice correlate with impaired autophagy. Hum. Mol. Genet. 21, 1521–1533 [DOI] [PubMed] [Google Scholar]
Associated Data
This section collects any data citations, data availability statements, or supplementary materials included in this article.