

Background: The di-heme cytochrome FoxE is predicted to be the iron oxidoreductase of the photoferrotroph Rhodobacter ferrooxidans SW2.
Results: The thermodynamic and kinetic aspects of iron oxidation by FoxE are described.
Conclusion: FoxE is thermodynamically and kinetically able to oxidize iron in a pH-dependent manner.
Significance: This is the first functional characterization of a putative iron oxidoreductase involved in anoxygenic photosynthesis.
Keywords: Cytochromes, Electron Transfer, Enzyme Kinetics, Metalloproteins, Photosynthesis, Rhodobacter, Photoferrotrophy
Abstract
Photoferrotrophy is presumed to be an ancient type of photosynthetic metabolism in which bacteria use the reducing power of ferrous iron to drive carbon fixation. In this work the putative iron oxidoreductase of the photoferrotroph Rhodobacter ferrooxidans SW2 was cloned, purified, and characterized for the first time. This protein, FoxE, was characterized using spectroscopic, thermodynamic, and kinetic techniques. It is a c-type cytochrome that forms a trimer or tetramer in solution; the two hemes of each monomer are hexacoordinated by histidine and methionine. The hemes have positive reduction potentials that allow downhill electron transfer from many geochemically relevant ferrous iron forms to the photosynthetic reaction center. The reduction potentials of the hemes are different and are cross-assigned to fast and slow kinetic phases of ferrous iron oxidation in vitro. Lower reactivity was observed at high pH and may contribute to prevent ferric iron precipitation inside or at the surface of the cell. These results help fill in the molecular details of a metabolic process that likely contributed to the deposition of precambrian banded iron formations, globally important sedimentary rocks that are found on every continent today.
Introduction
The emergence of life on Earth left recognizable signatures in the geological record, with possible evidence for autotrophic carbon fixation appearing as early as 3.8 gray (1). The photosynthetic machinery of modern purple bacteria is thought to be similar to that of some of the earliest photosynthetic organisms (2), and some purple bacteria are capable of performing anoxygenic photosynthesis using ferrous iron[Fe(II)] as an electron source (3). Ferrous iron was widespread in the oceans at least until the mid-Proterozoic (4), and its phototrophic utilization (i.e. “photoferrotrophy”) is characterized by reaction 4Fe2+ + CO2 + 11H2O + hν ⇌ [CH2O] + 4Fe(OH)3 + 8H+ (3). One important consequence of this reaction is that at neutral pH, ferric iron (Fe(III)) is insoluble, and thus the iron product of this metabolism is a mineral. At early stages in Earth history (before the advent of oxygenic photosynthesis) photoferrotrophy likely catalyzed the deposition of banded iron formations, ancient stratified geological structures that constitute the largest iron deposits in the world (5). Contemporary bacteria still capable of performing this metabolism were originally isolated from fresh water sediments in Germany (6). One of these organisms was strain SW2, a neutrophilic Gram-negative bacterium, today called Rhodobacter ferrooxidans SW2.
Despite the importance of photoferrotrophy for understanding the co-evolution of life and Earth, little is known about its molecular mechanisms. SW2 has been a subject of studies aiming to understand biologically induced mineralization because ferric (hydr)oxides precipitate away from the cell and no mineral is found inside the cells or encrusting the cell surface (7–9). It is also known that SW2 utilizes only soluble Fe(II) compounds as the electron source for photoferrotrophy and does not actively dissolve Fe(II) minerals (9), suggesting that iron oxidation does not occur at the cell surface. Recently, the operon foxEYZ from R. ferrooxidans SW2 was found to stimulate light-dependent Fe(II) oxidation by the bacterium Rhodobacter capsulatus SB1003 (10). This operon is composed of three genes: foxE, which encodes a 29-kDa protein containing two canonical heme c binding sites; foxY, which encodes a predicted pyrroloquinoline quinone-binding protein; foxZ, which encodes a predicted inner membrane transport protein. FoxE was predicted to be the iron oxidoreductase and to perform the main step in photoferrotrophy because its expression alone is enough to significantly enhance light-dependent Fe(II) oxidation activity on SB1003 (10). This c-type cytochrome has no significant sequence homology with other predicted proteins in the genomic databases, which suggests a novel protein fold and cofactor organization. It also has no predicted transmembrane domains or lipoprotein attachment sites typical of outer-membrane-associated proteins. The lack of obvious membrane attachment suggests a periplasmatic location for FoxE that is in agreement with the requirement of soluble Fe(II) for the photoferrotrophic metabolism of SW2 (9). However, this cellular location implies the occurrence of mechanisms to avoid iron precipitation in the periplasm. Detailed characterization of the iron oxidoreductase FoxE is crucial for the understanding of this photosynthetic metabolism. To investigate the first step of photoferrotrophy in SW2, we performed a detailed functional characterization of FoxE.
EXPERIMENTAL PROCEDURES
Cloning
The foxE gene was amplified by PCR from the plasmid pfoxE (10) and cloned without its periplasmic signal sequence (predicted with SignalP) into the NcoI/EcoRI sites of the pET20b(+) plasmid, which contains the periplasmic signal sequence pelB from Escherichia coli. The fragment pelB:foxE was amplified by PCR and cloned into the BglII/EcoRI restriction site of plasmid pUX19 (11). The resulting plasmid was used to transform E. coli JCB7123 cells containing the pEC86 plasmid (12), which codes for the c-type cytochrome maturation (ccm) operon that allows E. coli to produce cytochromes in aerobic conditions. All constructs were confirmed by DNA sequencing.
Expression and Growth
Cells were grown in Lysogeny Broth (LB) supplemented with 50 μg·ml−1 kanamycin and 34 μg·ml−1 chloramphenicol to maintain selective pressure for the pUX19 and pEC86 plasmids, respectively. Frozen stocks of E. coli JCB7123 containing both plasmids were used to inoculate 200 ml of LB. The culture was grown for 24 h at 30 °C and stirred at 140 rpm. The resulting cell culture was used for a 1% inoculum of four 5-liter conical flasks with 3.5 liters of LB each, and the same growth conditions were used. After cell harvesting, cell pellets were resuspended in 300 ml of extraction solution (0.5 m sucrose, 0.2 m Tris-HCl, 0.5 mm EDTA, 100 mg·L−1 lysozyme, pH 8) and incubated in ice for 30 min with gentle stirring. The resulting spheroplasts were pelleted, and the supernatant, containing the periplasm, was cleared by ultracentrifugation at 138,000 × g for 30 min and then frozen at −80 °C.
Purification
The periplasmic fractions of four growth batches were pooled, concentrated in an ultrafiltration cell with a 30-kDa cut-off membrane, and dialyzed twice against 20 mm Tris-HCl pH 7.6 for 12 h. The resulting fraction was loaded into a DEAE chromatography column equilibrated with 20 mm Tris-HCl, pH 7.6. A step gradient with 20 mm Tris-HCl, 1 m NaCl, pH 7.6, was used to elute the bound proteins. and FoxE was eluted at 150 mm NaCl. The presence of the cytochrome was determined by UV-visible spectroscopy and SDS-PAGE-stained to detect hemes (13). Fractions containing FoxE were pooled, concentrated, and washed with 5 mm potassium phosphate buffer at pH 7 in an ultrafiltration cell with a 30-kDa cut-off membrane. The resulting fraction was loaded into a hydroxylapatite chromatography column equilibrated with 5 mm potassium phosphate buffer at pH 7. Bound proteins were eluted with a step gradient, and FoxE was eluted at 50 mm potassium phosphate buffer at pH 7. The pure protein yield was 1.5 mg per liter of culture medium. Both chromatography steps were performed in a GE Äktaprime Plus purification system. The binding of two heme groups to the FoxE polypeptide was confirmed by mass spectrometry (MALDI-TOF) analysis.
Dynamic Light Scattering (DLS)
DLS experiments were performed in a Malvern Instruments Zetasizer Nano at 25 °C. FoxE samples were prepared in 50 mm potassium phosphate buffer at pH 7. The molecular weight of the FoxE particle was estimated using the manufacturer's software.
UV-Visible Spectroscopy
UV-visible spectra were recorded in a Shimadzu UV-1700 spectrophotometer at room temperature (∼25 °C).
EPR Spectroscopy
EPR spectroscopy was performed in a Bruker EMX spectrometer equipped with an ESR-900 continuous-flow helium cryostat. The spectrum was recorded under the following conditions: microwave frequency, 9.391 GHz; microwave power, 2 milliwatts; modulation frequency, 100 kHz; modulation amplitude, 1 millitesla; temperature, 13 K. FoxE was prepared in 50 mm potassium phosphate pH 7 buffer and oxidized with potassium hexachloroiridate(IV).
NMR Spectroscopy
1H NMR spectroscopy was performed in a 500 MHz Bruker Avance II+ spectrometer at 25 °C. FoxE samples in 50 mm potassium phosphate buffer pH 7 were lyophilized twice and solubilized in D2O before spectra acquisition. The residual water signal was suppressed by presaturation. The sample was reduced with small amounts of sodium dithionite or sodium ascorbate and oxidized with potassium ferricyanide. A two-dimensional NOESY spectrum of a 4.9 mm FoxE sample was obtained with 8192 × 144 points, 512 scans, a 45-kHz sweep width, and a mixing time of 25 ms. Longer mixing times caused the loss of cross-peaks. A superWEFT 180° pulse was used to suppress the water signal and reduce the intensity of sharp diamagnetic signals (14).
Redox Titration
Redox titrations were performed at 25 °C inside an anaerobic glove box (Coy Laboratory Products, Inc.) in an OTTLE cell using a potentiostat (CH Instruments) with a three-electrode system; two platinum wire meshes composed the working electrode, a platinum wire was used as counter electrode, and a saturated calomel electrode was used as the reference electrode. Potential values were converted to standard hydrogen electrode by adding 241 mV to the imposed potentials. The FoxE concentration was 20 μm prepared in 50 mm phosphate buffer with 300 mm KCl. A mixture at 40 μm concentrations of the following mediators was used: potassium ferricyanide, n,n-dimethyl-p-phenyldiamine, p-benzoquinone, 1,2-naphtoquinone-4-sulfonic acid, 1,2-naphtoquinone, trimethyl hydroquinone, phenazine methosulfate, and 1,4-naphtoquinone. Different mediator concentrations were used to check for their possible interference with FoxE. No effects in the reduction potentials were detected. Data were collected in reductive and oxidative directions and were reproducible within 10 mV.
Stopped-flow
Stopped-flow experiments were performed in a KinetAsyst SF-61DX2 Hitech Scientific apparatus placed inside an anaerobic glove box (MBraun 150-GI). FoxE at 1 μm (after mixing) in 50 mm phosphate buffer with 300 mm KCl was reduced with Fe(II)-EDTA at different concentrations (150, 100, and 50 μm after mixing). Reduction of FoxE was followed at the Soret band (417 nm), and the reduction fractions were calculated by normalization using the fully reduced and fully oxidized absorbance values. Fe(II)-EDTA was prepared by mixing FeSO4 and NaEDTA in a 1:1.5 ratio inside the anaerobic glove box. Speciation in solution was calculated using the PHREEQC Interactive 2.18.5314 software with the minteq.v4.dat data base (15). Fe(II)-EDTA was always the dominant species in solution (Table 1).
TABLE 1.
Speciation and reduction potential of Fe-EDTA determined with the minteq.v4.dat database for the experimental conditions used
| Fe(EDTA)2− | Em of Fe-EDTA | |
|---|---|---|
| % | mV | |
| pH 6 | 99 | 130 |
| pH 7 | 89 | 114 |
Kinetic Analysis
The kinetics of reduction of FoxE were analyzed considering a collision model in which the association of the electron donor and the protein is the limiting step in the electron transfer event. Therefore,
Experiments were performed in pseudo-first order conditions. A linear dependence of the pseudo-first order rate constants with Fe(II)-EDTA concentration allowed the determination of second order rate constants. According to Marcus theory, the rate constants depend on the driving force, on the reorganization energy, and on structural factors. To separate the structural factors from the contribution of the driving force, the reduction rate constants (Ki) of each heme i were described by the equation,
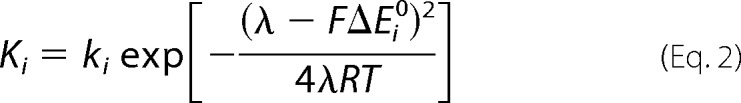 |
where ki is the intrinsic rate constant that accounts for the structural factors of the ith heme, ΔEi0 is the potential of reduction of the ith heme by the electron donor, F is the Faraday constant, R is the gas constant, T is the temperature, and λ is the reorganization energy, taken as 1 eV (16). The reorganization energy and the structural factors were considered constant during reduction. The kinetics of the reduction of FoxE were analyzed considering the two hemes independent and, therefore, described by the sum of two exponentials. The model was implemented in Matlab and fit to the experimental data using the Nelder-Mead simplex algorithm (17). S.E of the fit parameters were obtained from the diagonal elements of the covariance matrix (18).
RESULTS
The purity of FoxE was assessed by SDS-PAGE (Fig. 1). The UV spectrum of FoxE as purified has maxima at 553, 523, 416, 319, and 274 nm. The cytochrome was considered pure with a ratio Abs416/274 ∼5. The presence of the peaks at 553 and 524 nm, the α and β bands respectively, indicate partial reduction of the cytochrome during purification even though all procedures were performed in aerobic conditions. Full reduction with sodium ascorbate originates peaks at 553 nm for the α band, 523 nm for the β band, and 417 nm for the Soret band. In the fully oxidized state, obtained by adding potassium ferricyanide, the Soret band shifts to 411 nm, and the α and β bands become broad, typical of the low spin hexacoordinated hemes.
FIGURE 1.

SDS-PAGE showing pure FoxE. The UV-visible spectrum of FoxE as purified is shown. The inset shows the fully reduced (black) and fully oxidized (gray) spectra of FoxE in the α and β region.
The degree of homogeneity of the sample was determined by dynamic light scattering. The results indicate that the sample is monodispersive with a diameter of 8.3 nm. Assuming a globular shape, this translates into an approximate molecular mass of 99.4 ± 10.1 kDa. This is between three and four times the molecular mass deduced from the annotated sequence plus two hemes (29 kDa), indicating the formation of a homo-trimer or homo-tetramer of FoxE in solution.
EPR spectroscopy was performed to evaluate the spin state and coordination of FoxE (Fig. 2). The spectrum suggests that both hemes are low-spin, rhombic, and hexacoordinated and agrees with typical His-His or His-Met coordinated hemes (19). The amino acid sequence of FoxE deduced from the processed gene shows histidines at positions 70, 147, 168, 183, 224, and 242 and methionines at positions 116, 194, and 230 that could serve as distal ligands for the hemes.
FIGURE 2.

X-band EPR spectrum of fully oxidized FoxE with the background from the cavity subtracted. At the top the g values of the main features of the spectrum are indicated. mT, millitesla.
One-dimensional 1H NMR spectra of FoxE were collected with the sample poised at various partially oxidized conditions (Fig. 3). In the reduced state both hemes are diamagnetic, and in the oxidized state they are low-spin paramagnetic without any visible evidence of high spin, in agreement with the low temperature EPR data. The signals in both oxidation states are much broader than expected for a protein with 29 kDa, in agreement with the formation of an oligomer determined by dynamic light scattering (20). Ferricyanide-oxidized FoxE shows two sets of paramagnetically shifted signals in the spectral region where heme methyls and propionate CH2 protons are found (21). These two sets are differentiated by line width (Fig. 3): a set of sharper signals from one heme and a set of broader signals from the other heme. This indicates that although the sample is homogeneous, as deduced from the dynamic light scattering data, there appears to be microscopic heterogeneity in the environment of one of the hemes that causes broadening of its signals. Progressive reduction of FoxE with sodium ascorbate or sodium dithionite causes the concerted decrease and disappearance of the set of signals with broader line width. This indicates that these signals belong to the same heme, which has the highest reduction potential (HP),4 being the first to be reduced. Further addition of reducing agent causes the decrease and disappearance of the sharper signals that belong to the heme with the lowest reduction potential (LP). There is no spectral discrimination between the hemes of different monomers of FoxE, as expected from a homo-oligomer that necessarily must display symmetry in the arrangement of the monomeric units. The spectra in Fig. 3 also show the appearance of two signals close to −3 ppm upon reduction of the cytochrome. These can be tentatively assigned to the methyl groups of heme axial methionines. In diamagnetic hemes coordinated by methionine this group shows a signal in this region due to ring currents of the porphyrin ring (22). From the order of appearance of those signals during the progress of the titration, the signal at −2.84 ppm can be assigned to the axial methionine of the HP hemes, and the signal at −3.05 ppm can be assigned to the axial methionine of the LP hemes. Also in this case, the signal assigned to the methyl of the methionine attached to the HP heme is broader. Progressive re-oxidation of ascorbate reduced FoxE restores the LP signals followed by the HP signals. However, re-oxidation of dithionite-reduced FoxE only restores the LP signals that appear with a small shift (Fig. 4). In these experiments no high spin signals were detected between 40 and 100 ppm, where high spin heme signals appear. The EPR spectrum of oxidized FoxE previously reduced with dithionite indicates a change in the coordination environment of one of the hemes but not of spin state. The data suggest that the HP heme NMR signals are broadened beyond detection due to chemical exchange. Full oxidation of the sample was confirmed by UV-visible spectroscopy, and no changes in the spectrum were observed. This indicates that reduction by sodium dithionite induces an irreversible conformational change in the protein that mostly affects the environment of the HP hemes.
FIGURE 3.

One-dimensional 1H NMR spectra of FoxE poised at different degrees of oxidation from fully oxidized (bottom) to fully reduced (top). Signals identified with a circle belong to the HP heme, and signals identified with a square belong to the LP heme. The rounded box at approximately −3 ppm highlights the signals tentatively assigned to the heme axial methionines.
FIGURE 4.

One-dimensional 1H NMR spectra of FoxE fully re-oxidized with K3Fe(CN)6 after reduction with sodium dithionite (top) or sodium ascorbate (bottom). Full oxidation of both samples was independently confirmed by UV-visible spectroscopy.
To determine the reduction potentials of the hemes, redox titrations of FoxE were followed by visible spectroscopy (Fig. 5). The data were fit with two independent Nernst equations resulting in potentials of 207 and 270 mV at pH 7 and potentials of 253 and 309 mV at pH 6. The potentials of both hemes in each monomer increase with a decreasing pH.
FIGURE 5.

Redox titrations of FoxE at pH 6 and 7 at 25 °C. The solid lines represent the best fits of the data. SHE, standard hydrogen electrode.
Kinetic measurements of FoxE reduction by Fe(II)-EDTA were performed in pseudo-first order conditions at three different Fe(II)-EDTA concentrations. These measurements yield a biphasic trace with each phase corresponding to 50% of FoxE reduction (Fig. 6). The pseudo-first order rate constants of each phase show a linear dependence with Fe(II)-EDTA concentration. Experiments were performed at pH 6 and 7. The biphasic behavior was maintained at both pH values, and FoxE reduction was faster at the more acidic pH (Table 2). Measurements starting with partially reduced FoxE have decreased amplitude of the fast phase of reduction at both pH values.
FIGURE 6.

Kinetic traces of FoxE reduction with Fe(II)-EDTA at pH 6 and 7 at 25 °C. At each pH FoxE was reduced starting from totally or partially oxidized. The solid lines represent the best fit of the data.
TABLE 2.
Reduction potentials of the two hemes of FoxE and kinetic parameters for the reduction of FoxE determined at pH 6 and pH7 at 25 °C
Values in parentheses indicate the S.E. determined from the diagonal elements of the covariance matrix.
| pH 7 | pH 6 | |
|---|---|---|
| EmLP (mV) | 207 (4) | 253 (4) |
| EmHP (mV) | 270 (4) | 309 (4) |
| kLP (s−1μm−1) | 2.0 (0.2) | 1.8 (0.3) |
| kHP (s−1μm−1) | 8 (2) | 18 (3) |
| KLP (s−1mm−1) | 0.67 (0.05) | 1.0 (0.2) |
| KHP (s−1mm−1) | 8 (1) | 26 (4) |
DISCUSSION
c-type cytochromes are ubiquitous redox proteins present in all domains of life. Depending on many factors such as solvent exposure or the nature of iron distal coordination, c-type cytochromes display reduction potentials that range from approximately −550 to 450 mV (23). This large range allows for their involvement in diverse bioenergetic pathways, including Fe(II) oxidation. A multiheme cytochrome that is the putative Fe(II) oxidoreductase from R. ferrooxidans SW2, FoxE, was successfully produced in E. coli and was functionally characterized in vitro. According to the EPR spectrum of FoxE, the two heme types have similar rhombic magnetic tensors. The g values observed are in agreement with the distal ligand of the hemes being either a methionine or a histidine. The two NMR signals present at approximately −3 ppm in the reduced protein and the positive reduction potentials are strong evidence that the distal ligands are methionines in both hemes.
Mechanistic insights into FoxE reduction were obtained from NMR experiments. The progressive reduction of FoxE followed by NMR spectroscopy showed that the two hemes are reduced at different poised potentials. This can arise from different intrinsic reduction potentials or from a large negative cooperativity between the hemes. The latter option implicates a close proximity between the hemes or a substantial conformational change in the heme environments. However, experimental evidence indicates otherwise. In the NOESY spectrum no cross-peaks were observed between the signals of the two different hemes (data not shown). Because the NOE decays with the sixth power of distance, the lack of NOEs suggests a distance greater than 5 Å between any pair of atoms in the hemes in each monomer. One-dimensional NMR spectra of partially reduced FoxE present no shifts of the LP signals toward the diamagnetic chemical shift position of the reduced state. This suggests that intramolecule electron transfer is slow in the NMR timescale (24). With a NOESY mixing time of 25 ms and using the relationship between distance and electron transfer rate (25), all the hemes in the oligomer are estimated to be more than 16 Å apart from each other. At this distance electrostatic interactions are negligible and cannot cause significant negative cooperativities (26). These data suggest that all the hemes in the oligomer are reduced independently and, therefore, the HP and LP hemes are expected to be found in different electrostatic environments. Also, substantial conformational rearrangement of the heme environment would change the chemical shift pattern of the paramagnetic heme signals, which are exquisitely sensitive to conformational changes. This is not observed in the experimental data. Given the evidence for lack of significant electrostatic interactions between hemes and rearrangement of the hemes regions, the data from the redox titrations of FoxE were fit by adding two Nernst equations providing the reduction potentials of the HP and the LP hemes.
The influence of pH on the reduction potentials of the hemes was also studied. It was observed that lowering the pH from 7 to 6 results in an increase in the reduction potential of all hemes (46 mV for the LP hemes and 39 mV for the HP hemes). This influence of pH (redox-Bohr effect) indicates that electron transfer is thermodynamically coupled to proton transfer in the physiological pH range. In other multiheme cytochromes the heme propionates are often identified as the major contributors to this effect (24). In environments with circumneutral pH, ferrous iron has many different forms with reduction potentials ranging from −200 mV to almost 400 mV (27). The potentials of the hemes of FoxE are positioned to make the oxidation of many of these iron forms thermodynamically favorable and enable FoxE to perform its predicted task of capturing electrons from Fe(II) to deliver to the photosynthetic reaction center either directly or via a relay of other electron transfer partners (Fig. 7).
FIGURE 7.

Electron flow diagram in the periplasm of SW2. The vertical bar represents reduction potential. The solid arrows indicate electron flow. FoxE can potentially reduce any of the components of the cyclic photosynthesis electron chain: bc1, cytochrome bc1; c2, cytochrome c2; RC, photosynthetic reaction center. The dashed arrow indicates the electron transfer through the quinone pool from the light excited RC to the cytochrome bc1. The vertical Fe2+ line indicates the reduction potential range of Fe2+ species at circumneutral pH.
Having shown that FoxE is thermodynamically suitable for physiologically harvesting electrons from soluble ferrous iron to support anoxygenic photosynthesis, the electron transfer kinetics was investigated. In the stopped-flow experiments Fe(II)-EDTA was used as the electron donor for three reasons; it is soluble and thus is a suitable mimic of the physiological iron forms used by SW2, its reduction potential is within the range of values for iron compounds likely to be found in the habitat of SW2 (28), and in the pH range corresponding to optima for SW2 growth (29), a single species is dominant, therefore, facilitating the kinetics analysis. Reduction of fully oxidized FoxE by Fe(II)-EDTA is a biphasic process (Fig. 6). The fast phase and the slow phase constitute ∼50% of total reduction each. The NMR data established that the intramolecule electron transfer is slow, which means that the hemes are independently reduced by Fe(II)-EDTA, and each phase corresponds to the reduction of each heme type. As such, the amplitude of each phase is proportional to the initial oxidation fraction of the respective heme type. To assign each phase to specific hemes, stopped-flow experiments were performed with FoxE poised in a partially reduced state (Fig. 8). Because the two heme types have different reduction potentials, in partially reduced FoxE they will have different oxidation fractions. In these experiments the fast phase has smaller amplitude than the slow phase. This observation identifies the HP hemes, which have a smaller initial oxidation fraction, as those reduced in the fast phase. The LP hemes are reduced in the slow phase.
FIGURE 8.

Schematic representation of reduction of each FoxE monomer. Open circles represent oxidized heme, and closed circles represent reduced hemes. Indicated are the reduction rate constants present in Table 2. A, shown are conditions where the cytochrome is fully oxidized at the beginning of the kinetic experiment. The dashed lines indicate slow intramonomer electron transfer. Because KLP is faster than the intramonomer electron transfer, the bottom microstate has a negligible contribution in the kinetic experiment. B, shown are conditions when the cytochrome is partially reduced at the beginning of the kinetic experiment. The system has reached equilibrium between the two intermediate microstates before the reaction with Fe(II)-EDTA is initiated.
Having established that the reduction potentials are pH-dependent, the influence of pH on the kinetics of the iron-oxidizing activity of FoxE was investigated by measurements made at pH 6 and 7. Increasing the pH from 6 to 7 causes a decrease in the reduction rate constants (Ki). To understand the role of the driving force in this change, intrinsic rate constants (ki) were calculated according to Equation 2. These are rate constants that are independent of driving force and depend only on structural factors of the reaction. It is possible to observe that for the LP hemes the decrease in reduction rate constant is caused exclusively by a decrease in driving force, as the corresponding intrinsic rate constant (kLP) remains approximately constant with pH variation. For the HP hemes, a decrease in intrinsic rate constants (kHP) from pH 6 to 7 contributes to the decrease in rate constant (KHP), but the driving force is again the dominating contribution. Therefore, the data show that pH modulates the rates of iron oxidation by an increase in the driving force of the reaction at more acidic pH values. A similar approach was followed in the kinetic characterization of iron reduction by the MtrC and OmcA iron reductases from the bacterium Shewanella oneidensis MR-1 (30). At pH 7 the second order rate constants of iron oxidation by FoxE are 1–2 orders of magnitude below the lower values obtained for iron reduction by MtrC and OmcA. At pH 6, however, the second order rate constant for the HP hemes falls within the same order of magnitude as those determined for OmcA.
Based on the reduction potentials and intrinsic rates constants, it is possible to make some structural considerations about the heme environments. The higher potential of the HP hemes suggests a more hydrophobic environment. However, the intrinsic rate constants indicate that Fe(II)-EDTA has more access to the HP hemes. This could arise from a surface region near the HP hemes with favorable shape and electrostatic properties toward Fe(II)-EDTA. Also, as suggested by the broader NMR signals of the HP hemes, the HP heme region seems to be more flexible. This increased mobility might contribute to the higher intrinsic rate constant of reduction of this heme. Another structural consideration can be made based on the effects caused by dithionite on the NMR spectra of FoxE. These changes suggest that FoxE has redox-dependent structural changes that are triggered by dithionite but not by ascorbate or other reducing agent with higher reduction potential. Therefore, these changes occur at negative potentials unsuitable for oxidation of Fe(II) compounds (Fig. 7) and are unlikely to be relevant for the physiological activity of FoxE.
This work shows that the FoxE cytochrome is thermodynamically and kinetically competent for oxidizing iron in the periplasm of SW2. This implies that SW2 has a strategy to prevent Fe(III) precipitation in the periplasm and on the cell surface. Different iron-oxidizing bacteria appear to have different mechanisms to avoid precipitation (8), and some, such as Rhodomicrobium vannielii, cannot escape becoming encrusted by iron minerals (31). Iron chelators produced by the cells have been suggested to solubilize Fe(III), and it is known that the growth of SW2 increases the solubility of Fe(III) in the supernatant of the culture medium (28). However, no strong siderophores were detected in SW2 spent medium, and the energetic cost of producing such a molecule would likely be prohibitive (9). An alternative strategy for keeping Fe(III) soluble is the creation of a low pH microenvironment around the cell to promote precipitation away from the cell both thermodynamically and kinetically (8, 9, 32). This implies a tight pH control of the iron oxidation step. The kinetic data reported in this work show that in the physiological pH range for SW2, the rates of iron oxidation by FoxE increase with lower pH. This modulation of the rate of iron oxidation is made mostly by changing the reduction potential of the hemes and not by the adjustment of the structural factors involved in the electron transfer. Modulating the reaction rate by the driving force favors adaptation to an environment where ferrous iron can be available in multiple forms. Manipulating the driving force generates a similar outcome for all possible Fe(II) forms, whereas adjusting structural factors could have different outcomes depending on the specific molecular nature of Fe(II). Given our results, the iron oxidation activity by FoxE appears optimized to work in the low pH microenvironment found in the vicinity of colonies of SW2 (9), which would be consistent with a pH strategy to minimize Fe(III) precipitation.
On the structural side, this work leaves several open issues. The experimental evidence points to the formation of a trimer or tetramer in solution. This result does not have implications on the iron oxidation activity measured here. However, it has implications for how FoxE interacts with its physiological partners and motivates future work to identify these partners and characterize how they interact with FoxE. The binding pockets of the two hemes in each monomer of FoxE also appear to display different dynamics, at least when the protein is isolated, and may suggest points of partner docking. For exploring these issues, structural studies of the proteins involved must be pursued.
In summary, we have functionally characterized an iron oxidoreductase from a contemporary photoferrotrophic bacterium. The biochemical properties of FoxE show that it is thermodynamically competent to perform physiological Fe(II) oxidation and intrinsically regulate its activity to support the avoidance of Fe(III) (hydr)oxide precipitation within the cell. This is the first molecular characterization of this ancient form of phototrophy, which has been implicated in leaving profound signatures in the geological record at early periods in Earth history.
Acknowledgments
We thank Catarina M. Paquete for helpful discussions and Miguel Teixeira and Manuela Pereira for support in the EPR data collection. We acknowledge CERMAX at ITQB and Rede Nacional de RMN for access to the facilities where NMR data were collected. Mass spectrometry data were obtained by the Mass Spectrometry Laboratory, Analytical Services Unit, Instituto de Tecnologia Química e Biológica. Rede Nacional de RMN (REDE/1517/RMN/2005) was supported by POCI 2010 and Fundação para a Ciência e a Tecnologia (Fundação para a Ciência e a Tecnologia).
This research was supported by the MIT-Portugal Program (MIT-Pt/BS-BB/0014/2008) and Fundação para a Ciência e a Tecnologia (REEQ/336/BIO/2005, PEst-OE/EQB/LA0004/2011).
- HP
- highest reduction potential
- LP
- lowest reduction potential.
REFERENCES
- 1. Blankenship R. E. (1992) Origin and early evolution of photosynthesis. Photosynth. Res. 33, 91–111 [PubMed] [Google Scholar]
- 2. Xiong J. (2000) Molecular evidence for the early evolution of photosynthesis. Science 289, 1724–1730 [DOI] [PubMed] [Google Scholar]
- 3. Widdel F., Schnell S., Heising S., Ehrenreich A., Assmus B., Schink B. (1993) Ferrous iron oxidation by anoxygenic phototrophic bacteria. Nature 362, 834–836 [Google Scholar]
- 4. Planavsky N. J., McGoldrick P., Scott C. T., Li C., Reinhard C. T., Kelly A. E., Chu X., Bekker A., Love G. D., Lyons T. W. (2011) Widespread iron-rich conditions in the mid-Proterozoic ocean. Nature 477, 448–451 [DOI] [PubMed] [Google Scholar]
- 5. Kappler A., Pasquero C., Konhauser K. O., Newman D. K. (2005) Deposition of banded iron formations by anoxygenic phototrophic Fe(II)-oxidizing bacteria. Geology 33, 865–868 [Google Scholar]
- 6. Ehrenreich A., Widdel F. (1994) Anaerobic oxidation of ferrous iron by purple bacteria, a new type of phototrophic metabolism. Appl. Environ. Microbiol. 60, 4517–4526 [DOI] [PMC free article] [PubMed] [Google Scholar]
- 7. Miot J., Benzerara K., Obst M., Kappler A., Hegler F., Schädler S., Bouchez C., Guyot F., Morin G. (2009) Extracellular iron biomineralization by photoautotrophic iron-oxidizing bacteria. Appl. Environ. Microbiol. 75, 5586–5591 [DOI] [PMC free article] [PubMed] [Google Scholar]
- 8. Schadler S., Burkhardt C., Hegler F., Straub K. L., Miot J., Benzerara K., Kappler A. (2009) Formation of cell-iron-mineral aggregates by phototrophic and nitrate-reducing anaerobic Fe(II)-oxidizing bacteria. Geomicrobiol. J. 26, 93–103 [Google Scholar]
- 9. Kappler A., Newman D. K. (2004) Formation of Fe(III)-minerals by Fe(II)-oxidizing photoautotrophic bacteria. Geochim. Cosmochim. Acta 68, 1217–1226 [Google Scholar]
- 10. Croal L. R., Jiao Y., Newman D. K. (2007) The fox operon from Rhodobacter strain SW2 promotes phototrophic Fe(II) oxidation in Rhodobacter capsulatus SB1003. J. Bacteriol. 189, 1774–1782 [DOI] [PMC free article] [PubMed] [Google Scholar]
- 11. Jeffrey V., Joachim M. (1991) New pUC-derived cloning vectors with different selectable markers and DNA replication origins. Gene 100, 189–194 [DOI] [PubMed] [Google Scholar]
- 12. Arslan E., Schulz H., Zufferey R., Künzler P., Thöny-Meyer L. (1998) Overproduction of the Bradyrhizobium japonicum c-type cytochrome subunits of the cbb3 oxidase in Escherichia coli. Biochem. Biophys. Res. Commun. 251, 744–747 [DOI] [PubMed] [Google Scholar]
- 13. Francis R. T., Jr., Becker R. R. (1984) Specific indication of hemoproteins in polyacrylamide gels using a double-staining process. Anal. Biochem. 136, 509–514 [DOI] [PubMed] [Google Scholar]
- 14. Inubushi T., Becker E. D. (1983) Efficient detection of paramagnetically shifted NMR resonances by optimizing the WEFT pulse sequence. J. Magn. Reson. 51, 128–133 [Google Scholar]
- 15. Parkhurst D. L., Appelo C. A. J. (1999) Users's guide to PHREEQC (Version 2). A computer program for speciation, batch-reaction, one-dimensional transport, and inverse geochemical calculations. U.S. Geological Survey Water-Resources Investigations Report 99–4259 [Google Scholar]
- 16. Catarino T., Turner D. L. (2001) Thermodynamic control of electron transfer rates in multicentre redox proteins. Chembiochem 2, 416–424 [DOI] [PubMed] [Google Scholar]
- 17. Lagarias J. C., Reeds J. a., Wright M. H., Wright P. E. (1998) Convergence Properties of the Nelder-Mead Simplex Method in low dimensions. SIAM J. Optim. 9, 112–147 [Google Scholar]
- 18. Press W. H., Flannery B. P., Teukolshy S. A., Vetterling W. T. (1989) Numerical recipes; The art of scientific computing (FORTRAN Version). Cambridge University Press, Cambridge [Google Scholar]
- 19. Zoppellaro G., Bren K. L., Ensign A. A, Harbitz E., Kaur R., Hersleth H. P., Ryde U., Hederstedt L., Andersson K. K. (2009) Studies of ferric heme proteins with highly anisotropic/highly axial low spin (S = 1/2) electron paramagnetic resonance signals with bis-histidine and histidine-methionine axial iron coordination. Biopolymers 91, 1064–1082 [DOI] [PMC free article] [PubMed] [Google Scholar]
- 20. Pessanha M., Rothery E. L., Miles C. S., Reid G. A, Chapman S. K., Louro R. O., Turner D. L., Salgueiro C. A., Xavier A. V. (2009) Tuning of functional heme reduction potentials in Shewanella fumarate reductases. Biochim. Biophys. Acta 1787, 113–120 [DOI] [PubMed] [Google Scholar]
- 21. Dantas J. M., Saraiva I. H., Morgado L., Silva M. A, Schiffer M., Salgueiro C. A., Louro R. O. (2011) Orientation of the axial ligands and magnetic properties of the hemes in the cytochrome c(7) family from Geobacter sulfurreducens determined by paramagnetic NMR. Dalton Trans. 40, 12713–12718 [DOI] [PubMed] [Google Scholar]
- 22. Xavier A. V., Czerwinski E. W., Bethge P. H., Mathews F. S. (1978) Identification of the haem ligands of cytochrome b562 by X-ray and NMR methods. Nature 275, 245–247 [DOI] [PubMed] [Google Scholar]
- 23. Reedy C. J., Elvekrog M. M., Gibney B. R. (2008) Development of a heme protein structure-electrochemical function database. Nucleic Acids Res. 36, D307–D313 [DOI] [PMC free article] [PubMed] [Google Scholar]
- 24. Fonseca B. M., Saraiva I. H., Paquete C. M., Soares C. M., Pacheco I., Salgueiro C. A., Louro R. O. (2009) The tetraheme cytochrome from Shewanella oneidensis MR-1 shows thermodynamic bias for functional specificity of the hemes. J. Biol. Inorg. Chem. 14, 375–385 [DOI] [PubMed] [Google Scholar]
- 25. Moser C. C., Dutton P. L. (1992) Engineering protein structure for electron transfer function in photosynthetic reaction centers. Biochim. Biophys. Acta 1101, 171–176 [PubMed] [Google Scholar]
- 26. Louro R. O., Catarino T., Paquete C. M., Turner D. L. (2004) Distance dependence of interactions between charged centres in proteins with common structural features. FEBS Lett. 576, 77–80 [DOI] [PubMed] [Google Scholar]
- 27. Bird L. J., Bonnefoy V., Newman D. K. (2011) Bioenergetic challenges of microbial iron metabolisms. Trends Microbiol. 19, 330–340 [DOI] [PubMed] [Google Scholar]
- 28. Straub K. L., Benz M., Schink B. (2001) Iron metabolism in anoxic environments at near neutral pH. FEMS Microbiol. Ecol. 34, 181–186 [DOI] [PubMed] [Google Scholar]
- 29. Hegler F., Posth N. R., Jiang J., Kappler A. (2008) Physiology of phototrophic iron(II)-oxidizing bacteria. Implications for modern and ancient environments. FEMS Microbiol. Ecol. 66, 250–260 [DOI] [PubMed] [Google Scholar]
- 30. Wang Z., Liu C., Wang X., Marshall M. J., Zachara J. M., Rosso K. M., Dupuis M., Fredrickson J. K., Heald S., Shi L. (2008) Kinetics of reduction of Fe(III) complexes by outer membrane cytochromes MtrC and OmcA of Shewanella oneidensis MR-1. Appl. Environ. Microbiol. 74, 6746–6755 [DOI] [PMC free article] [PubMed] [Google Scholar]
- 31. Heising S., Schink B. (1998) Phototrophic oxidation of ferrous iron by a Rhodomicrobium vannielii strain. Microbiology 144, 2263–2269 [DOI] [PubMed] [Google Scholar]
- 32. Hegler F., Schmidt C., Schwarz H., Kappler A. (2010) Does a low pH microenvironment around phototrophic Fe(II)-oxidizing bacteria prevent cell encrustation by Fe(III) minerals? FEMS Microbiol. Ecol. 74, 592–600 [DOI] [PubMed] [Google Scholar]