

Abstract
Despite the continued presence of PCBs in indoor and ambient air, few studies have investigated the inhalation route of exposure. While dietary exposure has declined, inhalation of the semi-volatile, lower-chlorinated PCBs has risen in importance. We measured the uptake, distribution and time course of elimination of inhaled PCB congeners to characterize the pulmonary route after short-term exposure. Vapor-phase PCBs were generated from Aroclor 1242 to a nose-only exposure system and characterized for congener levels and profiles. Rats were exposed via inhalation acutely (2.4 mg/m3 for 2 hr) or subacutely (8.2 mg/m3, 2 hr × 10 days), after which pulmonary immune responses and PCB tissue levels were measured. Animals acutely exposed were euthanized at 0, 1, 3, 6 and 12 hr post exposure to assess the time course of PCB uptake and elimination. Following rapid absorption and distribution, PCBs accumulated in adipose tissue, but decayed in other tissues with half-lives increasing in liver (5.6 hr) < lung (8.2 hr) < brain (8.5 hr) < blood (9.7 hr). PCB levels were similar in lung, liver and adipose tissue, lower in brain and lowest in blood. Inhalation of the airborne PCB mixture contributed significantly to the body burden of lower chlorinated congeners. Congeners detected in tissue were mostly ortho-substituted ranging from mono- to pentachlorobiphenyls. Selective uptake and elimination led to accumulation of a distinct congener spectrum in tissue. Minimal evidence of toxicity was observed.
Keywords: polychlorinated biphenyls, time course, inhalation exposure, airborne mixture, Toxic equivalents (TEQs)
Introduction
Polychlorinated biphenyls (PCBs) are a family of synthetic organic chemicals that contain 209 congeners with varying chemical structures. Their industrial usage spanned the 50 years until they were banned since 1977 in the United States. PCBs are still being emitted from industrial facilities, poorly maintained waste sites, building demolition, incineration, caulking material in buildings, or dredging of waterways (1, 2). PCBs are also produced and released through production and use of paint and colored products (3). Exposure to PCBs from ingestion of contaminated food has been well studied (4). Inhalation of PCBs in indoor air is found comparable to dietary exposure (5) and can even become a major route of exposure to children (6). The majority of this pollutant in the ambient air environment exits as a vapor mixture, rather than associated with particles (7) and the magnitude of airborne concentration rises with population density (8). Indoor air exposures to PCBs may be more significant than ambient air exposure, with at least ten and up to 100,000-fold higher concentrations (9). The lack of temporal decline in indoor air exposures as compared to the significant downward trend in dietary contamination (5) makes inhalation an increasingly important route of PCB exposure.
The impact of inhalation on overall human exposure of PCBs is most evident for the lower chlorinated PCBs, due to their lower lipophilicity, greater volatility and susceptibility to metabolism (10). Human studies revealed that exposure to contaminated indoor air increased the concentrations of lower chlorinated congeners in plasma (11, 12). The toxicological importance of these more volatile congeners has been recognized recently as the evidence for their adverse health effects is mounting. Thyroid hormone elevations and histologic abnormalities were observed in rats exposed to Aroclor 1242 vapors for 30 days (13). The mutagenicity of PCB 3 and the tumor initiating activities of several other lower molecular-weight congeners (PCBs 15, 52 and 77) have been demonstrated in vivo (14, 15). Lower chlorinated PCBs and their metabolites have repeatedly been shown as estrogenic and capable of interfering with hormone homeostasis (16, 17). The metabolites can be more efficacious than their parent compounds as receptor agonists (18) and cancer initiators for their reactivity towards cellular nucleophiles (19). The susceptibility to metabolic activation implies a larger risk of these congeners. However, the complexity of exposure mixtures in the environment hampers risk characterization. Information on how the relative concentration of congeners in exposure mixtures relate to blood and tissue uptake and how the concentrations in tissues change over time is very limited.
To our knowledge, this is the first investigation describing the rate and extent of adsorption, distribution and elimination of individual PCB congeners in blood and tissue of laboratory animals exposed via inhalation. We have developed a dynamic nose-only exposure system exposing animals to PCB vapor mixtures from commercial preparations and shown diversity in the extent of uptake and elimination among congeners. We also report the biological half-lives of individual congeners in organs or tissues, especially the lower chlorinated PCBs and congeners detectable in environmental samples.
Experimental Section
Generation of PCB Atmosphere
IUPAC identities, numbered PCB 1 (monochlorobiphenyl) through PCB 209 (decachlorobiphenyl) are used for congener identification (20). PCBs and all other chemicals were obtained from commercial sources or synthesized in our laboratory (see the Supporting Information).
Aroclor 1242 (Electrical Grade, Monsanto Lot KB-05-415) was used as the source material to generate PCB exposure atmospheres. The solution was held in a custom built, Greenburg-Smith-style impinger resting in a precision temperature-controlled water bath at 25 °C (Figure 1). All system components were constructed of glass. Pure air (4.0 L/min) was bubbled through the Aroclor liquid to facilitate PCB volatilization. The PCB vapor-laden air was then diluted and supplied to a nose-only exposure chamber (InTox, Inc., Albuguerque, NM) as described previously (21) at a flow rate of 11.0 L/min. A sampling cartridge filled with Amberlite XAD-2 polymeric absorbent resin (XAD, Supelco Analytical, Bellefonte, PA) captured the PCB atmosphere drawn out of the exposure apparatus. The XAD cartridge was collected each day over the exposure period and extracted for PCB atmosphere characterization. The PCB exposure system was placed in a 6 m3 glass and stainless steel secondary containment structure for exhaust control and operated at negative pressure to ensure no leakage outward. A sham exposure nose-only system for control animals was located in an adjacent lab where no PCBs have ever been deliberately introduced.
Figure 1.
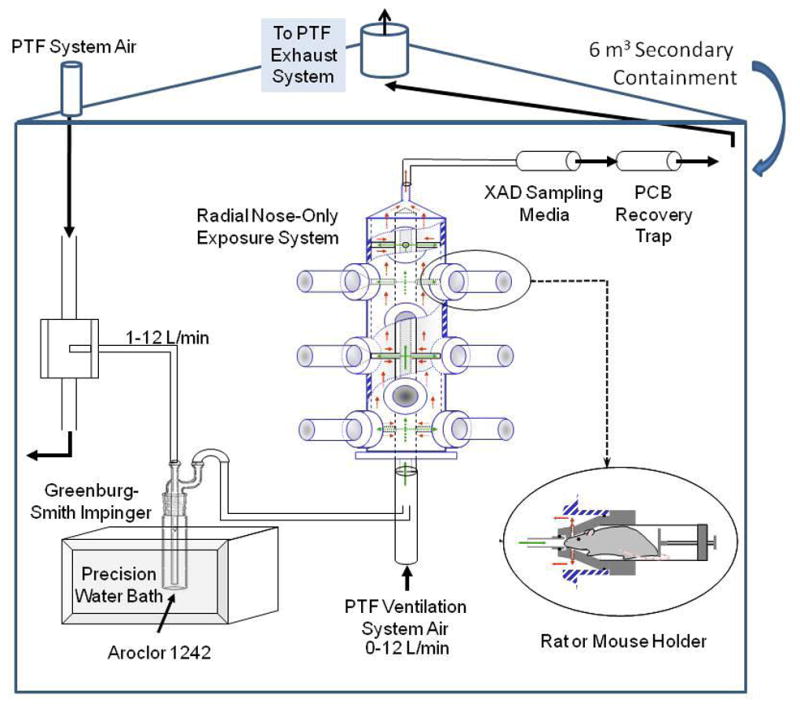
Diagram of the nose-only PCB inhalation exposure system in a secondary containment structure.
Animal Protocol
Animal protocols were approved by the Institutional Animal Care and Use Committee and animals were housed in our AAALAC-approved on-site vivarium with food and water provided ad libitum. Male Sprague-Dawley rats (Harlan, Inc., Indianapolis, IN) were exposed to the generated PCB atmosphere subacutely or acutely through a nose-only inhalation system (Figure 1), while sentinel rats were maintained in our vivarium for health surveillance. After exposure the animals were euthanized with isoflurane followed by cervical dislocation. Whole blood was collected via cardiac puncture and serum samples were prepared. Lung and trachea, liver and brain were excised and stored at −20°C for PCB analysis. Adipose tissue was taken from the peritoneal fat surrounding the intestines.
In the subacute study, animals (187.9±2.8 g) were exposed to either the generated PCB atmosphere (n=9) or filtered lab air (n=9) two hr/day with two 1-hr exposures separated by a 2-hr break. Two rats in the PCB exposure group were exposed for 4 days, while 7 rats were exposed for 10 days during a two-week period.
In the acute study, animals were randomly assigned into groups (239.9±2.7 g). Five groups of PCB-exposed animals (n = 3/group) were exposed for a total of 2 hrs, with 1 hr break in between. They were serially euthanized at 0 hr, 1 hr, 3 hr, 6 hr, and 12 hr post exposure. Two groups of sham animals (n = 2/group) exposed to filtered lab air were euthanized at 0 hr and 6 hr post exposure. In both studies, animals were 8-week old at the time of euthanization.
Tissue and XAD Extraction for PCB Analysis
PCBs were extracted from lung+trachea, liver and brain (0.9–1.2 g each) and adipose tissue (0.3–0.4 g) samples using pressurized liquid extraction (ASE 200, Dionex, Sunnyvale, CA) as described earlier (22). Each set of tissue samples was accompanied by a method blank, a tissue blank and an ongoing precision and recovery (OPR) spike sample. Each sample was spiked with a surrogate standard including PCB 14 (100 ng) and deuterium-labeled PCB 65 (d-PCB 65, 100 ng) in hexane. The extracted solutions were concentrated to 0.75 ml (TurboVap II, Caliper Life Sciences Inc., Hopkinton, MA) and cleanup was performed (22) for gas chromatography (GC) with mass selective detection (GC tandem mass spectrometry, GC/MS/MS) determination. PCBs were extracted from serum samples using the same protocol. Lipid content was determined by a standard gravimetric method (22). Total cholesterol and triglycerides in serum samples were determined using a commercial test kit (Trig/GB and Chol tests for Roche/Hitachi 917 system; Roche Diagnostics, Indianapolis, IN). Blood lipids were calculated using the formula (23):
Each XAD cartridge was loaded with 10 g of pre-extracted XAD-2 resin packed with filters and cleaned glass wool. After collection, all samples were placed in sealed zip-lock bags, stored at 4°C until analysis and were later extracted using the same protocol as above.
PCB Analysis
XAD extracts were spiked with 100 ng of PCB 204 as internal standard prior to analysis. The tissue extract was concentrated to 100 μl for detection of low PCB levels and then spiked with 20ng of PCB 204. PCB congeners were analyzed using GC/MS/MS modified from the EPA method 1668A (20) as described previously (2, 24). Briefly, the quantification of PCB congeners used an Agilent 6890N GC with an Agilent 7683 series autosampler coupled to a Waters Micromass Quattro micro GC MS (Milford, MA), operating under electron impact positive mode at 70 eV and multiple reaction monitoring mode with a trap current of 200 μA. This method separated the 209 congeners into about 170 peaks. PCB congener concentrations were corrected for surrogate recoveries. Quality assurance measures are further described in the Supporting Information.
Toxicity Assessment
In the subacute experiment, bronchoalveolar lavage (BAL) fluid was collected, processed, and used for enumeration of total and differential cell counts and analysis of total protein, lactate dhydrogenase (LDH) activity and cytokine levels as previously described (25).
Total protein was determined using the Bradford protein assay with bovine serum albumin as the standard (Bio-Rad Laboratories, Hercules, CA). LDH activity released from the cytosol of damaged cells was measured spectrophotometrically (Roche Diagnostics, Indianapolis, IN).
Cytokine assays were performed using a multiplex, suspension array system (BioRad, Hercules, CA) including 10 selected cytokines (Invitrogen Corp., Carlsbad, CA). Cytokine concentrations below the valid range of the standard curve were assigned a value imputed from the lower limit of detection (LLOD) divided by √2 (26).
Animals were decapitated and the upper respiratory tracts were decalcified and trimmed for histologic evaluation (27). Lungs, livers and thymuses were fixed and embedded in paraffin. Sections were stained with hematoxylin and eosin, and evaluated by a certified veterinary pathologist (28).
Statistical analysis
Statistical analyses were performed using SAS (version 9.2; SAS, Inc., Cary, NC). Summary data are generally expressed as the arithmetic mean and standard error. Two-way analysis of variance (ANOVA) with time as a repeated measure was used to determine differences in body weight gain between PCB-exposed and sham groups. Two-sample t-tests for equal or unequal variances were used to compare other measurements between exposure and control groups. In all analyses, a p-value < 0.05 was considered significant.
Results
Characterization of PCB atmospheres
The performance of the generation system was evaluated by characterization of PCBs collected with XAD cartridges. The more volatile congeners were well represented in our generated vapor mixture, while hexa-, hepta-, octa- and nonachlorobiphenyls were barely detected (Figure 2A). The lower chlorinated congeners (mono-, di- and trichlorobiphenyls) represented 90% of the total PCB load. PCB 1, 4, 6, 8, 15, 17, 18+30, 20+28, 21+33, 31, and 52 (the + indicates coelutions that are quantified as the sum of the congeners listed) were most abundant by mass, accounting for 83±1 % of total, as compared to the much lower prevalence in the source material, Aroclor 1242 (41%). Our generation system showed a high degree of consistency both in total concentration and profile distribution of congeners in airborne vapor production (Figure 2B).
Figure 2.

Average distribution profile of all congeners during 10 d exposure (A, inset plot showing 0–2.5% on y axis) and day-to-day profile of most prevalent congeners (B) in generated PCB vapor mixture.
Subacute exposure
Rats exposed to a high concentration of PCB vapor mixture for 10 days experienced an average concentration of total PCBs of 8.2 ± 0.5 mg/m3 (concentrations each day: 6.33, 5.46, 9.28, 7.31, 8.07, 8.53, 8.81, 9.90, 9.00, 9.75 mg/m3). Assuming a breathing frequency of 95 breaths/min, a tidal volume of 1.5 mL/breath and complete uptake of inhaled PCBs, we would predict that each rat was nominally exposed to 1400 μg PCBs. Sham-exposed rats had low, but detectable, levels of PCBs in their tissues perhaps from dietary intake or low levels of PCBs in indoor air. However, exposed rats had PCB levels from 80-fold (blood) to 700-fold higher (lungs) than sham-exposed animals. Rats exposed for 4 days accumulated 18% as much in the lungs as 10-day exposed rats (Table 1), yet almost the same amount (89%) in livers as 10-day exposed rats. Much larger amounts of PCBs were found in liver and lung than in blood. PCB 20+28, 49+69, 52, 60, 61+70+74+76, 66, 83+99+112, 85+116+117, 90+101+113, 105, 118 were leading congeners in the tissues (Table S1). Toxic equivalency (TEQ) concentration, an estimate of the total 2,3,7,8-tetrachlorodibenzo-p-dioxin (TCDD)-like activity, was calculated according to the reevaluated toxic equivalency factors (TEF) (29). After exposure to the vapor mixture (TEQ = 3.7 ± 0.5 ng/m3), the detected congeners with a TEF value included PCB 77, 81, 105, 114, 118, 123, 126. The highest TEQ concentration was found in liver as 1464 pg/g lipid weight (l. w.) and much less in lung (11 pg/g l. w.) and blood (0.04 pg/g l. w.).
Table 1.
Mean ± standard error of total PCB levels (ng/g lipid weight) in liver, lung and blood from rats after subacute inhalation exposure.
| Total PCBs | Sham n = 9 | 10-day Exposure n =7 | 4-day Exposure n = 2 |
|---|---|---|---|
| Liver | 44.1 ± 24.7 | 6681.3 ± 324.7*** | 5965.2 |
| Lung | 9.1 ± 2.4 | 6714.2 ± 1122.3** | 1190.7 |
| Blood | 0.21 ± 0.03 | 18.0 ± 2.5*** | 18.9 |
Levels in the 10-day exposed group were significantly greater than control group,
p < 0.01,
p < 0.001 (t-test for unequal variances).
The average weight gain of the PCB-exposed animals was significantly lower than sham animals (Figure S1, repeated-measures ANOVA: p < 0.01, effect of time × treatment). However, BAL fluid macrophages, neutrophils and lymphocytes were not significantly changed. Total protein and LDH activity measured did not show any significant difference (Table S5) and this also applied to the measured cytokines (Table S6). Histologic evaluation of the respiratory system and non-respiratory tissue showed unremarkable or minimal changes that were not treatment related.
Time course of PCB distribution and elimination in rat tissue
Following an acute exposure to PCB vapor mixture, we determined all congener level and distribution profiles at 5 post-exposure time points. The total concentration of PCB congeners to which the animals were exposed was 2.4 mg/m3. Each rat was estimated to inhale 40 μg PCBs. PCB concentrations were in the same range in lung, liver, and adipose tissue, lower in brain and lowest in blood on the entire time course of 12 hr (Figure 3). The sum of total PCB congeners (ΣPCB) loaded in lung, liver, brain and blood started decaying immediately after exposure in a first-order fashion, while PCBs in adipose tissue accumulated before reaching a relatively steady concentration at 3 hr post exposure. The rate of elimination varied moderately among livers, lungs, brains and blood, with biological half-lives of ΣPCB increasing in the order of liver (5.6 hr) < lung (8.2 hr) < brain (8.5 hr) < blood (9.7 hr).
Figure 3.

Time course of ΣPCB and selected congener concentration in rat liver (A), lung (B), blood (C), adipose tissue (D) and brain (E) following 2 hr inhalation exposure.
Congeners that were found ≥ 10-fold higher in most exposed tissue samples compared to the background levels of sham/sentinel samples were considered to be reliably detected. Due to the relatively low concentrations in blood, congeners with ≥ 2-fold higher levels were also reported (Figure S1–S28). Detected congeners included mostly PCBs with mono- or di-ortho-substitution, ranging from mono- to pentachlorobiphenyls (PCB 6, 8, 15, 16, 17, 18+30, 20+28, 21+33, 22, 24, 25, 26+29, 31, 32, 37, 49+69, 52, 59, 60, 61+70+74+76, 64, 66, 77, 83, 99, 105, 112 and 118) yet the majority fell into tri- and tetrachlorobiphenyl categories (Figure 4). PCB 20+28 (Figure 3 and S2D) was most abundant in every tissue. Other prevailing congeners included PCB 8 and 21+33 in liver, adipose tissue and brain, PCB 15 in lung, PCB 31 and 66 in all tissues, PCB 49+69 in liver and PCB 52 in adipose tissue (Figure 3 and S2).
Figure 4.

Comparison of congener distribution profiles in: generated vapor mixture, and tissue load at different time points post exposure as sorted by mono-, di, tri-, tetra- and pentachlorobiphenyls. aAcute exposure (time course experiment), hours post exposure for tissue data. bSubacute exposure, hours post exposure for tissue data.
Biological half-lives were determined for every congener detected (Table S7). It was apparent that the time course pattern of elimination depended on the individual congener as well as the nature of target tissue. In liver the levels of lower chlorinated congeners decreased immediately after exposure with first-order kinetics as represented by PCB 21+33, while higher chlorinated PCBs exhibited a peak at 1 hr post exposure (PCB 60 and 105, Figure 3A), whereas in lung most congeners show a consistently decreasing trend on the entire time course (Figure 3B). Congeners behaved similarly in brain yet some relatively higher chlorinated congeners (PCB 52 and 118, Figure 3E) tended to show slight increase within 6 hr after exposure. Congeners in blood were generally eliminated less rapidly compared to the above tissues (Figure 3C). In adipose tissue, lower chlorinated PCBs increased rapidly during the first hour post exposure before reaching a plateau, while higher chlorinated congeners continued a slower increase after 1 hr (Figure 3D). The only congeners detected that have a TEF value were PCB 77, 105 and 118. The highest TEQ concentration was found in liver, with a peak at 1 hr after inhalation (Figure 5). TEQ concentration increased steadily in adipose tissue on the entire time course suggesting that inhalation exposure produced metabolic decrease of TEQ concentration in most tissues and sequestration into adipose tissue.
Figure 5.

Time course of total TEQ concentration change in rat liver, lung, blood, adipose tissue and brain following 2 hr inhalation exposure.
Discussion
As PCBs in the atmospheric environment contain predominantly the more volatile congeners, administration of commercial mixtures by feeding or injection cannot well represent realistic environmental exposures. We sought to create an inhalation exposure regimen that generates a complex mixture with a congener profile resembling the airshed of urban areas. We evaluated the efficacy of the system by establishing a model that predicts the theoretical concentration and distribution profile of the volatilized mixture (see the Supporting Information). The measured concentration in our acute exposure experiment (2.4 mg/m3) compared favorably with the model prediction of 2.6 mg/m3. The congener profiles also had a high degree of agreement (data not shown), evidently showing that there was no aerosolization in the process.
In comparison to the air mixture, it is evident that via inhalation, the majority of the material sequestered in the tissue shifted considerably from mono- and di- chlorinated PCBs to tri- and tetra- or even higher chlorinated biphenyls (Figure 4). One explanation was that most of the lower chlorinated compounds were rapidly metabolized and did not accumulate appreciably. Our time course study also showed this same shift; after exposure the proportion of higher chlorinated PCBs increased along with time in all tissue types, most markedly in organs with metabolic enzyme activity (i.e., liver, lung and brain) (Figure 4). The time course change of individual congener levels showed clearly that the differential elimination/accumulation rates led to a characteristic congener spectrum.
Most congeners showed biological half-lives of hours in tissues other than adipose tissue, with only a few exceptions in brain (Table S7). The half-lives reported in our study were shorter than those reported in the whole body of Wister rats dosed via the oral route (30). This is likely due to rapid uptake and distribution via inhalation. It has been recognized that PCB congeners with vicinal hydrogen substituents are subject to metabolism (31, 32). For non-dioxin like congeners, metabolic attack by cytochrome P450 proceeds faster if the open area is at adjacent meta and para positions (32). Therefore, those congeners generally have shorter half-lives. This structure-activity relationship could also be observed in our study, although the impact was less predominant since most lower chlorinated congeners have open m, p positions. Congeners with both para positions substituted appeared more persistent than those with at least one open para position in most type of tissue (Figure S2). However as an exception to the rule, PCB 52 was more persistent in brain than PCB 66 suggesting other factors besides metabolism contribute to the elimination of these compounds.
The less frequent detection and lower concentrations of lower-chlorinated congeners in human and animal tissues do not necessarily mean that the extent of exposure and uptake of these congeners are negligible, as suggested by their particularly short half-lives. Nevertheless, many congeners detected in our study have been detected repeatedly among the general population in biomonitoring studies as well as populations exposed to elevated PCB levels: PCBs 49+69, 52, 60, 66, 74, 81, 87, 99, 101, 105, and 118 in adult plasma (33–35); PCBs 28, 31, 52, 60, 64, 70, 74, 99, 105 and 118 in human adipose tissue (36–38); and PCBs 28, 66, 74, 99 and 118 in human breast milk and infant cord serum (39). Yet our study also provides basic information for organs that are less accessible. For instance, PCB 15 was found of high concentration in lung and PCB 52 appeared particularly persistent in brain (Figure S2).
Inhalation was a highly efficient route of exposure for uptake of atmospheric PCBs. The first-order kinetics of ΣPCB in most tissues indicates that PCBs gain rapid access to circulation via the lung and can be soon distributed into tissues. In contrast, oral administration is usually characterized by a delayed peak in tissue concentration hours after exposure (40). Following inhalation, the redistribution into adipose tissue and subsequent accumulation were observed. The slow rise in fatty tissue level was dwarfed by the rapid decline of PCBs in all other organs and blood suggesting that metabolism rather than enrichment in adipose tissue contributed primarily to the clearance of the inhaled PCBs. It was noteworthy that the higher chlorinated congeners accumulated in liver more than the same congeners in lung, whereas the levels of lower chlorinated ones were found consistently higher in the latter (Figure 4 and Table S4). In fact, this discrepancy between profiles in lung and liver was already noticeable at 12 hr post acute exposure even though they were very similar when exposure ended. Brain tissue was also preferentially taking up higher chlorinated congeners. One possible explanation was that the higher chlorinated congeners, which are generally more lipophilic, tend to stay in lipid-rich organs, the liver, brain and adipose tissue being main sites of their metabolism and storage rather than lung which was the route of entry.
The animals were exposed to a relatively high dose of PCBs, estimated from the inhaled concentration in air as 40 μg per rat. The amount of PCBs measured in the five tissues collected was 5 μg per rat. The calculation for the measured body burden (i.e. the sum of PCBs loaded at the end of exposure) based on the organ weights of lung, liver and brain, and the assumption that serum and adipose tissue respectively account for 3% of the total body mass (41), divided by the fractional body mass of these organs yields an estimated body burden of 33 μg per rat. The difference between the exposure and body burden can be ascribed to several plausible explanations: 1.) PCBs likely do not distribute equally to all organs and tissues (42); 2.) Excretion/metabolism during exposure time (3 hr) could contribute considerably to the loss; 3.) Exhalation of PCB vapor by animals was likely but not quantified.
TEQ concentrations were calculated to evaluate the potential toxicity of this inhalation exposure based on accumulated parent congeners in tissue. Among dioxin-like congeners, only PCBs 77, 105 and 118 were detected after 2 hr inhalation. As the exposure was prolonged, more dioxin-like congeners accumulated to reach the lower detection limit. The much higher TEQ concentration in liver than that in lung resulted primarily from the absence of PCB 126 in lung. A significant concentration change in liver was also seen shortly after acute exposure (Figure 5). We observed that these dioxin-like congeners accumulated in liver which would thus be susceptible to toxic effects from inhaled PCBs. Measurement of metabolites of the dioxin-like congeners would help to elucidate the true burden of this exposure. In this study, we did not observe any significant toxicity, neither histologic abnormalities in respiratory system or liver, non-inflammatory responses in the lung. However, it should be realized that the biological endpoints investigated in this study were relatively limited and the exposure periods were short. As the toxicological potential of lower chlorinated PCBs have been revealed and inhalation is shown to be a significant route of exposure to these compounds, new biological endpoints for inhalation exposure to airborne PCBs are needed as well as chronic exposure studies to address the question of disease from inhaled PCB mixtures.
Supplementary Material
Acknowledgments
This work was supported by NIEHS through grants NIH P42 ES013661 and NIH P30 ES05605. The authors thank Dr. Wanda Haschek-Hock for evaluating tissue for pathology and Paul Eastling for establishment of the PCB volatilization model.
Abbreviations
- ANOVA
analysis of variance
- BAL
bronchoalveolar lavage
- d-PCB 65
deuterium-labeled PCB 65
- eV
electron volt
- GC
gas chromatography, gas chromatograph
- LDH
lactate dehydrogenase
- l. w
lipid weight
- MS
mass spectrometry
- OPR
ongoing precision and recovery
- PCB
polychlorinated biphenyl
- TCDD
2,3,7,8-tetrachlorodibenzo-p-dioxin
- ΣPCB
sum of total PCB congeners, ng/g lipid weight
Footnotes
Brief: Inhalation of airborne PCBs contributed significantly to the body burden of lower chlorinated congeners in laboratory rats.
Supporting Information Available: Chemicals, extraction procedure, volatilization model, quality control; tables for quality assurance measures, congener uptake and immune response in subacutely exposed rat tissue, biological half-lives of detected congener in acutely exposed rat tissue; figures for rat weight gain, time course of congener concentration change in acutely exposed rat tissue.
Literature Cited
- 1.Herrick RF, McClean MD, Meeker JD, Baxter LK, Weymouth GA. An unrecognized source of PCB contamination in schools and other buildings. Environ Health Perspect. 2004;112:1051–1053. doi: 10.1289/ehp.6912. [DOI] [PMC free article] [PubMed] [Google Scholar]
- 2.Martinez A, Norstrom K, Wang K, Hornbuckle KC. Polychlorinated biphenyls in the surficial sediment of Indiana Harbor and Ship Canal, Lake Michigan. Environ Int. 2009 doi: 10.1016/j.envint.2009.01.015. [DOI] [PMC free article] [PubMed] [Google Scholar]
- 3.Hu D, Martinez A, Hornbuckle KC. Discovery of non-aroclor PCB (3,3′-dichlorobiphenyl) in Chicago air. Environ Sci Technol. 2008;42:7873–7877. doi: 10.1021/es801823r. [DOI] [PMC free article] [PubMed] [Google Scholar]
- 4.Schecter A, Colacino J, Haffner D, Patel K, Opel M, Päpke O, Birnbaum L. Perfluorinated Compounds, Polychlorinated Biphenyl, and Organochlorine Pesticide Contamination in Composite Food Samples from Dallas, Texas. Environ Health Perspect. 2010;118:796–802. doi: 10.1289/ehp.0901347. [DOI] [PMC free article] [PubMed] [Google Scholar]
- 5.Harrad S, Hazrati S, Ibarra C. Concentrations of Polychlorinated Biphenyls in Indoor Air and Polybrominated Diphenyl Ehters in Indoor Air and Dust in Birmingham, United Kingdom: Implications for Human Exposure. Environ Sci Technol. 2006;40:4633–4638. doi: 10.1021/es0609147. [DOI] [PubMed] [Google Scholar]
- 6.Wilson NK, Chuang JC, Lyu C. Levels of persistent organic pollutants in several child day care centers. J Expo Anal Env Epid. 2001;11:449–458. doi: 10.1038/sj.jea.7500190. [DOI] [PubMed] [Google Scholar]
- 7.Wethington DM, Hornbuckle KC. Milwaukee, WI, as a Source of Atmospheric PCBs to Lake Michigan. Environ Sci Technol. 2005;39:57–63. doi: 10.1021/es048902d. [DOI] [PubMed] [Google Scholar]
- 8.Sun P, Basu I, Blanchard P, Brice KA, Hites RA. Temporal and spatial trends of atmospheric polychlorinated biphenyl concentrations near the great lakes. Environ Sci Technol. 2007;41:1131–1136. doi: 10.1021/es061116j. [DOI] [PubMed] [Google Scholar]
- 9.Rudel RA, Perovich LJ. Endocrine disrupting chemicals in indoor and outdoor air. Atmos Environ. 2009;43:170–181. doi: 10.1016/j.atmosenv.2008.09.025. [DOI] [PMC free article] [PubMed] [Google Scholar]
- 10.Norström K, Czub G, McLachlan MS, Hu D, Thorne PS, Hornbuckle KC. External exposure and bioaccumulation of PCBs in humans living in a contaminated urban environment. Environ Int. 2009 doi: 10.1016/j.envint.2009.03.005. [DOI] [PMC free article] [PubMed] [Google Scholar]
- 11.Gabrio T, Piechotowski I, Wallenhorst T, Klett M, Cott L, Friebel P, Link B, Schwenk M. PCB-blood levels in teachers, working in PCB-contaminated schools. Chemosphere. 2000;40:1055–1062. doi: 10.1016/s0045-6535(99)00353-7. [DOI] [PubMed] [Google Scholar]
- 12.Liebl B, Schettgen T, Kerscher G, Broding HC, Otto A, Angerer J, Drexler H. Evidence for increased internal exposure to lower chlorinated polychlorinated biphenyls (PCB) in pupils attending a contaminated school. Int J Hyg Environ Health. 2004;207:315–324. doi: 10.1078/1438-4639-00296. [DOI] [PubMed] [Google Scholar]
- 13.Casey AC, Berger DF, Lombardo JP, Hunt A, Quimby F. Aroclor 1242 inhalation and ingestion by Sprague-Dawley rats. J Toxicol Environ Health A. 1999;56:311–342. doi: 10.1080/009841099158033. [DOI] [PubMed] [Google Scholar]
- 14.Espandiari P, Glauert HP, Lehmler HJ, Lee EY, Srinivasan C, Robertson LW. Polychlorinated biphenyls as initiators in liver carcinogenesis: resistant hepatocyte model. Toxicol Appl Pharmacol. 2003;186:55–62. doi: 10.1016/s0041-008x(02)00018-2. [DOI] [PubMed] [Google Scholar]
- 15.Lehmann L, Esch LH, Kirby AP, Robertson WL, Ludewig G. 4-monochlorobiphenyl (PCB3) induces mutations in the livers of transgenic Fisher 344 rats. Carcinogenesis. 2007;28:471–478. doi: 10.1093/carcin/bgl157. [DOI] [PubMed] [Google Scholar]
- 16.Pliskova M, Vondracek J, Canton RF, Nera J, Kocan A, Petrik J, Trnovec T, Sanderson T, van den Berg M, Machala M. Impact of polychlorinated biphenyls contamination on estrogenic activity in human male serum. Environ Health Perspect. 2005;113:1277–1284. doi: 10.1289/ehp.7745. [DOI] [PMC free article] [PubMed] [Google Scholar]
- 17.Cooke PS, Sato T, Buchannan DL. Disruption of steroid hormone signaling by PCBs. In: Robertson LW, Hansen LG, editors. PCBs: Recent Advances in Environmental Toxicology and Health Effects. Universtiy Press of Kentucky; Lexingto, KY: 2001. pp. 257–263. [Google Scholar]
- 18.Cheek AO, Kow K, Chen J, McLachlan JA. Potential mechanisms of thyroid disruption in humans: interaction of organochlorine compounds with thyroid receptor, transthyretin, and thyroid-binding globulin. Environ Health Perspect. 1999;107:273–278. doi: 10.1289/ehp.99107273. [DOI] [PMC free article] [PubMed] [Google Scholar]
- 19.Zettner MA, Flor S, Ludewig G, Wagner J, Robertson LW, Lehmann L. Quinoid metabolites of 4-monochlorobiphenyl induce gene mutations in cultured Chinese hamster v79 cells. Toxicol Sci. 2007;100:88–98. doi: 10.1093/toxsci/kfm204. [DOI] [PubMed] [Google Scholar]
- 20.U.S. Environmental Protection Agency. Method 1668, Revision A: Chlorinated Biphenyl Congeners in Water, Soil, Sediment, and Tissue by HRGC/HRMS. EPA; Washington, DC: 1999. EPA-821-R-00-002. [Google Scholar]
- 21.Thorne PS. Inhalation toxicology models of endotoxin- and bioaerosol-induced inflammation. Toxicology. 2000;152:13–23. doi: 10.1016/s0300-483x(00)00287-0. [DOI] [PubMed] [Google Scholar]
- 22.Kania-Korwel I, Shaikh NS, Hornbuckle KC, Robertson LW, Lehmler H. Enantioselective disposition of PCB 136 (2, 2′3, 3′6′6′-hexachlorobiphenyl) in C57BL/6 mice after oral intraperitoneal administration. Chirality. 2007;19:56–66. doi: 10.1002/chir.20342. [DOI] [PubMed] [Google Scholar]
- 23.Philips DL, Pirkle JL, Burse VW, Bernert JT, Henderson LO, Needham LL. Chlorinated hydrocarbon levels in human serum: effects of fasting and feeding. Arch Environ Contam Toxicol. 1989;18:495–500. doi: 10.1007/BF01055015. [DOI] [PubMed] [Google Scholar]
- 24.Hu D, Lehmler H, Martinez A, Wang K, Hornbuckle KC. Atmospheric PCB congeners across Chicago. Atmos Environ. 2010;44:1550–1557. doi: 10.1016/j.atmosenv.2010.01.006. [DOI] [PMC free article] [PubMed] [Google Scholar]
- 25.Thorne PS, Adamcakova-Dodd A, Kelly KM, O’neill ME, Duchaine C. Metalworking fluid with mycobacteria and endotoxin induces hypersensitivity pneumonitis in mice. Am J Respir Crit Care Med. 2006;173:759–768. doi: 10.1164/rccm.200405-627OC. [DOI] [PMC free article] [PubMed] [Google Scholar]
- 26.Hornung RW, Reed LD. Estimation of average concentration in the presence of nondetectable values. Appl Occup Environ Hyg. 1990;5:46–51. [Google Scholar]
- 27.Harkema JR, Carey SA, Wagner JG. The nose revisited: a brief review of the comparative structure, function, and toxicologic pathology of the nasal epithelium. Toxicol Pathol. 2006;34:252–269. doi: 10.1080/01926230600713475. [DOI] [PubMed] [Google Scholar]
- 28.Young JT. Light microscopic examination of the rat nasal passages: preparation and morphologic features. In: Barrow CS, editor. Toxicology of the Nasal Passages. Hemisphere Publishing Corp; New York: 1986. pp. 27–36. [Google Scholar]
- 29.Van den Berg M, Birnbaum LS, Denison M, De Vito M, Farland W, Feeley M, Fiedler Hea. The 2005 World Health Organization Reevaluation of Human and Mammalian Toxic Equivalency Factors for Dioxins and Dioxin-Like Compounds. Toxico Sci. 2005;93:223–241. doi: 10.1093/toxsci/kfl055. [DOI] [PMC free article] [PubMed] [Google Scholar]
- 30.Tanabe S, Nakagawa Y, Tatsukawa R. Absorption Efficiency and Biological Half-Life of Individual Chlorobiphenyls in Rats Treated with Kanechlor Products. Agric Biol Chem. 1981;45:717–726. [Google Scholar]
- 31.Chen PH, Luo ML. Comparative rates of elimination of some individual polychlorinated biphenyls from the blood of PCB-poisoned patients in Taiwan. Fd Chem Toxic. 1982;20:417–425. doi: 10.1016/s0278-6915(82)80107-5. [DOI] [PubMed] [Google Scholar]
- 32.Brown JF., Jr Determination of PCB Metabolic, Excretion, and Accumulation Rates for Use as Indicators of Biological Response and Relative Risk. Environ Sci Technol. 1994;28:2295–2305. doi: 10.1021/es00062a013. [DOI] [PubMed] [Google Scholar]
- 33.Minh TB, Watanabe M, Kajiwara N, Iwata H, Takahashi S, Subramanian A, Tanabe S, Watanabe S, Yamada T, Hata J. Human blood monitoring program in Japan: contamination and bioaccumulation of persistent organochlorines in Japanese residents. Arch Environ Contam Toxicol. 2006;51:296–313. doi: 10.1007/s00244-004-0251-5. [DOI] [PubMed] [Google Scholar]
- 34.Nichols BR, Hentz KL, Aylward L, Hays SM, Lamb JC. Age-specific Reference Ranges for Polychlorinated Biphenyls (PCB) Based on the NHANES 2001–2002 Survey. J Toxicol Environ Health–Part A. 2007;70:1873–1877. doi: 10.1080/15287390701457688. [DOI] [PubMed] [Google Scholar]
- 35.Dallaire R, Dewailly É, Pereg D, Dery S, Ayotte P. Thyroid function plasma concentrations of polyhalogenated compounds in Inuit adults. Environ Health Perspect. 2009;117:1380–1386. doi: 10.1289/ehp.0900633. [DOI] [PMC free article] [PubMed] [Google Scholar]
- 36.Johnson-Restrepo B, Kannan K, Rapaport DP, Rodan BD. Polybrominated diphenyl ethers and polychlorinated biphenyls in human adipose tissue from New York. Environ Sci Technol. 2005;39:5177–5182. doi: 10.1021/es050399x. [DOI] [PubMed] [Google Scholar]
- 37.Bergonzi R, Specchia C, Dinolfo M, Tomasi C, De Palma G, Frusca T, Apostoli P. Distribution of persistent organochlorine pollutants in maternal and foetal tissues: data from an Italian polluted urban area. Chemosphere. 2009;76:747–754. doi: 10.1016/j.chemosphere.2009.05.026. [DOI] [PubMed] [Google Scholar]
- 38.Tan J, Li QQ, Loganath A, Chong YS, Xiao M, Obbard JP. Multivariate data analyses of persistent organic pollutants in maternal adipose tissue in Singapore. Environ Sci Technol. 2008;42:2681–2687. doi: 10.1021/es7021363. [DOI] [PubMed] [Google Scholar]
- 39.Korrick SA, Altshul L. High breast milk levels of polychlorinated biphenyls (PCBs) among four women living adjacent to a PCB-contaminated waste site. Environ Health Perspect. 1998;106:513–518. doi: 10.1289/ehp.98106513. [DOI] [PMC free article] [PubMed] [Google Scholar]
- 40.Kania-Korwel I, El-Komy MHM, Veng-Pedersen P, Lehmler H. Clearance of Polychlorinated Biphenyl Atropisomers is Enantioselective in Female C57Bl/6 Mice. Environ Sci Technol. 2010;44:2828–2835. doi: 10.1021/es901781p. [DOI] [PMC free article] [PubMed] [Google Scholar]
- 41.Calder WA. Size, Function and Life History. Harvard University Press; Cambridge, MA: 1984. p. 24. [Google Scholar]
- 42.Kania-Korwel I, Hornbuckle KC, Robertson LW, Lehmler HJ. Dose-dependent enantiomeric enrichment of 2,2′,3,3′,6,6′-hexachlorobiphenyl in female mice. Environ Toxicol Chem. 2008;27:299–305. doi: 10.1897/07-359R.1. [DOI] [PubMed] [Google Scholar]
Associated Data
This section collects any data citations, data availability statements, or supplementary materials included in this article.