

Abstract
We describe a rapid method to accurately measure the cytotoxicity of mammalian cells upon exposure to various drugs. Using this assay, we obtain survival data in a fraction of the time required to perform the traditional clonogenic survival assay, considered the gold standard. The dynamic range of the assay allows sensitivity measurements on a multi-log scale allowing better resolution of comparative sensitivities. Moreover, the results obtained contain additional information on cell cycle effects of the drug treatment. Cell survival is obtained from a quantitative comparison of proliferation between drug-treated and untreated cells. During the assay, cells are treated with a drug and, following a recovery period, allowed to proliferate in the presence of BrdU. Cells that synthesize DNA in the presence of bromodeoxyuridine (BrdU) exhibit quenched Hoechst fluorescence easily detected by flow cytometry; quenching is used to determine relative proliferation in treated versus untreated cells. Finally, the multi-well setup of this assay allows the simultaneous screening of multiple cell lines, multiple doses, or multiple drugs to accurately measure cell survival and cell cycle changes after drug treatment.
Keywords: Clonogenic survival assay, cell cycle, flow cytometry
1. Introduction
Survival of cells upon exposure to toxic agents is an important phenotypic measure used to understand the biological importance of certain proteins and pathways in either preventing or enabling cell survival after toxic stress. For example, key proteins involved in DNA repair or the DNA damage response have been identified by measuring the effect of silencing or over-expressing these proteins on cell survival after DNA damage. The gold standard for assessing the survival of cells after drug treatment in such experiments continues to be the clonogenic survival assay that is extremely sensitive and has a dynamic range of several orders of magnitude. Unfortunately, it suffers from being very low throughput as well as time and labor intensive. Typically, the clonogenic survival assay takes 10-14 days and requires a large number of cell culture plates, thus limiting its practical application to a few cell lines and to a limited number of doses or agents. Moreover, for cell lines grown in suspension, or for those that fail to form colonies, the clonogenic survival assay is done by either monitoring growth from single cells or by following their ability to form colonies in soft agar. These approaches are even more time intensive taking up to 2-3 weeks to complete a single experiment. Currently, the only available high-throughput techniques for measuring sensitivity involve the correlation of viability to membrane permeability (trypan blue or propidium iodide exclusion) or measurement of metabolic activity (e.g. the MTT assay). Unfortunately, metabolic activity primarily reflects mitochondrial function; in addition changes in metabolic activity do not always correlate well with cell viability after treatment, and do not differentiate between cytotoxic and static effects after treatment. Similarly, membrane permeability only takes into account cells that undergo cell death after treatment and fails to identify sensitivity due to activation of a static program such as arrest or senescence [1]. Perhaps more importantly, these methods have an inherently limited dynamic range for detection of sensitivity, generally less than a single order of magnitude versus three or four orders of magnitude for the clonogenic survival assay.
In this paper, we describe a rapid method for measuring the drug sensitivity of cells with a dynamic range comparable to that of the clonogenic survival assay. This assay has a much higher throughput compared to traditional clonogenic survival assays. In addition to obtaining survival information, it can also be used to deduce cell cycle effects of drug treatment. This method is based on the fact that the fluorescence of Hoechst, a dye that preferentially binds AT-rich regions in the DNA, is quenched when bromodeoxyuridine (BrdU), a thymine analog, is incorporated into DNA [2, 3]. Cells that have divided zero, one or two times in the presence of BrdU can be differentiated based on the level of quenched Hoechst fluorescence, thus giving a measure of cell proliferation [4]. In a previous report, Poot et al. [5] took advantage of the Hoechst quenching property of BrdU to measure survival of cells after exposure to a DNA damaging agent. We have extensively modified the technique to be performed in a multi-well format (96-well plate for suspension cells and 24-well plate for adherent cells), drastically decreasing the setup time and reducing the number of cells required for a survival curve to as little as 106−3×10⁶ cells. Furthermore, we have broadened the scope of the assay so that it can simultaneously be used with different cell types and different cytotoxic agents. The assay can be completed within half the time taken to perform a clonogenic survival assay while maintaining high sensitivity and a dynamic range of three to four logs of magnitude.
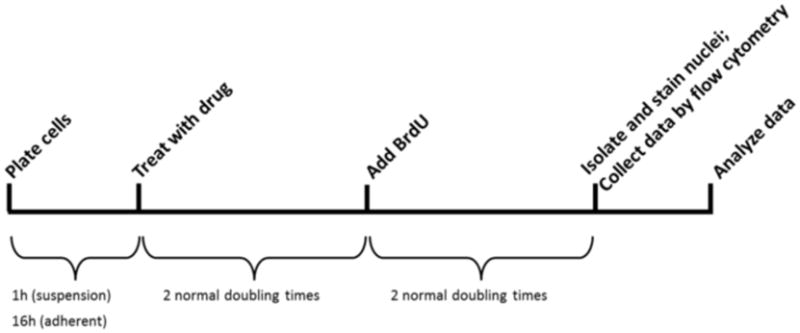
Figure 1 shows a concise representation of the steps involved in the assay. After cells are treated they are allowed to recover for the duration of two doubling times and subsequently allowed to proliferate (if they can) for the duration of another two doubling times in the presence of BrdU. To make our approach amenable to screening multiple agents with diverse mechanisms of action, we allow cells two doubling times after treatment for toxicity to present. This allows for simultaneous detection of the toxicity of agents that act immediately versus those that require formation of intermediates to slowly build up in cells. As an example, various DNA damaging agents are dependent on replication for toxicity to occur, and several days may need to pass prior to an observable phenotypic response. The duration of time prior to BrdU addition can be optimized depending on the agents to be tested. At the end of the assay, cells are gently lysed to obtain nuclei that are stained with propidium iodide (PI) and Hoechst dye. Nuclei fluorescence is measured by flow cytometry to quantify the percentage of cells that have proliferated in the presence of BrdU. The relative proliferation rate of treated samples compared to untreated controls gives a measure of the sensitivity of cells to treatment. The ease, economy and efficiency of this assay will enable rapid progress in systematic approaches to understanding the biological importance of many proteins and pathways whose modulation leads to an observed phenotype after exposure to cytotoxic agents.
Figure 1. Timeline of key steps in the experimental procedure.
2. Materials and Methods
2.1 Cell culture
The human lymphoblastoid cell lines TK6 [6] and TK6 derivatives (MT1 [7] and TK6+MGMT[8]) were grown in suspension in RPMI medium supplemented with 10% equine serum, 1% l-glutamine and 1% penicillin-streptomycin. TK6 and MT1 cell lines were derived from the same parent and both lack the DNA repair protein MGMT whereas the TK6+MGMT cell line contains reconstituted MGMT. A genetically diverse set of human lymphoblastoid suspension cell lines were obtained from the Coriell Institute for Medical Research and cultured in RPMI medium (Invitrogen) supplemented with 15% FBS, 1% penicillin-streptomycin and 1% L-glutamine. The cell lines were numbered 1-24 for ease of handling. The Coriell catalog numbers for the cell lines 1-24 are respectively, GM15029, GM13036, GM15215, GM15223, GM15245, GM15224, GM15236, GM15510, GM15213, GM15221, GM15227, GM15385, GM15590, GM15038, GM15056, GM15072, GM15144, GM15216, GM15226, GM15242, GM15268, GM15324, GM15386, GM15061. The adherent U87MG glioblastoma cell line was obtained from ATCC (Rockville, MD) and grown in DMEM medium supplemented with 10% fetal bovine serum, 1% l-glutamine and 1% penicillin-streptomycin.
2.2 Determining the optimal BrdU concentration
Cells are grown in the presence of different concentrations of BrdU (0-100μM) for one doubling time. Cells are then lysed and stained as described below with Hoechst and propidium iodide for flow cytometry analysis. The optimal BrdU dose is determined as that which quenched Hoechst fluorescence of G1 cells by half after one doubling time. This dose allows the effective resolution of cells that have undergone one division after BrdU addition from those that have undergone none or two divisions after addition. This optimal dose was determined as 45μM for the lymphoblastoid suspension cell lines and 20μM for the U87MG cell lines.
2.3 Cell cycle profile analysis by flow cytometry
BrdU is sometimes known to cause a G2/M arrest in cultured human cells. TK6, TK6 derivatives and U87MG cell lines were grown in the presence of the optimal BrdU concentration for at least two doubling times, during which samples were collected at multiple time points, washed with cold PBS and fixed overnight in cold 100% ethanol. Fixed cells were washed with PBS+1% BSA, resuspended in PBS+1%BSA containing propidium iodide (50μg/ml) and immediately analyzed by flow cytometry to obtain cell cycle profiles. None of the cell lines showed a G2/M arrest when grown in the presence of BrdU. If however such an arrest is observed, the effect can be overcome by adding deoxycytidine at an equal concentration as the added BrdU [3].
2.4 Drug treatment
Cell lines were treated in duplicate at multiple doses of BCNU from a 100mM stock solution in 100% ethanol. A maximum of six doses were assayed and therefore 12 wells accommodated duplicate exposures for each survival curve. Treatment was performed in serum free media for one hour, after which the drug was washed away and the cells were returned to fresh serum-containing media. This treatment scheme can be accommodated for cytotoxic agents that require longer exposure times as well as short-lived agents that do not require to be washed away after treatment. The drug treatment procedure is described below for both suspension and adherent cell lines.
Suspension cells
Before drug treatment, cells were grown to mid-log phase (6×10⁵ cells/ml for TK6 and its derivatives). 270μl of cells at a density of 4.5×10⁵ cells/ml were plated in each well of one row of a round-bottom 96-well plate. If multiple cell lines were assayed, each cell line was plated in one row of a 96-well plate in serum free media. The drug was diluted to 10× the final dose concentrations in serum free media in another 96-well plate. 30μl of the solution with 10× the desired dose was transferred to each well in the 96-well plate containing cells, after which the cells were incubated at 37°C for 1h. After 1h, cells were spun down at 1200rpm for 5min, drug-containing media was removed using a multi-channel pipette and the cells were washed with 200μl warm 1×PBS per well. The cells were then centrifuged and resuspended in 300μl of warm fresh media containing serum, transferred to a flat-bottom 96-well plate and incubated at 37°C for the duration of two normal doubling times. If the drug is not to be washed away, the experiment is set up in a flat-bottom 96-well plate at a density of 1.7×10⁵cells/ml in serum containing media, and the washing step is omitted.
Adherent cells
Before drug treatment, U87MG cells were grown to 80% confluence, washed with warm 1×PBS, trypsinized and diluted to 4×10⁴cells/ml. Due to the limited number of adherent cells that can attach to the wells in a 96-well plate, U87MG were treated in 24 well plate format. The rest of the assay is continued in a 96 well format, as described below, making sample processing and data collection faster and more efficient. 1ml of the diluted cells were plated in each well of a 24-well plate and cells were allowed to attach overnight at 37°C, 5% CO2. One such 24-well plate was set up for each cell line that was assayed. At the time of treatment, the cells were removed from the incubator and the media replaced with 900μl of warm, fresh serum-free media. The drug was diluted to 10× the final dose concentrations and 100μl of the 10× drug was added per well such that there were duplicate wells per dose and six doses including the untreated control. The cells were returned to the incubator for 1h after which the drug-containing media was replaced with warm serum-containing media. The cells were returned to the incubator for a period equivalent to two doubling times for normally growing cells.
2.5 Bromodeoxyuridine Addition
After allowing cells to recover for two doubling times after drug treatment, the cells are grown in the presence of BrdU for another two doubling times. The optimal BrdU concentration was determined to be 45μM for TK6 and its derivatives and 20μM for U87MG cells as described above. If BrdU concentration is greater than 20μM, then BrdU must be replenished every 12 hours. Therefore, after the first two doubling times, BrdU was added to TK6 and TK6 derivatives at a concentration of 45μM (from a 10mM stock solution) and replenished by simply adding BrdU to each well every 12 hours for the duration of two normal doubling times. Similarly BrdU was added to U87MG cells at a concentration of 20μM. Since cells become photosensitive upon BrdU addition, care must be taken to keep cells in the dark at all times post BrdU addition.
2.6 Nuclei isolation and staining for flow cytometry
At the end of four doubling times after drug treatment, cells were transferred to a v-bottom 96-well plate. For suspension cells, the cells were transferred directly to a v-bottom 96-well plate using a multi-channel pipette. For adherent cells, the cell plate was spun down at 1500rpm for 5min to pull down any unattached cells. The media was removed and replaced with 100μl of 0.25% trypsin EDTA. Trypsin was quenched with 200μl of serum-containing media and the cells from each well in the 24-well plate were transferred to individual wells of a v-bottom 96-well plate. Once transferred both cell types were spun down at 1500rpm for 5min, media was removed with a multi-channel pipette and cells were washed with cold 1×PBS. The cells were then resuspended in 300μl of 1× lysis/staining buffer (0.1M Tris HCl pH 7.5, 0.1% Igepal CA-60, 1mM CaCl2, 5mM MgCl2, 0.2%BSA (w/v), 1.2μg/ml Hoechst 33258 and 1×10⁴ chicken erythrocyte nuclei (CEN)/ml) and incubated on ice for 15 minutes after which 6μl of 200μg/ml propidium iodide was added to each well using a multi-channel pipette. Two wells containing only the lysis/staining buffer and propidium iodide are also prepared as blank controls. Samples were mixed well using a multi-channel pipette and analyzed on a BD LSR II flow cytometer equipped with a 96-well plate robot arm.
2.7 Data collection
Events were visualized on the side scatter vs. forward scatter plot to gate out debris (Figure 2A), and gated on the PI-height vs. PI-area plot to exclude doublets that fall below the diagonal (Figure 2B). 30,000 events that passed these two criteria were collected and viewed on a PI-Area vs. Hoechst-Area plot (Figure 2C). During data collection, the voltages for PI and Hoechst were adjusted to position CEN at the (30K, 30K) point to make subsequent data analysis easier.
Figure 2.
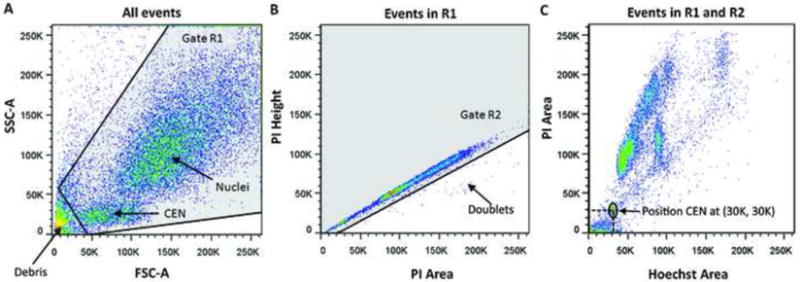
(A) Side scatter vs. forward scatter plot shows the position of nuclei, CEN and debris. All events in gate R1 are to be included in the data collection and analysis steps; (B) PI-Height vs. PI-Area plot shows the doublet events below the diagonal that must be excluded. Events in gate R2 are included in the data collection and analysis steps; (C) PI-Area vs. Hoechst-Area plot of events included in gates R1 and R2. PI and Hoechst channel voltages must be adjusted to position CEN at (30K, 30K) or any other practical coordinates for all samples.
3. Results
3.1 Detecting cells that have undergone zero, one or two cell divisions after drug treatment
BCNU is a DNA damaging agent commonly used in the clinic to treat glioblastoma despite the fact that it can have severe side effects on hematopoietic cells [9, 10]. We used the multi-well assay to test the BCNU sensitivity of the human lymphoblastoid cell lines TK6 and TK6 derivatives (MT1 and TK6+MGMT) that grow in suspension and the human U87MG glioblastoma cell line that grows attached. All data were analyzed using FlowJo (TreeStar Inc). For each cell line and drug dose, the debris and doublets were gated out as described in Figure 2. The remaining events were observed on a PI-Area vs. Hoechst-Area plot. Figure 3 delineates the regions corresponding to cells that are in the first, second or third cell cycle after treatment, recovery and incubation with BrdU. As seen in Figure 3A, Hoechst fluorescence of cells decreases as they replicate their DNA in the presence of BrdU. Therefore, as the cells replicate and divide, they move from the region labeled 1st cell cycle leftwards to the region labeled 2nd cell cycle, and so on. For each sample, gates were drawn as in Figure 3C and the number of events in each gate was determined.
Figure 3.
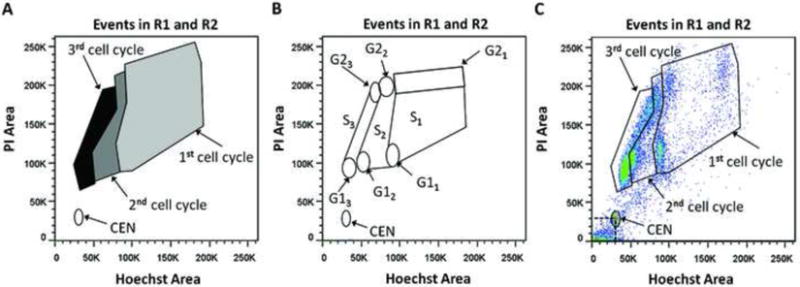
(A) PI-Area vs. Hoechst-Area plot showing the regions that would contain nuclei in the first cell cycle (CC1)- light grey, second cell cycle (CC2)- dark grey, third cell cycle (CC3) black; (B) Plot showing the G1, S and G2 populations for each cell cycle. G11, S1, G21 are G1, S and G2 in cell cycle 1 and so on; (C) Example of a sample for which the CEN and cell cycle gates have been drawn.
3.2 Calculating the fraction of proliferated cells after drug treatment
For each cell type and dose assayed, the number of events in each of the regions corresponding to the second and third cell cycle was used to calculate the number of proliferating cells in the sample as shown below in formula 1.
Formula 1
½*(#events in cell cycle 2/#CEN) + *(#events in cell cycle 3/#CEN)
The formula calculates the total number of cells that have divided after drug treatment by halving the number of cells in the second cell cycle (these cells have undergone one cell division) and dividing the number of cells in the third cell cycle by four (these cells have undergone two cell divisions). Since all samples of equal volume were spiked with the same number of CEN, the number of CEN counted per sample is proportional to the volume of sample used for flow cytometry data collection. Therefore the cell density of proliferating cells is calculated by dividing the total number of proliferating cells per sample by the number of CEN counted in that sample. Comparing the density of proliferated cells in a treated sample with that in an untreated sample gives the % control growth value that is used to plot a survival curve.
3.3 The multi-well assay has a large dynamic range, yielding log scale killing for suspension and adherent cell lines treated with a cytotoxic agent
BCNU's efficacy as a chemotherapeutic agent arises from its ability to generate extremely cytotoxic DNA inter-strand crosslinks [11]. DNA crosslinks are formed in a multistep process, the first of which is the formation of O6-chloroethylguanine lesions [12]. The O6-methylguanine methyl transferase (MGMT) protein is known to remove chloroethyl adducts from the O6 position of guanine [13, 14]. Thus, MGMT provides protection against BCNU-induced cytotoxicity, and cells lacking MGMT are particularly sensitive to this agent [15-17]. With this in mind, we used our multi-well assay to measure BCNU sensitivity of cell lines either lacking MGMT (TK6, MT1 and U87MG) or expressing MGMT (TK6+MGMT) to determine the range of sensitivity accurately measured by the assay.
BCNU sensitivity of suspension (TK6 and MT1) and adherent (U87MG) cell lines that each lack MGMT was measured using our multi-well assay. The TK6 and MT1 cell lines have previously been shown to be extremely BCNU sensitive using the clonogenic survival assay as shown in Figure 4A [8]. Results from the multi-well assay, shown in Figure 4B, are remarkably similar to those from the colony-forming assay. Additionally, we measured BCNU sensitivity of the TK6+MGMT cell line (the TK6 cell line reconstituted with MGMT) using the multi-well assay and found that TK6+MGMT cells show extreme resistance to BCNU, as expected (Figure 4B). We also tested the assay on adherent cells by measuring BCNU sensitivity of the adherent U87MG glioblastoma cell line that lacks MGMT [18]. Again, as expected the U87MG cells showed extreme BCNU sensitivity (Figure 4C), also with log-scale killing.
Figure 4.
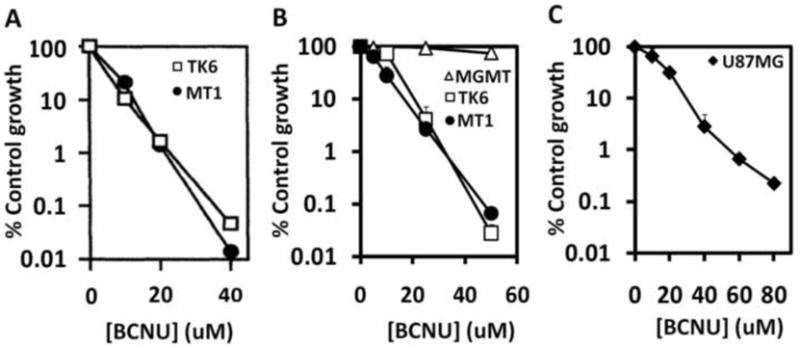
(A) Killing curves for BCNU treatment of TK6 and MT1 cell lines using the traditional clonogenic survival assay reproduced from [8]; (B) Killing curves for BCNU treatment of the TK6, MT1 and TK6+MGMT cell lines using the multi-well assay; (C) Killing curves for BCNU treatment of the U87MG cell line using the multi-well assay.
3.4 Measuring and comparing the cytotoxicity of BCNU in a multiple cell lines
Recent efforts in our group have focused on identifying the range of alkylation sensitivity in 24 lymphoblastoid cell lines derived from unrelated, healthy individuals of diverse ancestry [19]. This study demonstrated that cells derived from healthy individuals display an unexpectedly wide range of sensitivity to the alkylating agent N-methyl-N′-nitro-N-nitrosoguanidine (MNNG), a drug with a mechanism of action analogous to the cancer chemotherapy agent temozolomide. Temozolomide is frequently used in the treatment of certain brain cancers and lymphomas [20, 21]. This range in sensitivity has profound implications in the context of inter-individual differences in response to chemotherapy, with some patients demonstrating innate resistance or sensitivity to treatment. Here, we used our multi-well assay to assess the range in sensitivity of the same 24 genetically diverse lymphoblastoid cell lines to the chemotherapeutic agent BCNU. The cell lines were grown in suspension and assayed in a 96-well format as described. Cells were exposed to multiple doses of BCNU in biological triplicates to obtain the survival curves shown in Figure 5. The set of 24 genetically varied cell lines displayed a wide range of sensitivities, with survival measured over three orders of magnitude. From this study, we identified cell lines that had extreme sensitivity or resistance to BCNU, which have been used for further investigation of factors affecting BCNU sensitivity or resistance (Valiathan et. al. in preparation). The multi well assay described here allows for rapid screening of panels of cell lines for their sensitivity to a wide variety of cytotoxic agents. This information will aid in identifying mechanisms of resistance and sensitivity to commonly used cytotoxic chemotherapeutic agents.
Figure 5.
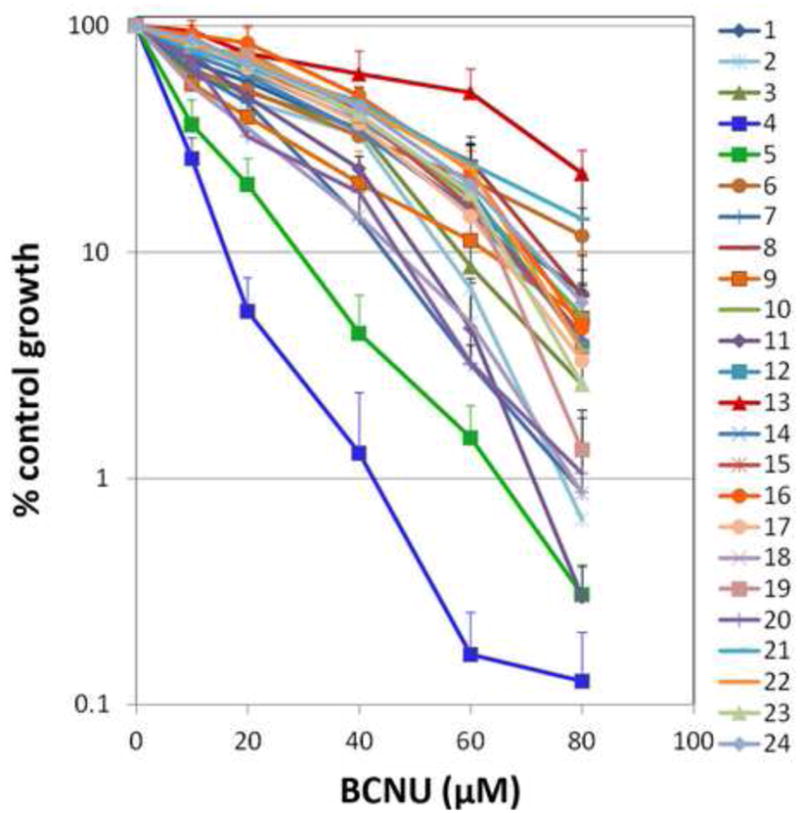
Survival curves for a panel of 24 genetically diverse lymphoblastoid cell lines exposed to multiple doses of BCNU (80, 60, 40, 20, 10 and 0μM). Cell lines are numbered from 1-24 and their corresponding catalog numbers are provided in the MATERIALS AND METHODS section. The mean of biological triplicates is shown and error bars denote the standard deviation from the mean.
3.5 The multi-well assay detects cell-cycle effects of drug treatment
Flow cytometry plots obtained using our assay for U87MG cells treated with BCNU show that with increasing doses of BCNU, there is not only a decrease in the total number of cells but that this decrease is also accompanied by a steady increase in the fraction of cells in late S and G2/M phase of the first cell cycle (Figure 6). From these observations we can conclude that at higher BCNU doses surviving cells are unable to divide during the BrdU pulse and remain in the region corresponding to the first cell cycle. Moreover, surviving cells are arrested at late S or G2/M for the entire duration after BrdU addition. A comparison of these results with previously published results is provided in the discussion below.
Figure 6.
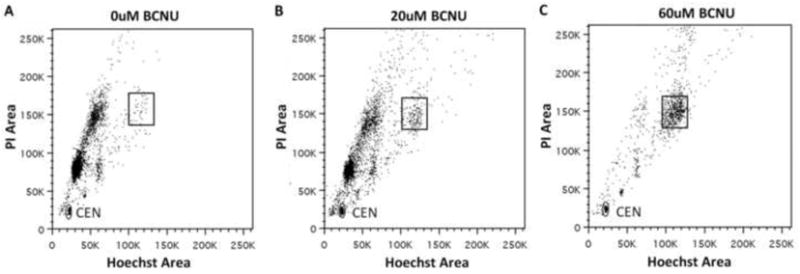
U87MG cells show increasing accumulation of cells in late S/G2 with increasing BCNU doses of 0μM, 20μM and 60μM (A, B and C respectively). The box in the figures marks the area corresponding to the late S/G2 region of the first cell cycle which has approximately double the value of Hoechst and PI fluorescence as compared to the region containing the G1 cells in the first cell cycle seen in panel A.
4. Discussion
The multi-well assay we describe here produces survival measurements on a multi-log scale comparable to the clonogenic survival assay. As described in the results section, BCNU sensitivities of the suspension cell lines TK6 and MT1 are remarkably similar to that measured by the clonogenic survival assay. Moreover, the TK6+MGMT cell line is identified as being resistant to BCNU treatment as expected [15, 17]. These results highlight three important aspects of our assay: i) The assay can measure sensitivity and resistance equally well, thus yielding accurate results that reflect those obtained from the clonogenic survival assay; ii) the multi-well assay is capable of measuring cell sensitivity on a multi-log scale, thus showing the large dynamic range the assay has in contrast to other available quick assays; iii) the assay can be used to measure cell survival of both suspension and adherent cell lines to cytotoxic agents, thus increasing its applicability.
The multi-well format of the assay has a reduced setup time allowing one to simultaneously assay either a large number of cell lines, doses or agents. This greatly improves cell survival measurement efficiency to yield results in a fraction of the time and in a less labor-intensive manner as compared to the clonogenic survival assay. As demonstrated, the assay enabled us to measure the sensitivity of a panel of 24 genetically diverse cell lines to multiple doses of BCNU in biological triplicates, and thus generate survival profiles for the panel of cell lines. The results showed a wide range of sensitivities across genetically diverse cell lines, enabling us to identify cell lines with extreme BCNU sensitivity or resistance for further study (Valiathan et. al. in preparation). In our previous study monitoring MNNG-sensitivity across the panel of 24 cell lines, growth measurements at one time point following exposure to one dose was used to assess sensitivity, and we observed only a 9-fold change in sensitivity from most sensitive to most resistant [22]. The approach described here, gave us the relative sensitivity of the cell lines to within three orders of magnitude, analogous to clonogenic survival assays, within a fraction of the time. Furthermore, comparing the most sensitive and most resistant cells lines from our previous studies with MNNG and the current study with BCNU, allows us to assess whether the sensitivity of cells to cytotoxic agents is specific to the class of cytotoxic agents used, or simply represents the response to cytotoxic damage in general. As an example, while cell line 6 was shown to be the most sensitive to MNNG in our previous report, this cell line clusters with the least sensitive cell lines after BCNU treatment. In contrast, cell line 4 appears to be among the most sensitive in both cases. The difference observed in cell line 6 may reflect differences in the ability to repair DNA interstrand crosslinks that are induced by BCNU but not by MNNG. Currently, we are investigating the mechanisms of BCNU resistance and sensitivity in the two most resistant and two most sensitive cell lines (Valiathan et. al. in preparation).
The ability to gather proliferation data from a small number of cells and with higher throughput, as compared to traditional clonogenic survival assays, has the potential to be used to measure the sensitivity of cell sub-populations that have previously proven difficult to analyze. Glioblastoma is both the most common and most malignant form of brain cancer. Despite aggressive therapy, this tumor frequently displays a resistant phenotype. A sub-population of cells, dubbed glioblastoma stem cells, have been hypothesized to contribute to this resistant phenotype [23, 24]. Glioblastoma stem cells are identified and enriched from primary tumor samples due to their ability to form suspended cell aggregates, termed neurospheres, in certain culture conditions [24]. The protocol described here would enable screening for compounds to target this resistant sub-population regardless of whether or not they can form colonies.
In addition to inducing cell death, many cytotoxic agents affect regular cell cycle progression, with cells undergoing arrest either in the G1, S or G2/M phases of the cell cycle. The nature of the arrest changes with the drug or cell line used, and provides insight into mechanisms of drug action and possible ways to modify cell sensitivity to a particular drug. The data obtained using our assay showed that the BCNU-induced decrease in surviving U87MG glioblastoma cells is accompanied by a concomitant arrest in late S/G2 phase of the cell cycle (Figure 6). Previous studies have shown that U87MG cells show an accumulation of cells in late S or G2/M after BCNU treatment [25] (assayed by PI staining and cell cycle profile analysis by flow-cytometry). Traditional clonogenic survival assays, as well as more recent high-throughput survival assays, yield no information on possible cell cycle arrest from the drug treatment. Any such cell cycle effects have been determined by separate experiments usually using flow cytometry. In comparison, results from the multi-well assay we describe here are rich in cell-cycle information, and provide added insight into the long-term cell cycle effects of the drug treatment.
In conclusion, we have presented a rapid and efficient method that takes advantage of current flow cytometry technology and properties of proliferating cells to measure the sensitivity of both suspension and adherent cells to cytotoxic agents. The flexibility of the method, its large dynamic range and its broad applicability makes it a powerful tool with great potential in many different applications including both small and large scale screening of sensitivity of numerous cell lines to known or suspected toxic agents.
Highlights.
A rapid FACS based survival assay
Sensitivity as a function of quenched Hoechst fluorescence by BrdU incorporation
Method allows for simultaneous detection of cell cycle effects after drug treatment
Acknowledgments
The authors would like to thank Dr. John Silber of the University of Washington for useful comments in the preparation of this manuscript. This work was supported by the National Institute of Health [U54-CA112967, R01-CA055042, P30-ES002109 and P30-CA014051]. LDS is an American Cancer Society Professor and CV was supported by a Merck-MIT graduate fellowship.
Abbreviations
- PI
propidium iodide
- CEN
chicken erythrocyte nuclei
- BCNU
1,3-bis(2-chloroethyl)-1-nitrosourea
Footnotes
Conflict of Interest Statement: The authors declare that there are no conflicts of interest.
Publisher's Disclaimer: This is a PDF file of an unedited manuscript that has been accepted for publication. As a service to our customers we are providing this early version of the manuscript. The manuscript will undergo copyediting, typesetting, and review of the resulting proof before it is published in its final citable form. Please note that during the production process errors may be discovered which could affect the content, and all legal disclaimers that apply to the journal pertain.
Contributor Information
Chandni Valiathan, Email: chandni@mit.edu, Computational and Systems Biology Program, Koch Institute for Integrative Cancer Research and Center for Environmental Health Sciences, Massachusetts Institute of Technology, Cambridge, MA, USA.
Jose L. McFaline, Email: jose_mc@mit.edu, Department of Biology, Koch Institute for Integrative Cancer Research and Center for Environmental Health Sciences, Massachusetts Institute of Technology, Cambridge, MA, USA.
References
- 1.Nikkhah G, Tonn JC, Hoffmann O, Kraemer HP, Darling JL, Schachenmayr W, Schonmayr R. The MTT assay for chemosensitivity testing of human tumors of the central nervous system. Part II: Evaluation of patient- and drug-specific variables. J Neurooncol. 1992;13:13–24. doi: 10.1007/BF00172942. [DOI] [PubMed] [Google Scholar]
- 2.Rabinovitch PS, Kubbies M, Chen YC, Schindler D, Hoehn H. BrdU-Hoechst flow cytometry: a unique tool for quantitative cell cycle analysis. Exp Cell Res. 1988;174:309–318. doi: 10.1016/0014-4827(88)90302-3. [DOI] [PubMed] [Google Scholar]
- 3.Poot M, Hoehn H, Kubbies M, Grossmann A, Chen Y, Rabinovitch PS. Cell-cycle analysis using continuous bromodeoxyuridine labeling and Hoechst 33358-ethidium bromide bivariate flow cytometry. Methods Cell Biol. 1994;41:327–340. doi: 10.1016/s0091-679x(08)61726-4. [DOI] [PubMed] [Google Scholar]
- 4.Ormerod MG, Kubbies M. Cell cycle analysis of asynchronous cell populations by flow cytometry using bromodeoxyuridine label and Hoechst-propidium iodide stain. Cytometry. 1992;13:678–685. doi: 10.1002/cyto.990130703. [DOI] [PubMed] [Google Scholar]
- 5.Poot M, Silber JR, Rabinovitch PS. A novel flow cytometric technique for drug cytotoxicity gives results comparable to colony-forming assays. Cytometry. 2002;48:1–5. doi: 10.1002/cyto.10101. [DOI] [PubMed] [Google Scholar]
- 6.Skopek TR, Liber HL, Penman BW, Thilly WG. Isolation of a human lymphoblastoid line heterozygous at the thymidine kinase locus: possibility for a rapid human cell mutation assay. Biochem Biophys Res Commun. 1978;84:411–416. doi: 10.1016/0006-291x(78)90185-7. [DOI] [PubMed] [Google Scholar]
- 7.Goldmacher VS, Cuzick RA, Jr, Thilly WG. Isolation and partial characterization of human cell mutants differing in sensitivity to killing and mutation by methylnitrosourea and N-methyl-N′-nitro-N-nitrosoguanidine. J Biol Chem. 1986;261:12462–12471. [PubMed] [Google Scholar]
- 8.Hickman MJ, Samson LD. Role of DNA mismatch repair and p53 in signaling induction of apoptosis by alkylating agents. Proc Natl Acad Sci U S A. 1999;96:10764–10769. doi: 10.1073/pnas.96.19.10764. [DOI] [PMC free article] [PubMed] [Google Scholar]
- 9.Durando X, Lemaire JJ, Tortochaux J, Van-Praagh I, Kwiatkowski F, Vincent C, Bailly C, Verrelle P, Irthum B, Chazal J, Bay JO. High-dose BCNU followed by autologous hematopoietic stem cell transplantation in supratentorial high-grade malignant gliomas: a retrospective analysis of 114 patients. Bone Marrow Transplant. 2003;31:559–564. doi: 10.1038/sj.bmt.1703889. [DOI] [PubMed] [Google Scholar]
- 10.Hochberg FH, Parker LM, Takvorian T, Canellos GP, Zervas NT. High-dose BCNU with autologous bone marrow rescue for recurrent glioblastoma multiforme. J Neurosurg. 1981;54:455–460. doi: 10.3171/jns.1981.54.4.0455. [DOI] [PubMed] [Google Scholar]
- 11.Gonzaga PE, Potter PM, Niu TQ, Yu D, Ludlum DB, Rafferty JA, Margison GP, Brent TP. Identification of the cross-link between human O6-methylguanine-DNA methyltransferase and chloroethylnitrosourea-treated DNA. Cancer Res. 1992;52:6052–6058. [PubMed] [Google Scholar]
- 12.Tong WP, Kirk MC, Ludlum DB. Formation of the cross-link 1-[N3-deoxycytidyl),2-[N1-deoxyguanosinyl]ethane in DNA treated with N,N′-bis(2-chloroethyl)-N-nitrosourea. Cancer Res. 1982;42:3102–3105. [PubMed] [Google Scholar]
- 13.Kaina B, Fritz G, Mitra S, Coquerelle T. Transfection and expression of human O6-methylguanine-DNA methyltransferase (MGMT) cDNA in Chinese hamster cells: the role of MGMT in protection against the genotoxic effects of alkylating agents. Carcinogenesis. 1991;12:1857–1867. doi: 10.1093/carcin/12.10.1857. [DOI] [PubMed] [Google Scholar]
- 14.Gerson SL. MGMT: its role in cancer aetiology and cancer therapeutics. Nat Rev Cancer. 2004;4:296–307. doi: 10.1038/nrc1319. [DOI] [PubMed] [Google Scholar]
- 15.Maze R, Carney JP, Kelley MR, Glassner BJ, Williams DA, Samson L. Increasing DNA repair methyltransferase levels via bone marrow stem cell transduction rescues mice from the toxic effects of 1,3-bis(2-chloroethyl)-1-nitrosourea, a chemotherapeutic alkylating agent. Proc Natl Acad Sci U S A. 1996;93:206–210. doi: 10.1073/pnas.93.1.206. [DOI] [PMC free article] [PubMed] [Google Scholar]
- 16.Meikrantz W, Bergom MA, Memisoglu A, Samson L. O6-alkylguanine DNA lesions trigger apoptosis. Carcinogenesis. 1998;19:369–372. doi: 10.1093/carcin/19.2.369. [DOI] [PubMed] [Google Scholar]
- 17.Wu M, Kelley MR, Hansen WK, Martin WJ., 2nd Reduction of BCNU toxicity to lung cells by high-level expression of O(6)-methylguanine-DNA methyltransferase. Am J Physiol Lung Cell Mol Physiol. 2001;280:L755–761. doi: 10.1152/ajplung.2001.280.4.L755. [DOI] [PubMed] [Google Scholar]
- 18.Roos WP, Batista LF, Naumann SC, Wick W, Weller M, Menck CF, Kaina B. Apoptosis in malignant glioma cells triggered by the temozolomide-induced DNA lesion O6-methylguanine. Oncogene. 2007;26:186–197. doi: 10.1038/sj.onc.1209785. [DOI] [PubMed] [Google Scholar]
- 19.Fry RC, Svensson JP, Valiathan C, Wang E, Hogan BJ, Bhattacharya S, Bugni JM, Whittaker CA, Samson LD. Genomic predictors of interindividual differences in response to DNA damaging agents. Genes Dev. 2008;22:2621–2626. doi: 10.1101/gad.1688508. [DOI] [PMC free article] [PubMed] [Google Scholar]
- 20.Wong ET, Tishler R, Barron L, Wu JK. Immunochemotherapy with rituximab and temozolomide for central nervous system lymphomas. Cancer. 2004;101:139–145. doi: 10.1002/cncr.20339. [DOI] [PubMed] [Google Scholar]
- 21.Stupp R, Mason WP, van den Bent MJ, Weller M, Fisher B, Taphoorn MJ, Belanger K, Brandes AA, Marosi C, Bogdahn U, Curschmann J, Janzer RC, Ludwin SK, Gorlia T, Allgeier A, Lacombe D, Cairncross JG, Eisenhauer E, Mirimanoff RO. Radiotherapy plus concomitant and adjuvant temozolomide for glioblastoma. N Engl J Med. 2005;352:987–996. doi: 10.1056/NEJMoa043330. [DOI] [PubMed] [Google Scholar]
- 22.Fry RC, Navasumrit P, Valiathan C, Svensson JP, Hogan BJ, Luo M, Bhattacharya S, Kandjanapa K, Soontararuks S, Nookabkaew S, Mahidol C, Ruchirawat M, Samson LD. Activation of inflammation/NF-kappaB signaling in infants born to arsenic-exposed mothers. PLoS Genet. 2007;3:e207. doi: 10.1371/journal.pgen.0030207. [DOI] [PMC free article] [PubMed] [Google Scholar]
- 23.Sanai N, Alvarez-Buylla A, Berger MS. Neural stem cells and the origin of gliomas. N Engl J Med. 2005;353:811–822. doi: 10.1056/NEJMra043666. [DOI] [PubMed] [Google Scholar]
- 24.Bleau AM, Hambardzumyan D, Ozawa T, Fomchenko EI, Huse JT, Brennan CW, Holland EC. PTEN/PI3K/Akt pathway regulates the side population phenotype and ABCG2 activity in glioma tumor stem-like cells. Cell Stem Cell. 2009;4:226–235. doi: 10.1016/j.stem.2009.01.007. [DOI] [PMC free article] [PubMed] [Google Scholar]
- 25.Xu GW, Mymryk JS, Cairncross JG. Pharmaceutical-mediated inactivation of p53 sensitizes U87MG glioma cells to BCNU and temozolomide. Int J Cancer. 2005;116:187–192. doi: 10.1002/ijc.21071. [DOI] [PubMed] [Google Scholar]