Abstract
To optimize the development of stem cell (SC)–based therapies for the treatment of glioblastoma (GBM), we compared the pathotropism of 2 SC sources, human mesenchymal stem cells (hMSCs) and fetal neural stem cells (fNSCs), toward 2 orthotopic GBM models, circumscribed U87vIII and highly infiltrative GBM26. High resolution and contrast-enhanced (CE) magnetic resonance imaging (MRI) were performed at 14.1Tesla to longitudinally monitor the in vivo location of hMSCs and fNSCs labeled with the same amount of micron-size particles of iron oxide (MPIO). To assess pathotropism, SCs were injected in the contralateral hemisphere of U87vIII tumor-bearing mice. Both MPIO-labeled SC types exhibited tropism to tumors, first localizing at the tumor edges, then in the tumor masses. MPIO-labeled hMSCs and fNSCs were also injected intratumorally in mice with U87vIII or GBM26 tumors to assess their biodistribution. Both SC types distributed throughout the tumor in both GBM models. Of interest, in the U87vIII model, areas of hyposignal colocalized first with the enhancing regions (ie, regions of high vascular permeability), consistent with SC tropism to vascular endothelial growth factor. In the GBM26 model, no rim of hyposignal was observed, consistent with the infiltrative nature of this tumor. Quantitative analysis of the index of dispersion confirmed that both MPIO-labeled SC types longitudinally distribute inside the tumor masses after intratumoral injection. Histological studies confirmed the MRI results. In summary, our results indicate that hMSCs and fNSCs exhibit similar properties regarding tumor tropism and intratumoral dissemination, highlighting the potential of these 2 SC sources as adequate candidates for SC-based therapies.
Keywords: glioblastoma, MPIO, stem cell tracking, tropism
Glioblastoma (GBM) is the most common and aggressive type of primary brain tumor in young adults.1,2 Despite advances in surgical resection, radiotherapy, and chemotherapy, the median survival among patients with newly diagnosed GBM remains less than 15 months.3–7 This poor clinical outcome is associated with the highly diffuse, infiltrative, and invasive nature of GBM. Tumor cells are commonly disseminated as microsatellites in normal brain parenchyma some distance away from the primary tumor mass. This prevents complete surgical resection, limits the role of radiotherapy, and leads to recurrence. As a consequence, innovative treatments that effectively and specifically target GBM tumor cells and spare normal brain tissue are critically needed to improve patient outcomes.
An interesting property of stem cells (SCs) is their inherent in vivo tropism for pathology in the adult brain,8 including toward primary9–13 and metastatic14,15 neoplasms and toward GBM.9,16 Consequently, over the past decade, SCs have been studied as promising vehicles to deliver therapeutic agents in situ because they provide unprecedented specificity and coverage of the whole tumor, including tumor microsatellites. In the case of gliomas, several SC sources, including human fetal neural stem cells (fNSCs) and human mesenchymal stem cells (hMSCs), have been studied as potential vehicles for the delivery of numerous therapeutic drugs.17 Several preclinical studies recently showed that antitumor therapies using SCs engineered to deliver tumoricidal products with either immunomodulatory, anti-mitotic, pro-apoptotic, pro-necrotic, or viral oncolytic therapies result in a significant decrease in tumor burden and improved survival in numerous animal models.11,12,14–21 These promising results have led to translational applications of SC-based therapies. A phase I clinical trial for patients with recurrent high-grade gliomas is currently under way, and similar studies are likely to follow.22
To develop and evaluate SC-based therapies for GBM, neuroimaging techniques for longitudinal and noninvasive monitoring of SC migration and distribution are crucial. One interesting approach for noninvasive cell tracking in vivo consists of labeling the cells with superparamagnetic iron oxide particles and following the migration of these cells using magnetic resonance imaging (MRI).23–26 Superparamagnetic particles of iron oxide (SPIO), ultrasmall SPIO (USPIO), and micron-sized particles of iron oxide (MPIO) have all been used for this purpose. Because of the difference in the magnetic susceptibility of the labeled cells and the surrounding tissue, cells labeled with iron oxide particles appear as dark areas of hyposignal on T2- or T2*-weighted (T2*-w) MR images and can consequently be longitudinally tracked.
In this high field (14.1Tesla) study, high resolution and contrast-enhanced (CE) MRI were combined to characterize the migration of 2 different MPIO-labeled SC sources, hMSCs and fNSCs, toward 2 different GBM tumor models, 1 highly neoangiogenic and circumscribed (U87vIII) and 1 poorly neoangiogenic and highly invasive (GBM26). Our goal was to monitor SC pathotropism and biodistribution longitudinally in vivo to provide insight regarding the potential of each of the 2 SC sources as candidates for SC-based therapies.
Materials and Methods
Cell Culture
All cell culture materials were purchased from Invitrogen Corporation (Carlsbad) unless specified otherwise.
hMSCs (San Bio) were cultured in α-modified minimum essential medium (αMEM) supplemented with 10% heat-inactivated fetal bovine serum (FBS), 1% glutamine, 1% Fungizone, and 1% Penstrep (doubling time, 3–5 days). fNSCs were kindly provided by Dr. Evan Snyder (Burnham Medical Center Institute, La Jolla, CA). These cells were cultured in vitamin A-free neurobasal medium supplemented with 1% B27, 1% glutamine, 8 μg mL−1 heparin (Sigma Aldrich), 20 ng mL−1 basic fibroblast growth factor (bFGF; Millipore), 10 ng mL−1 leukemia inhibitory factor (LIF; Millipore), and 100 μg mL−1 Normocin (Invivogen; doubling time, 5–7 days).
U87vIII cancer cells (epidermal growth factor receptor [EGFR] overexpressing GBM cell line) were cultured in Dulbecco's modified Eagle medium (DMEM) supplemented with 10% heat-inactivated FBS, 1% nonessential amino acids (NEAA), 1% Fungizone, and 1% Penstrep. Their doubling time was approximately 36 h. GBM26 cells were obtained from subcutaneous (sc) tumors consecutively passaged in mice flanks, to maintain the tumorigenicity of the xenograft. On the day of intracranial (ic) tumor cell injection, GBM26 xenograft tumor was resected, dissociated to single cell preparation using standard techniques, and injected immediately.27 All cell lines in culture were maintained as exponentially growing monolayers at 37°C in a humidified atmosphere consisting of 95% air and 5% CO2.
MPIO Labeling of Stem Cells
hMSCs and fNSCs were labeled with 1.63 μm diameter encapsulated microspheres (MPIO) tagged with the Dragon Green fluorophore (λ = 480–520 nm; Bangs Laboratories) using a previously described protocol.28,29 To obtain the same level of MPIO labeling for the 2 SC sources, several incubation times were tested (2, 6, 12, and 24 h). For each incubation time, the level of MPIO labeling was estimated by measurement of the fluorescence of 1 × 10⁶ MPIO-labeled cells using a fluorescence plate reader ( 4 per SC type, dilution in 200 μL of PBS). For each SC type, this level was compared with a fluorescence scale determined from 9 concentrations of free MPIO (v = 200 μL in PBS, 4 per concentration).
For ic injections, 70%–80% confluent cells were washed 4 times with PBS to completely remove MPIO not taken up by cells, as evaluated by fluorescence microscopy (data not shown). Cells were harvested by trypsinization, counted, and resuspended in medium to a final concentration of 1 × 10⁶ cells per 3 μL. The amount of MPIO in 1 × 10⁶ cells was measured prior to ic injection using a fluorescence spectrophotometer.
Fluorescence Imaging
For both cell lines, confocal fluorescence microscopy of the Dragon Green fluorophore (λEx/λEm= 480/520 nm) was used to confirm MPIO cytoplasmic localization. Cells were seeded on Permanox Lab-Tek tissue culture slides (Fisher Scientific; n = 4), grown to 70%–80% confluence, labeled by incubation,28 and washed 4 times with PBS. Fluorescence microscopy showed that 4 washes were necessary to remove all free MPIO from the medium. For microscopy, cells were colabeled with Hoechst stain (Fisher Scientific) using a standard protocol28 right before confocal and imaging was performed on the UCSF Nikon Imaging Center Olympus BX60 microscope.
Intracranial Injection of Tumor Cells
All animal research was approved by the Institutional Animal Care and Use Committee of the University of California, San Francisco. A total of 24 5-week-old female athymic mice (median weight, 25 g; Nu/Nu; Simonsen Laboratories) were used in this study. Animals were housed and fed under aseptic conditions. An hour before starting the ic injection, U87vIII or GBM26 cells were washed once with PBS, harvested by trypsinization, counted, and resuspended in serum-free McCoy's medium. For ic injection, animals were anesthetized using an intraperitoneal (ip) injection of ketamine and xylazine (100/20 mg kg−1 resp.). Suspensions of U87vIII cells (n = 18) or GBM26 cells (n = 6) (∼3 × 10⁵ in 3 μL) were injected into the right caudate-putamen of the mouse brain using the free hand technique.30,31 Buprenorphine was injected sc right before injection of tumor cells for optimal pain management (0.05 mg kg−1, v = 100 μL).
Intracranial Injection of MPIO-Labeled Stem Cells
After 9 ± 1 days U87vIII tumor-bearing mice were injected with MPIO-labeled hMSCs or MPIO-labeled fNSCs (∼1 × 10⁶ in 3 μL) either directly inside the tumor (n = 6 MPIO-labeled hMSCs, n = 6 MPIO-labeled fNSCs) or in the contralateral hemisphere (n = 3 MPIO-labeled hMSCs, n = 3 MPIO-labeled fNSCs), according to a protocol similar to tumor cell injections. After 18 days GBM26 tumor-bearing mice were injected with MPIO-labeled hMSCs (n = 3) or MPIO-labeled fNSCs (n = 3; ∼1 × 10⁶ in 3 μL) directly inside the tumor using the same protocol.
Animal Handling During MR Acquisitions
Prior to each experiment, animals were anesthetized using a mixture of isoflurane in O2 (3%, 1.5 L min−1), then placed on an electric heating pad and maintained under anesthesia using a nose cone (1%–2% isoflurane in O2; 1.5 L min−1). A 27G catheter was placed and secured into the tail vein of the animals to allow for intravenous (iv) injection of contrast agent. Mice were then placed in a custom-made cradle allowing positioning of the brain in the center of the RF coil and in the center of the magnet. An air-heating system was used to maintain stable body temperature throughout the imaging session.
MR System and Data Acquisition
Experiments were performed on a 14.1Tesla wide bore vertical system (ØI= 55 mm) equipped with 100 G cm−1 imaging gradients (Agilent Technologies). Shimming and MRI were performed using an Agilent millipede 1H coil (ØI= 40 mm, 5 cm length).
To measure the R1 and R2* relaxivities of MPIO at 14.1Tesla, a phantom consisting of 5 tubes with variable concentrations of MPIO in 2% agarose was designed (vtube= 500 μL; MPIO concentrations 0/0.02/0.06/0.1/0.2 mg mL−1). Axial T1 map of the phantom was derived from a single slice inversion-recovery spin echo sequence (IR-SE) at 8 variable inversion times. Axial T2* map of the phantom was derived from a single slice spin echo sequence (SE) at 7 variable echo times. The values of the transverse relaxivity R2* and spin-lattice longitudinal relaxivity R1 were found to be: R2* = 1427 s−1 mM−1, R1 = 10.6 s−1 mM−1.
Because of the difference in growth rate of the U87vIII and GBM26 tumors, the imaging time points were different for the 2 groups. In the case of U87vIII tumor-bearing animals, each animal underwent 3 MR sessions on days 0 (day of MPIO-labeled SCs injection), 2, and 7. For GBM26-bearing animals, MR sessions were on days 0, 4, 7, 11, 14, 18, 22, 29, and 32.
For all sessions, mice were anesthetized using isoflurane (3% in O2, 1.5 L min−1) and positioned in the magnet using a custom built cradle. An optimized gradient echo (GE) sequence was used for T2*-weighted (T2*-w) high resolution MRI of the MPIO-labeled SC distribution (TE/TR = 3.8/170 ms, matrix 256 × 256, FOV = 19.2 × 19.2 mm, 75 μm in-plane resolution, 200 μm slice thickness, 20 slices, NT = 40, Tacq = 29 min). Anatomical landmarks were used to insure the reproducibility of slice positioning between MR sessions. At the end of the last imaging session (d7 for U87vIII tumor-bearing animals, d32 for GBM26 tumor-bearing animals), CE MRI was performed in addition to high resolution MRI to confirm the location of the tumor, which was expected to enhance because of its permeable vasculature. In brief, a bolus dose of Magnevist (4 µmol/kg in 200 µL of PBS; Bayer Healthcare) was injected through the 27G catheter secured in the tail vein of the animal, and a GE sequence using the same slice orientation as high resolution imaging was used to image tumor enhancement (TE/TR = 1.31/37 ms, FOV = 19.2 × 19.2 mm, matrix 128 × 128, slice thickness = 1 mm, NT = 10, Tacq = 47 s). All high-resolution GE data sets were zero-filled to 512 × 512 and all CE data sets to 256 × 256.
Post-Processing of MR Data
A quantitative analysis of the variance-to-mean ratio, also known as index of dispersion (ID), was performed to evaluate the biodistribution of MPIO-labeled hMSCs and fNSCs in the tumor tissue as a function of time after injection. To that end, manual segmentation of a region-of-interest (ROI) including the whole brain was performed on 1 T2*-w MR axial image corresponding to an axial slice located 1 mm posterior to the injection site. For each SC line, the ID was evaluated for each imaging day i (di) as follows:
 |
where σ2(ROI) is the variance of the signal from the ROI and μ(ROI) the mean value of the signal from the ROI. For each SC type, the  at each time point di was expressed as a percentage of the corresponding value at day 0, as follows:
 |
For each SC type and each tumor type, the index of dispersion  was then averaged over the animals (n = 6 for U87vIII and n = 3 for GBM26) for each imaging time point di.
Immunohistochemistry (IHC) and Immunofluorescence (IF)
At the end of the last imaging session (day 7 for U87vIII tumor-bearing animals and day 32 for GBM26 tumor-bearing animals), animals were euthanized and the brains resected and fixed according to 1 of the 2 following protocols: (1) for IHC, brains were resected, fixed in 10% buffered Zn-Formalin and embedded in paraffin, or (2) for IF, brains were fixed by intraventricular perfusion of a mixture of 4% buffered Zn-formalin and 4% sucrose in saline, resected, cryoprotected using an increasing sucrose gradient (4/10/30% at 4°C), and OCT embedded.
All fixed brains were then sectioned along the imaging plane and stained as follows: Prussian Blue (PB), EGFRVIII (Dako) for IHC and IF, P-EGFR (Cell Signaling Technology) for IF, and CD68 (Abbiotec). These stains allowed visualizing of tumor morphology and MPIO-labeled SCs (PB), tumor cells (EGFRVIII and P-EGFR), and macrophages (CD68). Dragon Green fluorescence was also visualized to confirm the presence of MPIO. All PB and IHC stained slides were imaged and analyzed using Olympus Microsuite B3V 3.2 software; all Dragon Green– and IF-stained slides were visualized using CoolSNAP ES2 camera (Photometrics), and pictures were taken with MetaMorph, version 7.1.0.0 software.
The number of PB-positive cells was counted under the microscope. Where the high density of PB-positive cells did not allow a distinction in single cells, discrete areas of spots were counted. For each section, the number of PB-positive cells was determined for each of the 4 following regions: injection site, intratumoral region, peritumoral region (ie, tumor edge), and brain tissue adjacent to tumor (BAT). For each animal, the number of PB-positive cells in each region was then summed throughout the different sections, expressed as a percentage of the total number of PB-positive cells, and finally averaged per region for each SC type (3 per SC type).
Statistical Analysis
Two-tailed Student's t test was used to determine the statistical significance of the results, with P <.05 considered to be statistically significant. All results are expressed as the mean ± standard deviation.
Results
hMSCs and fNSCs Were Successfully and Comparably Labeled with MPIO
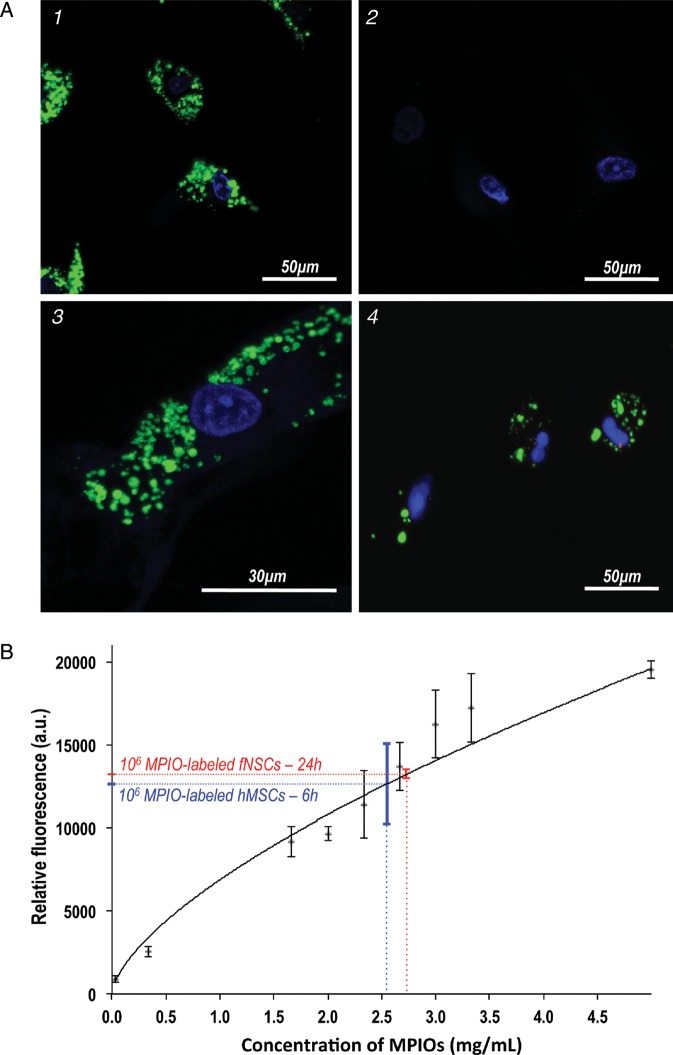
Confocal fluorescence microscopy revealed efficient MPIO labeling of both hMSCs and fNSCs. As shown in Fig. 1, the Dragon Green fluorescence from the MPIO was localized in the cytoplasm of both cell types (Fig. 1). These results confirm the uptake of the MPIO microspheres through endocytosis as previously reported.28,29
Fig. 1.
MPIO labeling of hMSCs and fNSCs. (A) Confocal fluorescence microscopy was performed on (1) MPIO-labeled hMSCs (60×), (2) unlabeled hMSCs, (3) a MPIO-labeled hMS cell (100×) and (4) MPIO-labeled fNSCs (60×). These results confirm the cytoplasmic localization of MPIO (green, Dragon green fluorescent tag) around the nuclei (blue, Hoescht staining) for both SC sources. (B) Level of fluorescence measured from a range of 9 concentrations of free MPIO in 200 μL of PBS (black, n = 4 per data point) and from 1 × 10⁶ MPIO-labeled fNSCs (red, n = 4) and 1 × 10⁶ MPIO-labeled hMSCs (blue, n = 4). Incubation times of 24 h for fNSCs and 6 h for hMSCs lead to a comparable level of fluorescence (P = .7).
hMSCs and fNSCs were successfully labeled with the same amount of MPIO. Spectrophotometric measurements of fluorescence in the 2 cell lines were performed following several incubation times and showed that incubation times of 6 h for hMSCs and of 24 h for fNSCs lead to a comparable level of MPIO uptake in the 2 cell types (P = .7) (Fig. 1B). A total of 1 × 10⁶ hMSCs incubated in MPIO-containing medium for 6 h had a level of fluorescence that was equivalent to a free MPIO concentration of 2.54 ± 0.2 mg/mL. A comparable level of fluorescence was achieved for 1 × 10⁶ fNSCs when they were incubated for 24 h with MPIO-containing medium, and the fluorescence was equivalent to a concentration of 2.73 ± 0.01 mg/mL of free MPIO.
Both MPIO-Labeled hMSCs and MPIO-Labeled fNSCs Injected in the Contralateral Hemisphere Exhibit Pathotropism to U87vIII Tumor
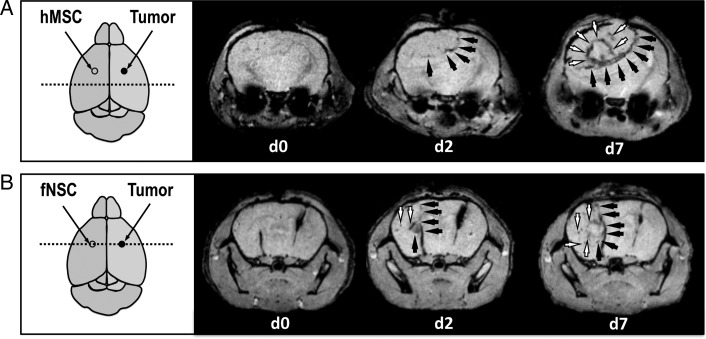
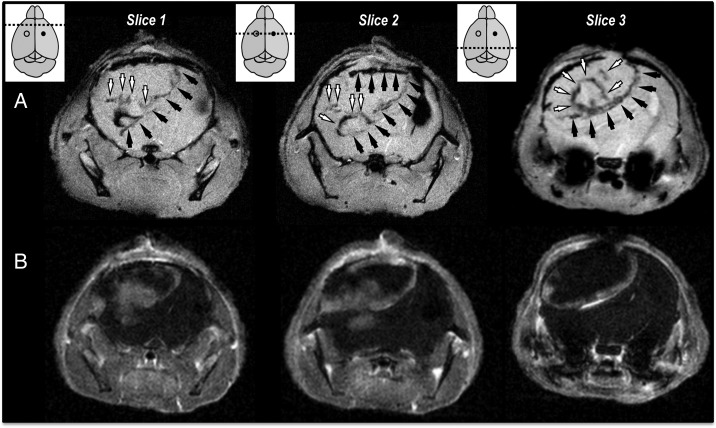
Figure 2 presents axial T2*-w MR images acquired on 2 U87vIII tumor-bearing mice on days 0, 2, and 7 after contralateral injection of (1) MPIO-labeled hMSCs and (2) MPIO-labeled fNSCs. For both SC sources, MPIO-induced areas of hyposignal were seen to change during the 7-day observation period. Specifically, MPIO-labeled hMSCs and fNSCs were found to localize around the rim of the tumor and accumulate in this region between days 2 and 7 (Fig. 2). In some animals, MPIO-labeled hMSCs and fNSCs were also found in the tumor mass at the 2 latest time points (Fig. 2). As shown in Fig. 3, CE-MRI performed at the end of the last imaging session confirmed the localization of MPIO-induced areas of hyposignal at the edges of the tumor and inside the tumor mass.
Fig. 2.
Tropism of MPIO-labeled hMSCS and fNSCs toward U87vIII tumors following contralateral injections. Axial T2*-w MRI slices of U87vIII tumor-bearing mice on the day of (d0), 2 days (d2), and 7 days (d7) after contralateral injection of (A) MPIO-labeled hMSCs and (B) MPIO-labeled fNSCs. The MPIO-labeled SC injection sites are shown as empty circles, the tumor injection sites as filled circles. The dotted lines show the localization of the displayed imaging slices. MPIO-labeled SCs localized at the edges of the tumor (black arrows) and inside the tumor masses (white arrows).
Fig. 3.
Tropism of MPIO-labeled SCs toward areas of high permeability at the edge of and, inside U87vIII tumors following contralateral injections. (A) Axial T2*-w MRI slices of 1 U87vIII tumor-bearing mouse 7 days after contralateral injection of MPIO-labeled hMSCs and (B) corresponding CE-MR images, confirming the colocalization of MPIO-induced areas of hyposignal with the edges of the post-Gd enhancing tumors. The MPIO-labeled SC injection sites are shown as empty circles, the tumor injection sites as filled circles. The dotted lines show the localization of the displayed imaging slices. MPIO-labeled SCs localized at the edges of the tumors in areas of high permeability (black arrows) and inside the tumor masses (white arrows).
MPIO-Labeled hMSCs and MPIO-Labeled fNSC Distribute Inside the Tumor Mass when Injected into U87vIII and GBM26 Tumors
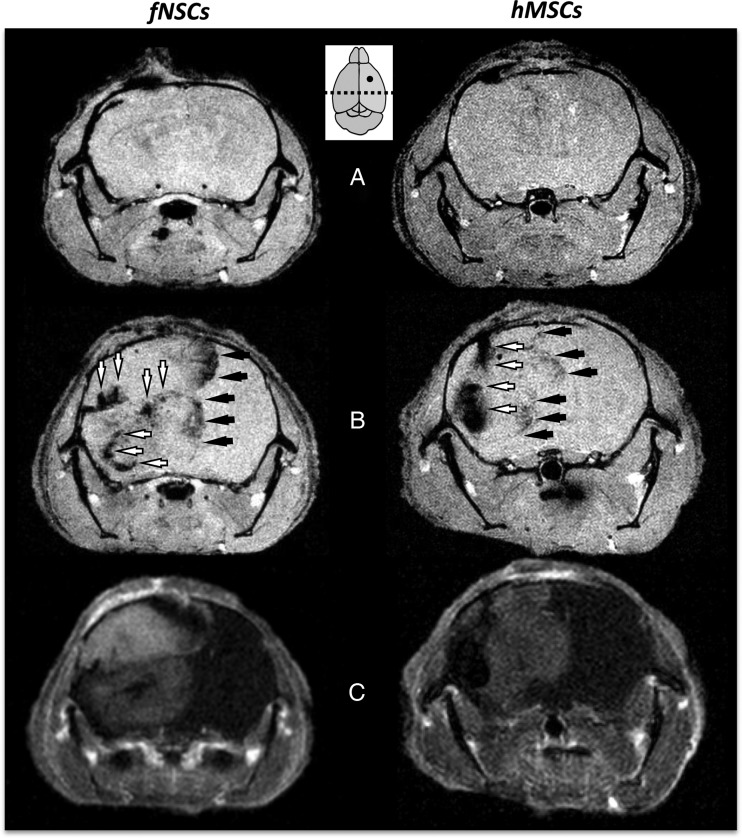
Figure 4 represents results obtained from 2 U87vIII tumor-bearing mice on days 0 (Fig. 4A) and 7 after (Fig. 4B) intratumoral injection of MPIO-labeled fNSCs and intratumoral injection of MPIO-labeled hMSCs. On day 0, the MPIO-labeled SCs were clustered at the site of injection and, consequently, could not be detected by T2*-w MRI in the posterior slices presented in Fig. 4. By day 7, large areas of MPIO-induced hyposignal were detected for both MPIO-labeled SC types, indicating the active distribution of the MPIO-labeled SCs throughout the tumor mass (Fig. 4B). Areas of hyposignal were localized at the edges of the tumor (Fig. 4B) and inside the tumor mass (Fig. 4B), as confirmed by the CE MR images performed at day 7 (Fig. 4C).
Fig. 4.
Biodistribution of MPIO-labeled hMSCS and fNSCs in U87vIII tumors following intratumoral injections. (A) Axial T2*-w MR images of U87vIII tumor bearing mice on the day of and (B) 7 days after intratumoral injection of MPIO-labeled fNSCS (left) and hMSCs (right). (C) Corresponding CE-MR images, confirming the colocalization of MPIO-induced areas of hyposignal with the edges of the post-Gd enhancing tumors. The MPIO-labeled SCs/tumor cells injection site is shown as a filled circle; the dotted line shows the localization of the displayed imaging slices. MPIO-labeled SCs localized at the edges of the tumor (black arrows) and inside the tumor masses (white arrows).
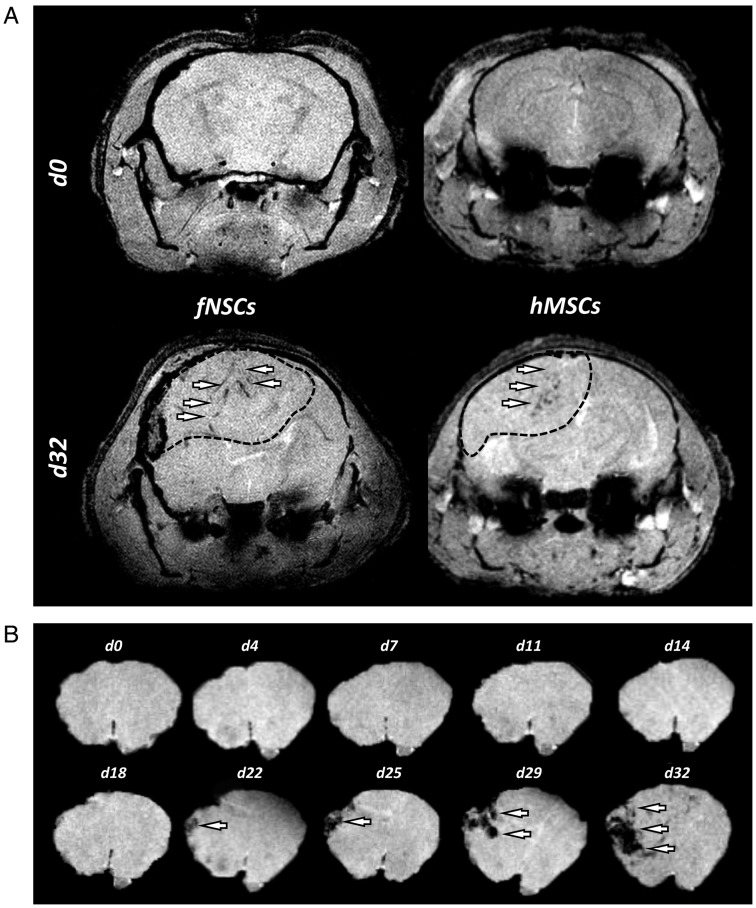
Figure 5A presents results obtained from 2 GBM26 tumor-bearing mice on the days 0 and 32 after intratumoral injection of MPIO-labeled fNSCs and MPIO-labeled hMSCs. The MPIO-induced areas of hyposignal localized inside the tumor masses, but no rim of hyposignal could be detected. Figure 5B shows the segmented brain region of 1 T2*-w axial slice from a GBM26 tumor-bearing mice injected with MPIO-labeled hMSCs on days 0, 4, 7, 11, 14, 18, 22, 25, 29, and 32. MPIO-induced areas of hyposignal are seen to accumulate inside the tumor region over time. No enhancement was detected on CE MR images after injection of Gd contrast agent at any imaging time point, in line with the low neoangiogenic and high invasive properties of this tumor model (data not shown).
Fig. 5.
Biodistribution of MPIO-labeled hMSCS and fNSCs in GBM26 tumors following intratumoral injections. (A) Axial T2*-w MR images of GBM26 tumor-bearing mice on the day of (d0) and 32 days (d32) after intratumoral injection of MPIO-labeled hMSCS (left) and fNSCs (right). The dotted line shows the localization of the GBM26 tumor. (B) T2*-w axial images of a GBM26 tumor-bearing mice injected with MPIO-labeled hMSCs showing the brain region at days 0/4/7/11/14/18/22/25/29/32. MPIO-labeled SCs localized inside the tumor masses (white arrows).
Quantitative Analysis of MPIO-Labeled SC Biodistribution Does Not Show any Significant Differences Between the 2 Stem Cell Sources
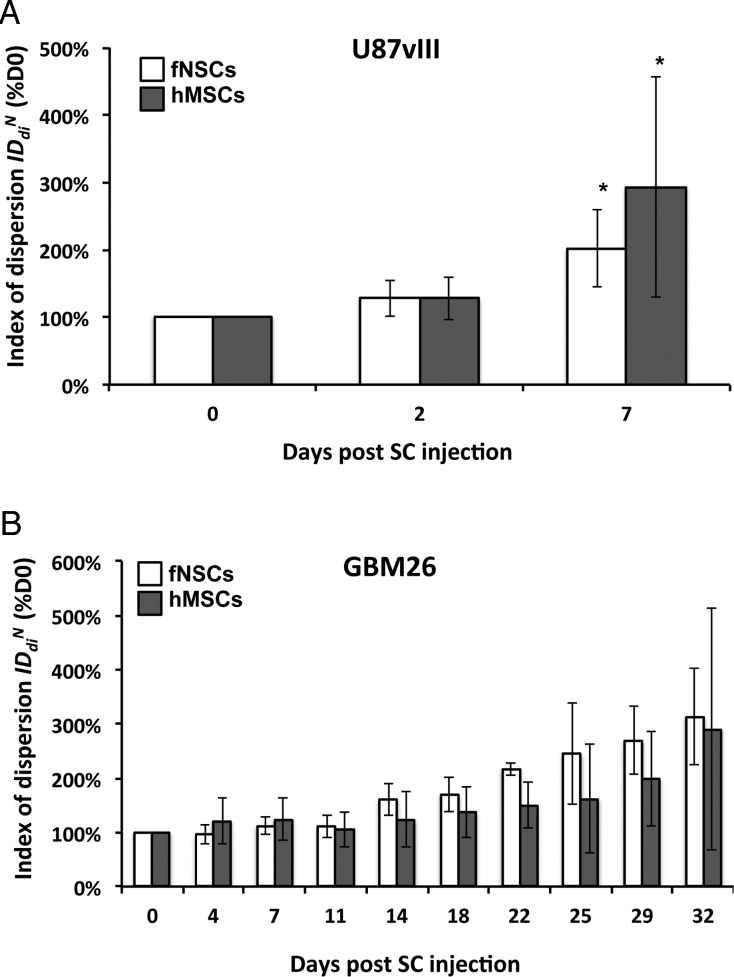
The values of the index of dispersion  as a function of time post intratumoral injection of MPIO-labeled hMSCs and MPIO-labeled fNSCs in U87vIII and GBM26 tumor-bearing mice are shown in Fig. 6.
Fig. 6.
Quantitative assessment of MPIO-labeled SCs biodistribution. Index of dispersion  as a percentage of
  plotted for each imaging day post intratumoral injection of MPIO-labeled hMSCs (grey) and MPIO-labeled fNSCs (white) in (A) U87vIII and (B) GBM26 tumor-bearing mice. A significant increase of the index of dispersion
  was observed for both SC sources between day 0 and day 7 for the U87vIII tumor type (*P < .05), and no significant differences were found between cell types. In the GBM26 model, an increase in
  was also observed between day 0 and day 32 for both SC sources.
For the U87vIII tumor, a significant increase in the value of the index of dispersion  was observed for both SC sources between days 0 and 7:
  (hMSCs) = 293 ± 163% of d0 (P = .03) and
  (fNSCs) = 202 ± 58% of d0 (P = .003), (6 animals per group, Fig. 6A). However, no statistically significant differences were found between the 2 SC sources for any of the 3 time points. A similar trend was observed in the GBM26 tumor, although the data did not reach significance, likely because of the small number of animals studied.
  increased for both SC sources between days 0 and 32:
  (hMSCs) = 288 ± 222% of d0 (P = .1),
  (fNSCs) = 313 ± 88% of d0 (P = .06), (3 animals per group) (Fig. 6B). In line with the results in U87vIII tumors, no statistically significant differences were found between the 2 SC sources in GBM26 tumors for any of the time points.
Immunohistochemical Analysis Confirms the Biodistribution of MPIO-Labeled Stem Cells
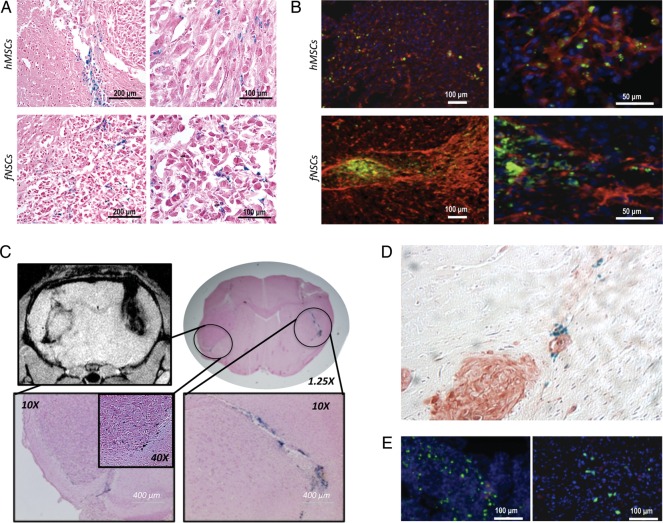
PB staining performed on excised U87vIII tumors revealed the presence of iron from MPIO-labeled SCs at the injection site, inside the tumor mass, and at the edges of the tumor mass, for both MPIO-labeled SC types injected intratumorally (Fig. 7A). Of importance, Dragon Green and EGFRvIII fluorescence confirmed the biodistribution observed by PB analysis, as shown in Fig. 7B. Figure 7C presents a T2*-w MR image and the corresponding PB staining of a U87vIII tumor-bearing mouse injected with MPIO-labeled fNSCs in the contralateral hemisphere. This result confirms the tropism of SCs for the tumor as detected by MRI and shows the MPIO-labeled SC localization at the tumor edge and in the tumor mass. Of interest, tumor microsatellites were also surrounded by MPIO-labeled SCs, as shown in Fig. 7D. To confirm that the MPIO were not simply taken up by macrophages, CD68 staining was also performed (Fig. 7E). The analysis shows that the MPIO do not colocalize with macrophages, suggesting that the MPIO are retained in the SCs.
Fig. 7.
Immunohistochemical and immunofluorescence analysis (A) PB staining showing the presence of MPIO-labeled cells inside a U87vIII tumor mass 7 days after intratumoral injection (top row: hMSC; bottom row: fNSCs). (B) IF demonstrating the Dragon Green fluorescence of MPIO-labeled SCs (green; top row: hMSC; bottom row: fNSCs) in an U87vIII tumor expressing EGFRVIII (red; DAPI in blue). (C) T2*-w MR image and corresponding PB staining of a U87vIII tumor-bearing mouse injected with MPIO-labeled fNSCs in the contralateral hemisphere. (D) PB-positive MPIO-labeled hMSCs tracking an EGFRVIII-positive tumor microsatellite (E) CD68 staining showing a localization pattern different from the Dragon Green pattern.
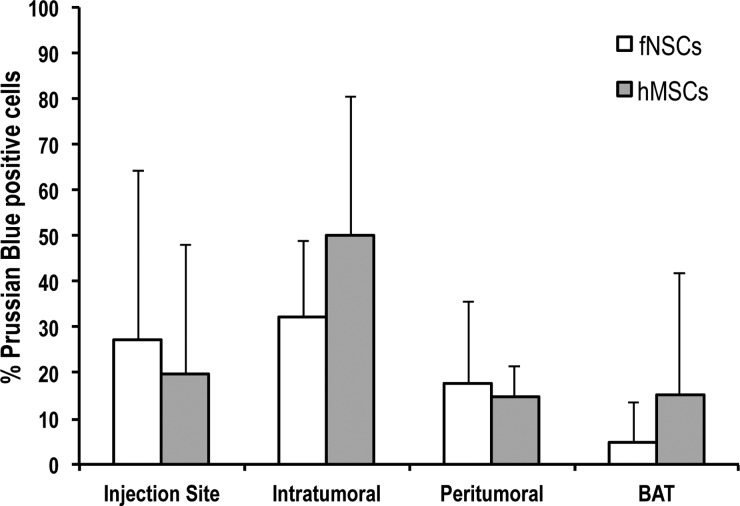
The result of the quantification of PB-positive cells in each of the 4 brain regions is presented in Fig. 8. This histogram shows that PB-positive cells can be found in the 4 defined brain regions (injection site, intratumoral, peritumoral, and normal BAT). Of importance, some PB-positive MPIO-labeled SCs found in the normal parenchyma tracked tumor microsatellites, as presented in Fig. 7D. Similar to the MRI findings, no significant difference in the spatial distribution could be detected between the 2 MPIO-labeled SCs (P = .7; 3 per group).
Fig. 8.
Analysis of the spatial distribution of MPIO-labeled SCs post-intratumoral injection in U87vIII tumors. The histogram presents the number of PB-positive cells in each of the 4 brain regions (injection site, intratumoral, peritumoral, and brain tissue adjacent to tumor [BAT]). No statistically significant differences in the number of PB cells could be found between the 2 SC types (P = .7, n = 3 per group).
Discussion
The goal of this study was to combine high resolution and CE MRI at a high field to longitudinally evaluate the in vivo migration of 2 SC sources, hMSCs and fNSCs, toward and in GBM tumors. Two GBM tumor models were studied, 1 highly neoangiogenic and circumscribed (U87vIII) and 1 poorly neoangiogenic and highly invasive (GBM26), to recapitulate the range of GBM physiological characteristics.
SPIO and USPIO have been commonly used as MR labeling agents for cell tracking.32 Because of their biocompatibility, these particles have been approved by the Food and Drug Administration (FDA) for use in humans, thus facilitating the translation of cell tracking using SPIO/USPIO from preclinical studies to the clinic. Recently, MPIO have emerged as another promising MR labeling agent for tracking cell migration.33 Although these particles have not been FDA approved, biocompatible MPIO are currently being developed,34,35 and MPIO present other advantages. They enable cellular labeling with significantly more iron per unit volume than do SPIO or USPIO. As a result, the sensitivity of detection of MPIO-labeled cells using MRI is improved, and tracking of single cells labeled with MPIO has been reported in several studies.23,33,36 Furthermore, commercially available MPIO can be tagged with a fluorophore. The fluorescence enables easy detection of MPIO in histological sections and provides a quantitative measure of MPIO uptake in cells. In this study, we therefore chose to label the SC with MPIO. Using their fluorescent tag, we confirmed that both hMSCs and fNSCs were successfully labeled with the same quantity of MPIO. This point was essential to achieve a direct comparison of the 2 SC sources. We were also able to obtain histological confirmation of the presence of MPIO using Dragon Green fluorescence imaging of the MPIO-labeled cells. Finally, because of the high R2* relaxivity of the MPIO at 14.1Tesla (R2* = 1427 s−1 mM−1), both MPIO-labeled SC types were highly detectable in vivo, allowing the longitudinal evaluation of their pathotropism and biodistribution in both tumor models.
When injected in the opposite hemisphere of U87vIII tumors, MPIO-labeled hMSCs and MPIO-labeled fNSCs demonstrated a comparable tropism toward tumors. Only the U87vIII tumor model was chosen for the evaluation of pathotropism. These tumors are highly circumscribed and highly vascularized, thus making it possible to clearly assess the location, size, and boundaries of the tumor masses on CE-MR images after injection of a Gd-based contrast agent. On the other hand, such analysis would have been challenging in the GBM26 model, because this tumor model is poorly enhancing, and the location of tumor boundaries is sometimes unclear, especially when the tumor is small.
When injected in the contralateral hemisphere, MPIO-induced areas of hyposignal from hMSCs and fNSCs were found to localize around the rim of the U87vIII tumor masses starting 2 days after injection of SCs. The comparison of CE-MR images and high resolution T2*-w MR images confirmed that MPIO-induced areas of hyposignal were colocalized with the edges of the tumors (ie, in neovascularized regions of high vascular permeability). These observations are consistent with reports of SC tropism to brain tumors being induced by vascular endothelial growth factor (VEGF) and, in particular, with the report by Zhao et al. that SCs exhibit a higher tropism to the neovascularized rims of GBM xenografts.37,38 At later time points (day 7 after SC injection), MPIO-induced areas of hyposignal were also found inside the tumor masses, for both SC sources, in agreement with previous studies.10,12,37,38 Thus, our results confirm the expected high pathotropism of both hMSCs and fNSCs toward tumors and show that MPIO-labeled SCs are able to migrate from one hemisphere to another and to provide good coverage of the tumor over a 7-day period of observation.
When injected directly in the tumor masses, MPIO-labeled hMSCs and fNSCs appeared to behave in a similar fashion in the 2 tumors studied. In the circumscribed U87vIII tumor model, MPIO-induced areas of hyposignal were found to distribute both around the periphery of the tumor and inside the tumor masses, following a similar pattern to the one observed after contralateral injections. In contrast, in the slowly growing and highly invasive GBM26 tumor, MPIO-labeled hMSCs and fNSCs distributed in the central region of the tumor masses, but no clear rim of hyposignal could be detected. The difference in SC distribution observed between the 2 tumor models is likely attributable to the different physiological characteristics of these tumors. Unlike the U87vIII tumor model, the orthotopic GBM26 tumor model is highly invasive, infiltrative, and noncircumscribed. GBM26 tumors did not show any enhancement after injection of a Gd-based contrast agent, indicating vessel co-option behavior and low VEGF levels.39 The absence of areas with high VEGF is in line with the absence of an MPIO-induced rim of hyposignal on the T2*-w images of GBM26 tumors.
Although T2*-w imaging for cell tracking is commonly used, the absolute quantification of the number of MPIO-labeled cells in a region of interest on T2*-w images is extremely challenging.35,40 The size of the signal void in the T2*-w images is much larger than the size of the MPIO-labeled cells. This increases the sensitivity of detection of MPIO-labeled cells but makes it impossible to estimate how many cells are responsible for each area of hyposignal observed. Alternative MRI sequences producing positive rather than negative contrast, such as SWIFT,41 have recently been developed to overcome these quantification issues, and we are in the process of implementing this approach for future studies. In this study, an approach similar to the one reported recently by Song et al. to quantify SPIO-induced areas of hyposignal on T2*-w images was implemented.35 However, rather than performing a full histogram analysis of the number of voxels associated with each T2*-value, our approach consisted of performing a histogram analysis of the number of voxels associated with each SNR value in a brain slice and then calculating the variance, mean, and ID (variance-to-mean ratio) as a parameter reflecting both the spatial distribution of labeled cells in the slice and the overall amount of labeled cells. Although analysis of the index of dispersion does not provide an absolute quantification of the number of MPIO-labeled cells inside the tumor region, it can serve as a tool to perform a relative comparison of both SC sources in each tumor model. This analysis revealed that both MPIO-labeled fNSCs and hMSCs were highly spatially distributed throughout the tumor masses in both tumor models. An increase in the ID was observed for both SC sources and for both tumor types, demonstrating that both SC types distribute throughout the tumor masses during the period of observation. Of interest, in each tumor model, no statistically significant differences in the values of the ID were found between SC types at any time point, suggesting that both SC types reach a comparable coverage of the tumor mass.
Results from the quantitative analysis of the ID were confirmed by IHC and IF analysis. Quantification of the PB-positive SCs showed that both SC types distribute inside the tumor mass after intratumoral injection in U87VIII tumors. Furthermore, the spatial distribution of both SC types was not significantly different: both MPIO-labeled SCs distributed inside and at the edges of the tumor and were also found further away in the brain parenchyma. These results confirmed the expected pathotropism of both SC sources to tumors and are in line with the analysis of the ID.
This study presents for the first time, to our knowledge, a direct comparison of pathotropism and biodistribution of MPIO-labeled hMSCs and fNSCs in 2 GBM tumor models. Our results indicate that both SC sources exhibit strong pathotropism toward tumor and distribute comparably throughout the tumor masses, thus presenting comparably good candidates for the development of SC-based therapies.
Conflict of interest statement. None declared.
Funding
This work was supported by the California Institute for Regenerative Medicine (CIRM) Disease Team (grant DR1-01426) and by the National Cancer Institute (grant CA097257).
References
- 1.CBRTUS. Statistical report - Primary brain and central nervous system tumors diagnosed in the United states in 2004–2006. 2010. http://seer.cancer.gov/ [DOI] [PMC free article] [PubMed]
- 2.Louis DN, Ohgaki H, Wiestler OD, et al. The 2007 WHO classification of tumours of the central nervous system. Acta Neuropathol. 2007;114(2):97–109. doi: 10.1007/s00401-007-0243-4. doi:10.1007/s00401-007-0243-4. [DOI] [PMC free article] [PubMed] [Google Scholar]
- 3.Clarke J, Butowski N, Chang S. Recent advances in therapy for glioblastoma. Arch Neurol. 2010;67(3):279–283. doi: 10.1001/archneurol.2010.5. doi:10.1001/archneurol.2010.5. [DOI] [PubMed] [Google Scholar]
- 4.Stupp R, Hegi ME, Mason WP, et al. Effects of radiotherapy with concomitant and adjuvant temozolomide versus radiotherapy alone on survival in glioblastoma in a randomised phase III study: 5-year analysis of the EORTC-NCIC trial. Lancet Oncol. 2009;10(5):459–466. doi: 10.1016/S1470-2045(09)70025-7. doi:10.1016/S1470-2045(09)70025-7. [DOI] [PubMed] [Google Scholar]
- 5.Stupp R, Mason WP, van den Bent MJ, et al. Radiotherapy plus concomitant and adjuvant temozolomide for glioblastoma. N Engl J Med. 2005;352(10):987–996. doi: 10.1056/NEJMoa043330. doi:10.1056/NEJMoa043330. [DOI] [PubMed] [Google Scholar]
- 6.Belda-Iniesta C, de Castro Carpeno J, Sereno M, Gonzalez-Baron M, Perona R. Epidermal growth factor receptor and glioblastoma multiforme: molecular basis for a new approach. Clin Transl Oncol. 2008;10(2):73–77. doi: 10.1007/s12094-008-0159-z. doi:10.1007/s12094-008-0159-z. [DOI] [PubMed] [Google Scholar]
- 7.Stupp R, Tonn JC, Brada M, Pentheroudakis G. High-grade malignant glioma: ESMO Clinical Practice Guidelines for diagnosis, treatment and follow-up. Ann Oncol. 2010;21(suppl 5):v190–v193. doi: 10.1093/annonc/mdq187. doi:10.1093/annonc/mdq187. [DOI] [PubMed] [Google Scholar]
- 8.James CD, Cavenee WK. Stem cells for treating glioblastoma: how close to reality? Neuro Oncol. 2009;11(2):101. doi: 10.1215/15228517-2009-016. doi:10.1215/15228517-2009-016. [DOI] [PMC free article] [PubMed] [Google Scholar]
- 9.Aboody KS, Brown A, Rainov NG, et al. Neural stem cells display extensive tropism for pathology in adult brain: evidence from intracranial gliomas. Proc Natl Acad Sci USA. 2000;97(23):12846–12851. doi: 10.1073/pnas.97.23.12846. doi:10.1073/pnas.97.23.12846. [DOI] [PMC free article] [PubMed] [Google Scholar]
- 10.Tang Y, Shah K, Messerli SM, Snyder E, Breakefield X, Weissleder R. In vivo tracking of neural progenitor cell migration to glioblastomas. Hum Gene Ther. 2003;14(13):1247–1254. doi: 10.1089/104303403767740786. doi:10.1089/104303403767740786. [DOI] [PubMed] [Google Scholar]
- 11.Ehtesham M, Kabos P, Kabosova A, Neuman T, Black KL, Yu JS. The use of interleukin 12-secreting neural stem cells for the treatment of intracranial glioma. Cancer Res. 2002;62(20):5657–5663. [PubMed] [Google Scholar]
- 12.Ehtesham M, Kabos P, Gutierrez MA, et al. Induction of glioblastoma apoptosis using neural stem cell-mediated delivery of tumor necrosis factor-related apoptosis-inducing ligand. Cancer Res. 2002;62(24):7170–7174. [PubMed] [Google Scholar]
- 13.Muller FJ, Snyder EY, Loring JF. Gene therapy: can neural stem cells deliver? Nat Rev Neurosci. 2006;7(1):75–84. doi: 10.1038/nrn1829. doi:10.1038/nrn1829. [DOI] [PubMed] [Google Scholar]
- 14.Aboody KS, Bush RA, Garcia E, et al. Development of a tumor-selective approach to treat metastatic cancer. PLoS One. 2006;1:e23. doi: 10.1371/journal.pone.0000023. doi:10.1371/journal.pone.0000023. [DOI] [PMC free article] [PubMed] [Google Scholar]
- 15.Aboody KS, Najbauer J, Schmidt NO, et al. Targeting of melanoma brain metastases using engineered neural stem/progenitor cells. Neuro Oncol. 2006;8(2):119–126. doi: 10.1215/15228517-2005-012. doi:10.1215/15228517-2005-012. [DOI] [PMC free article] [PubMed] [Google Scholar]
- 16.Benedetti S, Pirola B, Pollo B, et al. Gene therapy of experimental brain tumors using neural progenitor cells. Nat Med. 2000;6(4):447–450. doi: 10.1038/74710. doi:10.1038/74710. [DOI] [PubMed] [Google Scholar]
- 17.Aboody KS, Najbauer J, Danks MK. Stem and progenitor cell-mediated tumor selective gene therapy. Gene Ther. 2008;15(10):739–752. doi: 10.1038/gt.2008.41. doi:10.1038/gt.2008.41. [DOI] [PubMed] [Google Scholar]
- 18.Ahmed AU, Thaci B, Alexiades NG, et al. Neural Stem Cell-based Cell Carriers Enhance Therapeutic Efficacy of an Oncolytic Adenovirus in an Orthotopic Mouse Model of Human Glioblastoma. Mol Ther. 2011;19(9):1714–1726. doi: 10.1038/mt.2011.100. doi:10.1038/mt.2011.100. [DOI] [PMC free article] [PubMed] [Google Scholar]
- 19.Danks MK, Yoon KJ, Bush RA, et al. Tumor-targeted enzyme/prodrug therapy mediates long-term disease-free survival of mice bearing disseminated neuroblastoma. Cancer Res. 2007;67(1):22–25. doi: 10.1158/0008-5472.CAN-06-3607. doi:10.1158/0008-5472.CAN-06-3607. [DOI] [PubMed] [Google Scholar]
- 20.Frank RT, Najbauer J, Aboody KS. Concise review: stem cells as an emerging platform for antibody therapy of cancer. Stem Cells. 2010;28(11):2084–2087. doi: 10.1002/stem.513. doi:10.1002/stem.513. [DOI] [PMC free article] [PubMed] [Google Scholar]
- 21.Yip S, Sabetrasekh R, Sidman RL, Snyder EY. Neural stem cells as novel cancer therapeutic vehicles. Eur J Cancer. 2006;42(9):1298–1308. doi: 10.1016/j.ejca.2006.01.046. doi:10.1016/j.ejca.2006.01.046. [DOI] [PubMed] [Google Scholar]
- 22.Aboody K, Capela A, Niazi N, Stern JH, Temple S. Translating stem cell studies to the clinic for CNS repair: current state of the art and the need for a Rosetta Stone. Neuron. 2011;70(4):597–613. doi: 10.1016/j.neuron.2011.05.007. doi:10.1016/j.neuron.2011.05.007. [DOI] [PubMed] [Google Scholar]
- 23.Shapiro EM, Skrtic S, Sharer K, Hill JM, Dunbar CE, Koretsky AP. MRI detection of single particles for cellular imaging. Proc Natl Acad Sci USA. 2004;101(30):10901–10906. doi: 10.1073/pnas.0403918101. doi:10.1073/pnas.0403918101. [DOI] [PMC free article] [PubMed] [Google Scholar]
- 24.Foster PJ, Dunn EA, Karl KE, et al. Cellular magnetic resonance imaging: in vivo imaging of melanoma cells in lymph nodes of mice. Neoplasia. 2008;10(3):207–216. doi: 10.1593/neo.07937. [DOI] [PMC free article] [PubMed] [Google Scholar]
- 25.Bulte JW, Zhang S, van Gelderen P, et al. Neurotransplantation of magnetically labeled oligodendrocyte progenitors: magnetic resonance tracking of cell migration and myelination. Proc Natl Acad Sci USA. 1999;96(26):15256–15261. doi: 10.1073/pnas.96.26.15256. doi:10.1073/pnas.96.26.15256. [DOI] [PMC free article] [PubMed] [Google Scholar]
- 26.Bulte JW, Duncan ID, Frank JA. In vivo magnetic resonance tracking of magnetically labeled cells after transplantation. J Cereb Blood Flow Metab. 2002;22(8):899–907. doi: 10.1097/00004647-200208000-00001. doi:10.1097/00004647-200208000-00001. [DOI] [PubMed] [Google Scholar]
- 27.Ozawa T, James CD. Establishing intracranial brain tumor xenografts with subsequent analysis of tumor growth and response to therapy using bioluminescence imaging. J Vis Exp. 2010;(41) doi: 10.3791/1986. [DOI] [PMC free article] [PubMed] [Google Scholar]
- 28.Saldanha KJ, Doan RP, Ainslie KM, Desai TA, Majumdar S. Micrometer-sized iron oxide particle labeling of mesenchymal stem cells for magnetic resonance imaging-based monitoring of cartilage tissue engineering. Magn Reson Imaging. 2011;29(1):40–49. doi: 10.1016/j.mri.2010.07.015. doi:10.1016/j.mri.2010.07.015. [DOI] [PMC free article] [PubMed] [Google Scholar]
- 29.Hinds KA, Hill JM, Shapiro EM, et al. Highly efficient endosomal labeling of progenitor and stem cells with large magnetic particles allows magnetic resonance imaging of single cells. Blood. 2003;102(3):867–872. doi: 10.1182/blood-2002-12-3669. doi:10.1182/blood-2002-12-3669. [DOI] [PubMed] [Google Scholar]
- 30.Ozawa T, Faddegon BA, Hu LJ, Bollen AW, Lamborn KR, Deen DF. Response of intracerebral human glioblastoma xenografts to multifraction radiation exposures. Int J Radiat Oncol Biol Phys. 2006;66(1):263–270. doi: 10.1016/j.ijrobp.2006.05.010. doi:10.1016/j.ijrobp.2006.05.010. [DOI] [PubMed] [Google Scholar]
- 31.Ozawa T, Wang J, Hu LJ, Bollen AW, Lamborn KR, Deen DF. Growth of human glioblastomas as xenografts in the brains of athymic rats. In Vivo. 2002;16(1):55–60. [PubMed] [Google Scholar]
- 32.Liu W, Frank JA. Detection and quantification of magnetically labeled cells by cellular MRI. Eur J Radiol. 2009;70(2):258–264. doi: 10.1016/j.ejrad.2008.09.021. doi:10.1016/j.ejrad.2008.09.021. [DOI] [PMC free article] [PubMed] [Google Scholar]
- 33.Shapiro EM, Skrtic S, Koretsky AP. Sizing it up: cellular MRI using micron-sized iron oxide particles. Magn Reson Med. 2005;53(2):329–338. doi: 10.1002/mrm.20342. doi:10.1002/mrm.20342. [DOI] [PubMed] [Google Scholar]
- 34.Nkansah MK, Thakral D, Shapiro EM. Magnetic poly(lactide-co-glycolide) and cellulose particles for MRI-based cell tracking. Magn Reson Med. 2011;65(6):1776–1785. doi: 10.1002/mrm.22765. doi:10.1002/mrm.22765. [DOI] [PMC free article] [PubMed] [Google Scholar]
- 35.Song HT, Jordan EK, Lewis BK, Gold E, Liu W, Frank JA. Quantitative T2* imaging of metastatic human breast cancer to brain in the nude rat at 3 T. NMR Biomed. 2011;24(3):325–334. doi: 10.1002/nbm.1596. doi:10.1002/nbm.1596. [DOI] [PMC free article] [PubMed] [Google Scholar]
- 36.Foster-Gareau P, Heyn C, Alejski A, Rutt BK. Imaging single mammalian cells with a 1.5 T clinical MRI scanner. Magn Reson Med. 2003;49(5):968–971. doi: 10.1002/mrm.10417. doi:10.1002/mrm.10417. [DOI] [PubMed] [Google Scholar]
- 37.Schmidt NO, Przylecki W, Yang W, et al. Brain tumor tropism of transplanted human neural stem cells is induced by vascular endothelial growth factor. Neoplasia. 2005;7(6):623–629. doi: 10.1593/neo.04781. doi:10.1593/neo.04781. [DOI] [PMC free article] [PubMed] [Google Scholar]
- 38.Zhao D, Najbauer J, Garcia E, et al. Neural stem cell tropism to glioma: critical role of tumor hypoxia. Mol Cancer Res. 2008;6(12):1819–1829. doi: 10.1158/1541-7786.MCR-08-0146. doi:10.1158/1541-7786.MCR-08-0146. [DOI] [PubMed] [Google Scholar]
- 39.Leenders WP, Kusters B, de Waal RM. Vessel co-option: how tumors obtain blood supply in the absence of sprouting angiogenesis. Endothelium. 2002;9(2):83–87. doi: 10.1080/10623320212006. doi:10.1080/10623320212006. [DOI] [PubMed] [Google Scholar]
- 40.Rad AM, Arbab AS, Iskander AS, Jiang Q, Soltanian-Zadeh H. Quantification of superparamagnetic iron oxide (SPIO)-labeled cells using MRI. J Magn Reson Imaging. 2007;26(2):366–374. doi: 10.1002/jmri.20978. doi:10.1002/jmri.20978. [DOI] [PMC free article] [PubMed] [Google Scholar]
- 41.Zhou R, Idiyatullin D, Moeller S, et al. SWIFT detection of SPIO-labeled stem cells grafted in the myocardium. Magn Reson Med. 2010;63(5):1154–1161. doi: 10.1002/mrm.22378. doi:10.1002/mrm.22378. [DOI] [PMC free article] [PubMed] [Google Scholar]


