

Kv2.1 surface clusters in transfected HEK cells and hippocampal neurons are shown to be trafficking platforms involved in potassium channel movement to and from the cell surface. This work is the first to define stable cell surface sites for ion channel delivery and retrieval at the cell surface.
Abstract
Voltage-gated K+ (Kv) channels regulate membrane potential in many cell types. Although the channel surface density and location must be well controlled, little is known about Kv channel delivery and retrieval on the cell surface. The Kv2.1 channel localizes to micron-sized clusters in neurons and transfected human embryonic kidney (HEK) cells, where it is nonconducting. Because Kv2.1 is postulated to be involved in soluble N-ethylmaleimide–sensitive factor attachment protein receptor–mediated membrane fusion, we examined the hypothesis that these surface clusters are specialized platforms involved in membrane protein trafficking. Total internal reflection–based fluorescence recovery after photobleaching studies and quantum dot imaging of single Kv2.1 channels revealed that Kv2.1-containing vesicles deliver cargo at the Kv2.1 surface clusters in both transfected HEK cells and hippocampal neurons. More than 85% of cytoplasmic and recycling Kv2.1 channels was delivered to the cell surface at the cluster perimeter in both cell types. At least 85% of recycling Kv1.4, which, unlike Kv2.1, has a homogeneous surface distribution, is also delivered here. Actin depolymerization resulted in Kv2.1 exocytosis at cluster-free surface membrane. These results indicate that one nonconducting function of Kv2.1 is to form microdomains involved in membrane protein trafficking. This study is the first to identify stable cell surface platforms involved in ion channel trafficking.
INTRODUCTION
Voltage-gated potassium (Kv) channels control electrical excitability in multiple cell types. Although fine control of both channel surface densities and location is essential to excitable cell physiology, nothing is known concerning the location of Kv channel delivery and retrieval on the neuronal cell surface. If fact, little is known with regard to where endocytosis and exocytosis occur in most cell types, and it is generally assumed that, with the exception of synaptic regions in neurons, these trafficking events in mammalian cells occur randomly over the cell surface. However, recent live cell imaging work suggests that this assumption may not be accurate. For example, Glut 4 surface clusters in adipose cells may represent membrane insertion and retrieval sites for this transporter (Stenkula et al., 2010), and clathrin concentrations can transiently appear in the same region of fibroblastic cells (Kirchhausen, 2009).
The mammalian Kv2.1 delayed rectifier is one of the most ubiquitously expressed Kv channels and plays many diverse physiological roles. Within hippocampal neurons Kv2.1 regulates the action potential waveform, especially during high-frequency stimulation (Du et al., 2000). In pulmonary vascular smooth muscle Kv2.1 represents a hypoxia-sensitive channel that regulates the membrane potential and thus smooth muscle contraction (Patel et al., 1997; Hulme et al., 1999), and in cerebral artery smooth muscle Kv2.1 regulates myogenic constriction (Amberg and Santana, 2006). In the myocardium Kv2.1 generates the IKslow current and regulates action potential duration (Kodirov et al., 2004), and in pancreatic beta cells Kv2.1 plays a central role in the regulation of membrane potential and insulin release (Jacobson et al., 2007).
Kv2.1 has also been implicated in nontraditional Kv channel functions. In cortical neurons and Chinese hamster ovary cells Kv2.1 is required for thiol-oxidant–induced apoptosis (Pal et al., 2003, 2006). Down-regulation of Kv2.1 is neuroprotective, and overexpression enhances cell death (Pal et al., 2003). Most relevant to the present study, Kv2.1 is postulated to play a role in membrane vesicle–trafficking and soluble N-ethylmaleimide–sensitive factor attachment protein receptor (SNARE)–mediated membrane fusion in both neurosecretory cells and sensory neurons (Feinshreiber et al., 2009, 2010). Inhibition of Kv2.1 SNARE protein interaction interferes with dense core vesicle release from PC-12 cells, and overexpression enhances release via a mechanism independent of ion conduction (Singer-Lahat et al., 2007). Of interest, Kv2.1 binds to both syntaxin and SNAP-25 in vitro and thus has been postulated to be directly involved in membrane fusion events (MacDonald et al., 2002; Leung et al., 2003).
Kv2.1 is unusual among voltage-gated potassium channels in that much of it localizes to micron-sized clusters in hippocampal and cortical neurons in vitro and in vivo (Sarmiere et al., 2008; Kihira et al., 2010; Guan et al., 2011). In alpha motor neurons these microdomains exist at synaptic inputs, where they colocalize with muscarinic acetylcholine receptors and other proteins involved in cholinergic transmission (Muennich and Fyffe, 2004). Kv2.1 surface clusters also form in adenoviral infected atrial myocytes (O'Connell et al., 2008) and transfected human embryonic kidney (HEK) 293 cells (Misonou et al., 2005; O'Connell and Tamkun, 2005; Tamkun et al., 2007; Mohapatra and Trimmer, 2006). In acutely isolated rat brain slices Kv2.1 declustering occurs in response to hypoxia and/or ischemia due to astrocytic detection of the neuronal insult (Misonou et al., 2008; Mulholland et al., 2008). This transcellular regulation of Kv2.1 localization suggests these surface microdomains are physiologically important to brain biology, with the hypoxia-induced declustering being either neuroprotective or neurotoxic.
Our previous work using cell-attached patch clamp indicates that the Kv2.1 channel within the clusters is nonconducting, with whole-cell Kv2.1 current likely derived from a subpopulation of nonclustered channels (O'Connell et al., 2010). However, the clustered channels produce gating currents and are therefore capable of sensing membrane potential, potentially linking plasma membrane electrical activity to intracellular events, similar to the function of L-type Ca2+ channels at the skeletal muscle T-tubule/SR junction (Tanabe et al., 1988). One intriguing possibility, given the SNARE protein interactions described earlier, is that the Kv2.1 clusters couple membrane potential to secretion and/or the delivery of membrane cargo to the cell surface.
Here we use quantum dot (Qdot) labeling and total internal reflection fluorescence (TIRF) imaging approaches to test the hypothesis that the Kv2.1 plasma membrane clusters are specialized platforms involved in the trafficking of membrane proteins to and from the cell surface. Hundreds of observations detail the location of Kv2.1 plasma membrane insertion for both nascent and recycling Kv2.1 channels, as well as the location of endocytosis from the surface. The data indicate that Kv2.1 clusters represent platforms for the insertion and endocytosis of not only Kv2.1, but also the unrelated K+ channel Kv1.4. This study is the first to define stable cell surface sites for Kv channel delivery in mammalian cells.
RESULTS
Kv2.1 localizes to clusters on the neuronal cell surface
The three-dimensional (3D) reconstruction presented in Figure 1 illustrates the surface distribution of GFP-Kv2.1 after expression in cultured hippocampal neurons. The clusters are distributed evenly over the soma, concentrated at the MAP2-negative axon initial segment and present to a limited extent within the MAP2-positive proximal dendrites as previously described (Sarmiere et al., 2008). This expression pattern also exists in the intact brain (Misonou et al., 2005) and in acutely isolated brain slices (Misonou et al., 2008; Mulholland et al., 2008). Our previous work indicates that the localization mechanism involves the trapping of mobile channels behind a cytoskeletal-based diffusion barrier, as opposed to individual channels being statically tethered to submembrane anchors (Tamkun et al., 2007; Weigel et al., 2011).
FIGURE 1:
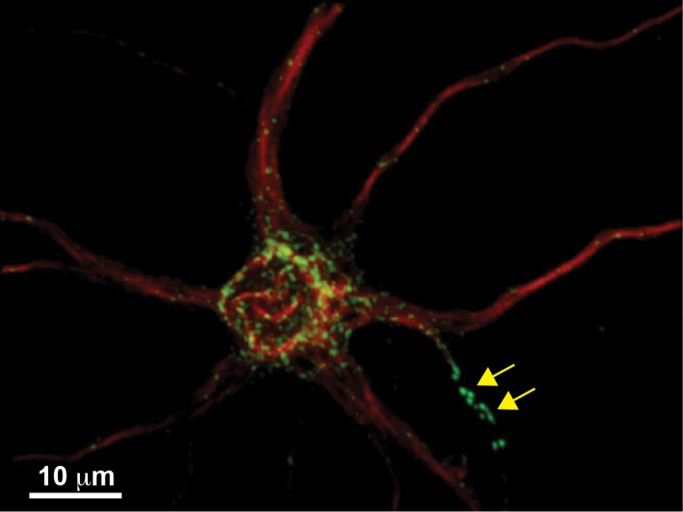
Kv2.1 localizes to clusters on the neuronal cell surface. A 3D reconstruction of confocal sections of an 8–d in vitro rat hippocampal neuron expressing GFP-Kv2.1 (green). The cell was fixed and labeled with Alexa 594–conjugated anti-MAP2 antibodies (red) to identify the soma and dendrites. The arrows indicate Kv2.1 clusters within the MAP2-negative axon initial segment.
Kv2.1 exists primarily on the cell surface but rapidly recycles between membrane and intracellular compartments
Kv2.1 localizes to micron-sized clusters in transfected HEK cells that are similar to those present in cultured and native hippocampal neurons (Misonou et al., 2005; Mohapatra and Trimmer, 2006; O'Connell et al., 2006). We chose to initially examine Kv2.1 trafficking in transfected HEK cells since these cells lack endogenous Kv2.1 (O'Connell et al., 2006, 2010). Therefore all the Kv2.1 in transfected cells is readily detectable using the attached fluorescent proteins and epitope tags. HEK cells were transfected with a modified Kv2.1 carrying green fluorescent protein (GFP) on its N-terminus and an anti-hemagglutinin (HA) antibody epitope on the extracellular surface (GFP-Kv2.1-HA) between the first two transmembrane domains (O'Connell et al., 2006). Figure 2A shows a 3D reconstruction of the GFP fluorescence. Note that Kv2.1 also exists outside the clusters on the cell surface. This construct, as well as all others used in our work, demonstrates wild-type channel trafficking and function (O'Connell et al., 2010). Figure 2B illustrates the binding of an Alexa Fluor 594–conjugated anti-HA antibody to the same live, nonpermeabilized cell, confirming that the Kv2.1 channel is on the cell surface. Figure 2C shows the same cell in an XYZ format immediately after Alexa Fluor 594 anti-HA antibody labeling. The lack of readily detectable GFP fluorescence within the cytoplasm demonstrates that in transfected HEK cells the trafficking of Kv2.1 to the surface is highly efficient as compared with that of other Kv channels (Vacher et al., 2007; Vicente et al., 2008; Jenkins et al., 2011). Figure 2D shows the same antibody-labeled cell 10 min later. Intracellular Alexa Fluor 594 is now detected (arrows), demonstrating that Kv2.1 is internalized over this time frame. The goal of the following experiments was to test the hypothesis that the Kv2.1 clusters act as cell surface platforms involved in the transport of Kv2.1, as well as other membrane proteins, to and from the cell surface.
FIGURE 2:
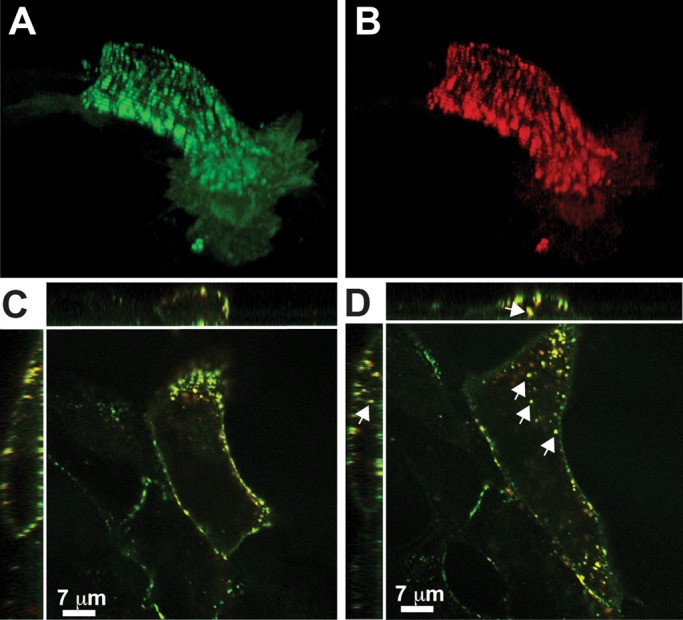
Kv2.1 traffics efficiently to the cell surface in transfected HEK cells and is rapidly internalized. (A) GFP-Kv2.1-HA expression pattern 16 h posttransfection. The GFP fluorescence in this 3D reconstruction of confocal sections is illustrated in green. (B) Detection of cell surface GFP-Kv2.1-HA in the same cell. The red indicates the binding of Alexa 594–conjugated anti-HA antibody to the external HA epitope. The image was taken immediately after antibody binding to live cells. (C) XYZ view of the GFP and anti-HA antibody localization patterns in the same cell as in A and B. (D) Same cell as in C after additional 10 min at 37°C. Note the internalization of the anti-HA antibody, which appears as yellow puncta due to the overlay of the GFP and Alexa Fluor 594 fluorescence (arrows).
Intracellular Kv2.1-containing trafficking vesicles dock at the Kv2.1 cell surface clusters
If Kv2.1 recycles between cell surface and intracellular compartments, we should be able to detect an intracellular Kv2.1 channel vesicular population using appropriate techniques. We applied a TIR photobleaching approach to remove the cell surface cluster fluorescence and allow detection of a weak vesicular intracellular signal normally masked by the high-intensity surface clusters. As illustrated in Supplemental Video S1, putative trafficking vesicles were detected after photobleach of the surface yellow fluorescent protein (YFP)–Kv2.1 in transfected HEK cells. Vesicular movement was often directed and occurred with rates of 1.4 ± 0.5 μm/s, n = 13, consistent with motor-based transport as opposed to random diffusion. We next determined the number of Kv2.1 channels present in each cytoplasmic vesicle. HEK cells were transfected with GFP-Kv2.1, and after TIR-photobleach, single GFP molecule fluorescence intensity was determined by quantitating the bleach step magnitude of single GFP-Kv2.1 channels observed on the cell surface. This single-step intensity was then compared with that of individual trafficking vesicles fusing with the cell surface to estimate the number of Kv2.1 channels contained within each vesicle, assuming four GFP molecules per channel tetramer. As summarized in Supplemental Figure S1, the mean channel number per vesicle was 34 ± 4, with a range of 5–90 molecules, n = 21.
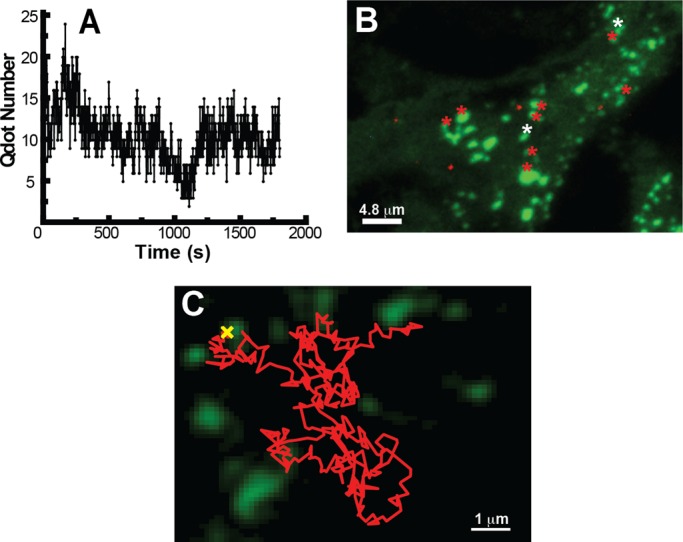
If the Kv2.1 surface clusters are platforms for Kv2.1 delivery and retrieval at the plasma membrane, it should be possible to detect both the tethering of mobile vesicles and cargo delivery to the plasma membrane. We performed a partial TIR-based photobleach experiment such that cluster bleach was incomplete. This approach allowed the cluster itself and adjacent trafficking vesicles to be visualized simultaneously in TIRF since the vesicles are partially or totally outside of the TIR illumination and thus not significantly bleached. Figure 3 shows representative results of one such experiment. Figure 3, A and B, show the clusters on the basal membrane of a GFP-Kv2.1–transfected HEK cell imaged in TIRF before and immediately after partial photobleaching. Figure 3C is an enlargement of the region indicated by the larger white square in Figure 3B and shows bright puncta that we interpret as trafficking vesicles tethered to the partially bleached clusters, which are outlined in white. The asterisk indicates an area with neither bleached clusters nor tethered vesicles. In this particular cell 49 of 50 tethered vesicles were located at the edge of the surface clusters immediately after bleaching, suggesting the clusters and vesicles have a specific interaction, especially since only 24% of the surface area was occupied by the Kv2.1 clusters in this cell, but approximately half of the clusters had associated vesicles. Of the 50 vesicles observed at the beginning of the FRAP period, 17 remained statically tethered after 4 min. Additional vesicles appear and deliver Kv2.1 to the cell surface clusters, as illustrated in Figure 3, D and E. Figure 3D is an enlargement of partially bleached surface clusters within the smaller white square indicated in Figure 3B. Quantitation of postbleach fluorescence recovery within the four regions of interest (ROI) indicated in Figure 3D is shown in Figure 3E. The two ROIs that originally contained clusters (red and purple) show greater rates of fluorescence recovery as compared with the two ROIs drawn over cluster-free membrane (blue and yellow). The acquisition of new GFP-Kv2.1 in a stepwise manner, as seen between 10 and 30 s for the ROIs drawn around bleached Kv2.1 clusters, is predicted if individual vesicles arrive over time and dock or deliver cargo within the ROI. The ROIs that are over cluster-free membrane show a slow but steady increase in fluorescence as nonclustered, freely diffusing channels from the unbleached top of the cell diffuse to the basal surface. Delivery over the 10- to 25-s time frame is illustrated in Supplemental Video S2. Overall, 87 ± 12% of vesicles were cluster associated after the TIR-based photobleach, even though clusters occupied only 21 ± 4% of the basal surface in the five cells examined. In addition, 75 ± 9% of the clusters gaining GFP-Kv2.1 after photobleach showed stepwise increases in fluorescence during recovery, as illustrated in Figure 3E. In summary, these whole-cell photobleach experiments confirm our previous (O'Connell et al., 2006) but limited observations that the Kv2.1 clusters are involved in channel delivery to the cell surface.
FIGURE 3:

TIR-based FRAP analysis illustrates vesicle tethering and fusion to Kv2.1 surface clusters in transfected HEK cells. (A) Surface clusters containing GFP-Kv2.1 imaged using TIRF microscopy before photobleach. (B) TIRF image immediately after TIR-based photobleach. (C) Higher magnification of the area enclosed by the larger white box in B. The original cluster positions are outlined in white, and the white arrows point to two adhered vesicles. The asterisk denotes a Kv2.1 cluster-free membrane region also devoid of adhered trafficking vesicles. (D) Higher magnification of the area enclosed by the smaller white box in B. Time here is immediately postbleach. (E) Time course of fluorescence recovery within the four regions indicated in D. This increase in fluorescence is illustrated in Supplemental Video S2.
Detection of single Kv2.1 channels being delivered directly to the surface clusters
Because we relied on fluorescent protein imaging to observe multiple Kv2.1 channels being delivered to the cell surface clusters as illustrated in Figure 3, it remained possible that single Kv2.1 channels arrived at the cell surface via delivery to Kv2.1 cluster-free plasma membrane. In addition, the TIRF imaging of Figure 3 does not confirm true cell surface insertion, showing instead that the GFP-Kv2.1 is within the TIR field. To address these issues, we expanded our previous Qdot-based detection of single Kv2.1 channels (O'Connell et al., 2006; Tamkun et al., 2007; Weigel et al., 2011). Qdot labeling is extremely specific, since streptavidin-conjugated Qdots are attached to the extracellular surface of Kv2.1 via channel-specific biotinylation. In addition, Qdots do not photobleach, and so channels can be tracked for hours. Our Qdot-based insertion-site assay to detect the location of Kv2.1 cell surface insertion with single-molecule sensitivity involved first incubating live cells expressing biotinylated GFP-Kv2.1-loopBAD (BAD, biotin acceptor domain) with 1 μM NeutrAvidin for 5 min to saturate biotinylated surface channels and hence prevent streptavidin-conjugated Qdot labeling. After extensive washes to remove unbound NeutrAvidin, the cells immediately were imaged in the presence of 1 nM Qdot 605 using a spinning-disk confocal microscope. Freely diffusing Qdots move too rapidly to be effectively detected under our imaging conditions. As Kv2.1 channels that were synthesized de novo or were intracellular during NeutrAvidin binding insert into the cell surface, they become Qdot labeled. Thus spontaneous Qdot appearance during the continuous imaging represents Qdot binding to a recently inserted channel. Supplemental Figure S2 shows that the NeutrAvidin block is highly effective and that Qdot binding after this block requires temperatures allowing intracellular trafficking. Supplemental Figure S3 indicates that Qdots bind cell surface Kv2.1 soon after being added to the culture dish, with 75 s required to reach 50% binding. Qdot binding during the insertion site assay is likely to occur much faster, since the cells are continuously bathed in a Qdot solution (as opposed to the dots being added to dish as in Supplemental Figure S3, where diffusion is delayed). Because the median distance covered by a nonclustered Kv2.1 channel in 40 s is 375 nm (Weigel et al., 2011), the inserted Kv2.1 channels are unlikely to diffuse far from their site of membrane insertion before being bound by a Qdot. If single channels were inserted at locations outside of the GFP-Kv2.1 clusters, more Qdots should first appear off cluster. In contrast, if the clusters are the predominant insertion sites, even for single molecules, then Qdot appearance should favor the clusters themselves. Qdots appearing within 0.5 μm of the cluster perimeter were defined as appearing at that cluster.
Figure 4 shows the results of a representative experiment in which Qdot binding to newly inserted Kv2.1 channels was used to determine the location of channel insertion. As outlined in Figure 4A, HEK cells expressing GFP-Kv2.1-loopBAD that was biotinylated intracellularly via cotransfection with biotin ligase (BirA) were NeutrAvidin blocked and then imaged in the presence of Qdots as described here earlier. Figure 4B shows the lack of detectable Qdots at the beginning of the time series. Figure 4C shows that by 5 min, eight Qdots are observed, six within and confined to the Kv2.1 clusters as visualized via their GFP fluorescence and two freely diffusing outside of the clusters. By 15 min, 19 cluster-associated Qdots are seen, along with six off-cluster dots (Figure 4D). Figure 4E summarizes the locations at which Qdots appear over the entire 18-min time series. Twenty Qdots appeared at a cluster perimeter with subsequent trapping within the cluster. Two Qdots appeared at a cluster border but were not retained within the cluster, instead diffusing away to be trapped in a cluster 3 and 4 min later. These events explain how channel insertion at the clusters can still contribute to freely diffusing Qdots. In addition, we observed single Kv2.1 channels leaving one cluster only to be trapped in an adjacent one within a few minutes (unpublished data). Thus single Kv2.1 molecules are continuously exchanging between the cluster and noncluster membrane compartments even though the clusters are preferred insertion sites and individual Kv2.1 channels can reside within the cluster for >1 h. The first 3.5 min of the Qdot incubation time series is shown in Supplemental Video S3. In this particular cell 22 of 24 Qdots (91%) appeared at a cluster, and only two were not retained within the cluster next to which they were inserted.
FIGURE 4:

Detection of single channel insertion sites in transfected HEK cells. Basal membrane GFP-Kv2.1-loopBAD clusters are shown in green and Qdot 605 in red. (A) Outline of the Qdot-based insertion-site protocol. (B) Qdot labeling immediately after NeutrAvidin block of surface GFP-Kv2.1-loopBAD. (C, D) Qdot labeling observed at the indicated times. (E) Summary of sites at which Qdots were first detected. The 20 red asterisks indicate the appearance at a cluster perimeter and subsequent trapping within the cluster. The two yellow asterisks indicate channels arriving at a cluster border that were not retained within the cluster but diffused away to be confined to different clusters 3 and 4 min later. The cyan asterisks represent Qdots first observed off cluster that then become confined within a Kv2.1 cluster. Images were obtained during continuous spinning-disk imaging at 37°C in the presence of 1 nM Qdot-containing imaging saline with 1% BSA.
In summary, this Qdot binding-based insertion assay supports the hypothesis that the Kv2.1 surface clusters are the preferred sites for Kv2.1 insertion into the cell surface in HEK cells. Additional experiments are summarized on a per-cell basis in Supplemental Table S1. Analyzing eight cells indicated that 84.7 ± 8.4%, n = 223, of the Qdots spontaneously appearing on the cell surface were cluster associated, appearing within 0.5 μm of the GFP-defined cluster border. In these cells the cluster surface area represented 17.2 ± 9.5% of the basal surface, indicating that Kv2.1 insertion does not occur at random sites.
Recycling Kv2.1 channels arrive at and depart from the plasma membrane at the cell surface clusters
During our previous work examining Kv2.1 diffusion, in which a low number of Qdots were tracked over 15–45 min, we often observed fluctuations in the number of Qdots on the cell surface, suggesting that Kv2.1 is constantly being internalized and recycled to the cell surface (Tamkun et al., 2007; Weigel et al., 2011). Therefore we examined whether Kv2.1 endocytosis and reinsertion into the plasma membrane occurs at the surface clusters. HEK cells expressing biotinylated GFP-Kv2.1-loopBAD were labeled with Qdots at low efficiency, unbound Qdots were removed, and the cells were returned to the incubator for 1–2 h to allow Qdot recycling to begin. TIRF imaging was then used to detect Qdot removal and appearance, that is, endocytosis and reinsertion into the plasma membrane, respectively. Cytoplasmic Kv2.1 vesicles with a single Qdot were transported at the same rate as Qdot-free vesicles (1.3 ± 0.6 vs. 1.4 ± 0.5 μm/s, respectively; unpublished data), suggesting that Qdot-bound Kv2.1 channels traffic normally. In addition, Petrini et al. (2009) found that Qdot-labeled α-amino-3-hydroxy-5-methyl-4-isoxazolepropionic acid receptors undergo normal clathrin-based endocytosis, and Zhang et al. (2007) followed the exocytosis of Qdots confined within synaptic vesicles to demonstrate complete vesicle fusion with the plasma membrane without the Qdot mass altering vesicle delivery or fusion. Thus limited Qdot labeling is unlikely to alter membrane protein internalization and subsequent trafficking.
Representative results for recycling Kv2.1 channels are shown in Figure 5. Figure 5, A–C, shows the surface distribution of Qdot-labeled Kv2.1 channels at the indicated times after a 1-h incubation to allow recycling to begin. Note the changing Qdot/GFP relationship at the three selected time points. Dots both appear and disappear during this 30-min period, reflective of exocytosis and endocytosis, respectively, whereas total Qdot number remains relatively constant at 16 in this particular cell. Over 30 min of TIRF imaging there were four Qdots appearing at cluster perimeters and six instances of Qdots disappearing at cluster perimeters. In two cases, when the Qdots disappeared GFP fluorescence intensity was also lost, suggesting that multiple channels were endocytosed (unpublished data). During most of this sequence there were on average 14 cluster-confined Qdots and two freely diffusing Qdots not associated with a cell surface cluster. Figure 5D shows the Qdot fluorescence over time within the ROI indicated in Figure 5C. Note the sudden increase in the Qdot signal, representing two Qdots approaching the membrane and being inserted into the GFP-Kv2.1 cluster. The intensity decrease is consistent with the sequential endocytosis of the two recently inserted Qdot-labeled channels. Supplemental Video S4 illustrates Qdot-labeled Kv2.1 channel addition at the cluster within the white box of Figure 5C (the first 360 s of the Figure 5D time series). Note that in this video the Qdot fluorescence gradually intensifies as the Qdots enter the TIR field. Supplemental Video S5 illustrates the Qdot loss from the same cluster (the last 600 s of the Figure 5D time series). The Qdots are lost due to internalization, as indicated by the progressively weaker intensity, as opposed to diffusion out and away from the cluster. Overall, 96%, n = 146, of Qdot-bound Kv2.1 channels appeared on the surface at the cluster perimeter, whereas 97%, n = 42, of the Qdots were internalized at this location. Although Qdots can enter a stable, long-lived dark state lasting up to 500 s (Yao et al., 2005), the frequency of such a long-lived state is very low, as indicated in Supplemental Figure S4. Only 14 of 460 long-lived dark events exceeded 60 s in a total observation time of 22,000 s. Therefore long-lived dark states >60 s should not interfere with our data analysis, and Qdot blinking behavior is not responsible for the observed endocytosis and exocytosis activity illustrated in Supplemental Videos S4 and S5, especially since two Qdots are being observed.
FIGURE 5:

Recycling GFP-Kv2.1-loopBAD channels are targeted to surface clusters. HEK cells expressing biotinylated GFP-Kv2.1-loopBAD were labeled with streptavidin-conjugated Qdot 605, unbound Qdots were removed, and the tissue culture dish was then returned to the tissue culture incubator for 1 h to allow Qdot-bound channel recycling to reach steady state. The basal membrane was then continuously imaged in TIRF at 2 Hz and 37°C for 30 min. (A) Qdots (red) bound to GFP-Kv2.1-loopBAD channels (green) at the beginning of the imaging period. (B, C) Qdot localization at the indicated times. (D) Qdot fluorescence intensity over time within the white ROI of C. The increase in intensity represents the delivery of two Qdot-labeled channels to the cluster, which is followed by endocytosis. This delivery and retrieval are illustrated in Supplemental Videos S4 and S5, respectively. (E) Algorithm-based detection of Qdot-bound Kv2.1 appearance and subsequent single-molecule diffusion. Sites of Qdot appearance, that is, Kv2.1 exocytosis, are indicated by the yellow crosses. Note that the subsequent single-particle tracks shown in red are confined to the Kv2.1 clusters.
Manual inspection of our image files to determine where Qdots appear at the cell surface is both labor-intensive and prone to investigator bias. Therefore we also used a multiple-target tracing algorithm (MTT; Sergé et al., 2008a, b) to detect the appearance of Qdots and track them until they were endocytosed. Figure 5E presents an example of this analysis, in which the sites of membrane delivery of three Qdots bound to Kv2.1 are indicated by the yellow crosses. The single-particle tracks starting at the insertion points show the Qdots remain confined within the cluster over the next 876 frames (126 s). Note that each Kv2.1 channel was confined to the cluster at which perimeter it is first observed. Using this algorithm, we found that 78%, n = 130, of recycling Qdot-labeled Kv2.1 channels appear at a cluster perimeter, and 87% of these remained trapped in the cluster for the duration of imaging or until endocytosis. Estimation bias can be present in both an automated algorithm and a human-based approach, but the bias in the two methods is very different (for a discussion of this topic, see Stitka, 1999). Therefore the use of both tools further substantiates the validity of the results. Manual and algorithm-based detection and tracking of recycling Kv2.1 channels independently support our hypothesis that the Kv2.1 surface clusters are sites for membrane insertion of Kv2.1 channels.
Kv2.1 insertion requires an intact actin cytoskeleton
We previously demonstrated a role for the actin cytoskeleton in Kv2.1 surface cluster maintenance (Tamkun et al., 2007). To examine the role of cortical actin in Kv2.1 delivery to the cell surface, we repeated the recycling experiments illustrated in Figure 5 in the presence of either 5 μM cytochalasin D or 125 nM swinholide A, 20 min each (unpublished data). Only 5% of Qdot-labeled Kv2.1 channels were delivered to clusters after swinholide A and 17% after cytochalasin D treatments, n = 58 and 41, respectively. In both cases the Qdots showed nonconfined diffusion immediately after appearance at the cell surface and were not trapped into a cluster. These experiments with actin inhibitors indicate that the trafficking machinery associated with Kv2.1 clusters is dependent on an intact actin cytoskeleton. The role of actin in exocytosis, although studied extensively, is not completely clear. In neuroendocrine cells the cortical actin appears to interfere with or restrict chromaffin granule fusion (Oheim and Stuhmer, 2000; Trifaró et al., 2008). In contrast, in PC12 cells actin polymerization enhances stimulated secretion (Ory and Gasman, 2011). Additional experiments are required to determine whether f-actin has a direct role in Kv channel exocytosis or whether the actin serves simply as a scaffold assembling the exocyst machinery. More important, these actin disruption experiments indicate that randomly occurring, long-lived Qdot dark states do not simply create the impression of delivery at a Kv2.1 surface cluster.
Kv1.4 also traffics to and from the Kv2.1 surface clusters
We next examined whether other membrane proteins also traffic to and from the cell surface at the Kv2.1 surface clusters. We studied membrane insertion and retrieval of Kv1.4, since this K+ channel can also be specifically biotinylated on the extracellular surface and labeled with a streptavidin-conjugated Qdot (Weigel et al., 2011). In contrast to Kv2.1, Kv1.4 has a homogeneous cell surface expression pattern with no apparent localization (Tamkun et al., 2007). When Kv1.4 is coexpressed with Kv2.1 it ignores the Kv2.1 surface clusters, being found at equal densities inside and outside these domains and freely diffusing across the Kv2.1 cluster perimeter (Tamkun et al., 2007). Thus, a priori, there is no reason to expect Kv1.4 to have any trafficking association with the Kv2.1 clusters.
HEK cells were transfected with GFP-Kv2.1, GFP-Kv1.4-loopBAD, and BirA biotin ligase, labeled with Qdots, returned to the incubator for 1 h after unbound Qdot removal, and then continually imaged with TIRF microscopy. As illustrated in Figure 6A, Qdot number slowly cycles as expected if there is continuous insertion and retrieval at the cell surface. Figure 6B indicates that the GFP-Kv2.1 clusters are readily detected against a background of the homogeneous GFP-Kv1.4 fluorescence and summarizes the appearance and disappearance of Kv1.4-bound Qdots in this one cell. The red asterisks indicate points of Kv1.4 insertion at a Kv2.1 cluster perimeter, and the white asterisks indicate where Kv1.4 internalization occurred. In this particular cell eight Qdots appeared and two Qdots disappeared at the cluster perimeter. Unlike the Kv2.1 channels, which usually become trapped within the cluster, Kv1.4 rapidly diffuses away, as is expected, given its homogeneous cell surface pattern. Manual analysis of Kv1.4-bound Qdot recycling in 11 cells indicated 91 ± 12% of Kv1.4-bound Qdots appeared at a cluster perimeter (n = 44), whereas 90 ± 14% of Kv1.4 Qdots were lost from the cell surface at the cluster perimeter (n = 11). Among this group of cells, only 20 ± 9.3% of the basal cell surface was occupied by the Kv2.1 clusters, again indicating that Kv1.4 delivery to the surface at the Kv2.1 clusters cannot be attributed to chance.
We again applied the MTT algorithm–based approach to insertion-site detection and subsequent single-particle tracking, as illustrated in Figure 6C. As expected, Kv1.4-bound Qdots appeared on the cell surface at the Kv2.1 cluster boundary. In contrast to the Kv2.1 mobility illustrated in Figure 5E, the postdelivery Kv1.4 diffusion track indicates free diffusion as opposed to trapping within the adjacent Kv2.1 cluster. Seventy-eight percent, n = 170, of the Kv1.4 channels appeared on the cell surface at the Kv2.1 cluster perimeter even though these two channels have no common localization pattern on the cell surface. Taken together, these data show that Kv1.4 is delivered to the same cell surface sites as Kv2.1 but lacks cluster retention. When Qdot-labeled Kv1.4 disappeared from the surface, endocytosis also occurred at the cluster perimeter just as described for Kv2.1. Thus two distinct Kv channels are trafficked to and from the cell surface at the same locations, suggesting that the Kv2.1 surface clusters represent general sites for membrane insertion and retrieval in HEK cells.
FIGURE 6:
Trafficking of Kv1.4 channels. (A) Qdot number over time. Note that Qdot number slowly cycles as expected if there is continuous insertion and retrieval at the cell surface. The high-frequency fluctuations are derived from the Qdot blinking, and the low-frequency fluctuations are from the insertion–retrieval events since the surface residence is >100 s. (B) Locations of Qdot arrival and removal at the surface. The red asterisks indicate points of Kv1.4 insertion near a Kv2.1 cluster perimeter, and the white asterisks indicate where Kv1.4 internalization occurred. (C) Algorithm-based detection of membrane insertion site for Kv1.4 (yellow cross) and subsequent single-molecule diffusion track (red). Unlike the Kv2.1 channels, which usually are retained within the cluster, Kv1.4 rapidly diffuses away.
Trafficking vesicles associate with and deliver Kv2.1 cargo to Kv2.1 surface clusters in hippocampal neurons
Whereas Kv2.1 expression and regulation are similar in HEK cells, cultured hippocampal neurons, and brain slice preparations (compare Figures 1 and 2; also see Misonou et al., 2004, 2005, 2008; Mohapatra and Trimmer, 2006), we confirmed that our findings in HEK cells were applicable to neurons. We detected numerous intracellular vesicles within neuronal soma and neurites, as illustrated in Supplemental Video S6. To determine whether these vesicles associated with the cell surface Kv2.1 clusters, we performed a TIR-based FRAP experiment with GFP-Kv2.1–transfected hippocampal neurons, as illustrated in Figure 7. Figure 7A shows soma- and neurite (arrow)-localized Kv2.1 clusters before the TIR-based partial photobleach. The boxed area within Figure 7A is enlarged in Figure 7B and shows tethered vesicles at the surface clusters after the partial photobleach (arrows). Note the large cluster on the soma outlined in white, which has three bound trafficking vesicles. Time-lapse imaging was then performed, and the recovery after 19 min is illustrated in Figure 7C. Quantitation of the fluorescence within the ROIs indicated in Figure 7C showed that delivery to cluster-containing regions occurred more rapidly, and in a stepwise pattern, as compared with fluorescence recovery within cluster-free soma or neurite membrane (see Figure 7D). As with HEK cells, this off-cluster recovery likely represents the unrestricted diffusion of nonclustered Kv2.1 from the top, and thus unbleached, region of the cell. The recovery occurring within what is likely the axon initial segment (Sarmiere et al., 2008) illustrates both transient vesicle tethering at 450 s and delivery of GFP Kv2.1 to the bleached cluster at 800 s. These events are also illustrated in Supplemental Video S7. Taken together, the data of Figure 7 and Supplemental Video S7 suggest that the Kv2.1 surface clusters on the neuronal soma and axon initial segment are preferred vesicle-docking and membrane fusion sites for cytoplasmic vesicles containing Kv2.1 and that Kv2.1 remains within these domains after delivery to the surface.
FIGURE 7:
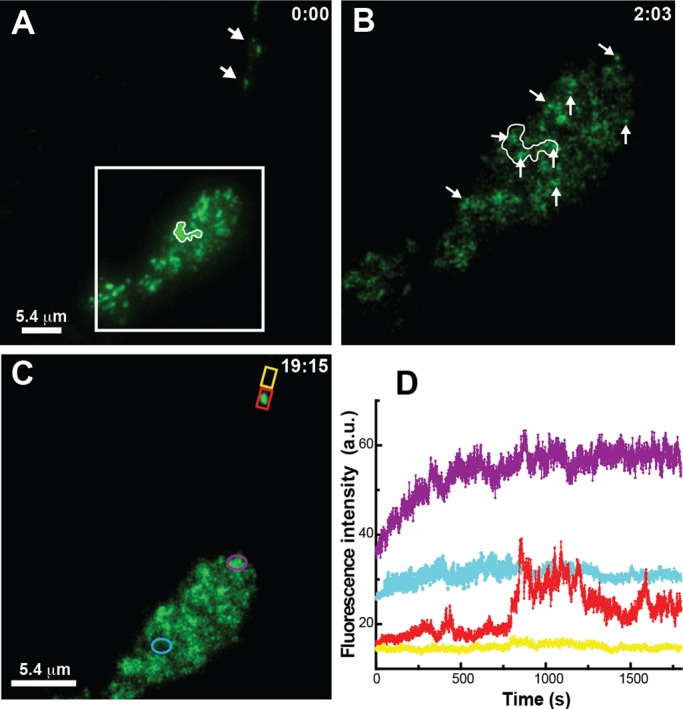
TIR-based FRAP analysis detects vesicular tethering and Kv2.1 delivery to Kv2.1 surface clusters in cultured hippocampal neurons. (A) Surface clusters before photobleach. The arrows highlight Kv2.1 clusters potentially in the axon initial segment. (B) Tethered vesicles (arrows) detected at the end of incomplete cluster photobleach within the white box shown in A. Note the three vesicles within the white outline of the large cluster present before bleach. (C) Fluorescence pattern after 19 min, 15 s of recovery. (D) Time course of fluorescence recovery within the regions indicated in C. The fluorescence recovery with the neurite cluster highlighted in red is contained in Supplemental Video S7.
Detection of single channel insertion sites in hippocampal neurons
The NeutrAvidin block approach with the GFP-Kv2.1-loop BAD construct to detect single channel insertion sites was repeated in neurons, as illustrated Figure 8. Figure 8A shows the lack of detectable Qdots at the beginning of the time series, indicative of little to no channel insertion at this time. One and a half minutes later, one bound Qdot was detected, as shown in Figure 8B. Figure 8C shows that by 11 min, 44 s, seven Qdots were observed, six within, and confined to, the Kv2.1 clusters visualized via the GFP fluorescence and one freely diffusing off clusters. Figure 8D summarizes the location of Qdot appearance over this time series. The red asterisks indicate Qdot appearances at cluster perimeters where the Qdot was immediately trapped within the Kv2.1 cluster. The yellow asterisks indicate appearances at a cluster perimeter where the Qdot was not retained within the cluster. Part of the Qdot incubation time series is contained within Supplemental Video S8. Examination of 59 Qdot appearances in seven neurons indicated that 90 ± 11% of insertion events per cell occurred at the Kv2.1 cluster perimeter.
FIGURE 8:
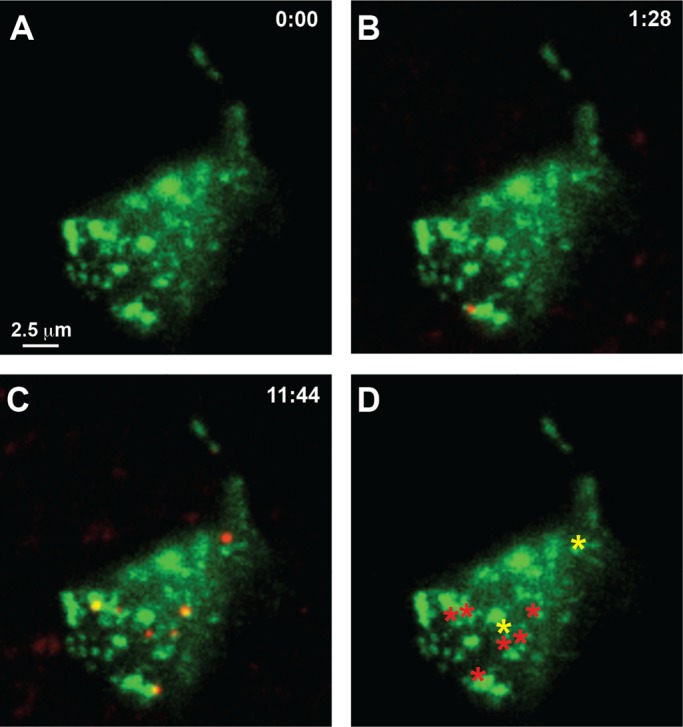
Detection of single channel insertion sites in hippocampal neurons. (A) Qdot labeling immediately after NeutrAvidin block of surface GFP-Kv2.1-loopBAD. (B, C) Qdot labeling observed at the indicated times during continuous spinning-disk imaging at 37°C and 1 Hz in the presence of a 1 nM Qdot solution. (D) Summary of sites at which Qdots first bound. The red asterisks indicate Qdot appearance at a cluster border and immediate confinement within the cluster. The yellow asterisks indicate channels arriving at cluster borders where they were not retained but diffused away to be trapped later.
Recycled Kv2.1 channels also insert at the surface clusters in hippocampal neurons
Neurons expressing biotinylated GFP-Kv2.1-loopBAD were labeled with a subsaturating concentration of Qdots, washed, and returned to the tissue culture incubator for 1–2 h to allow recycling to progress. The neurons were then continuously imaged in TIRF for up to 1 h. Representative results are shown in Figure 9. Figure 9, A–D, shows the surface distribution of Qdot-labeled Kv2.1 channels at the indicated imaging times after Qdot labeling and the following 1-h incubation during which internalization occurs. Many of these internalized Qdots reappeared on the cell surface during the illustrated time series. Note that some Kv2.1 clusters accumulated multiple Qdots, whereas others are Qdot-free, suggesting that Kv2.1 recycling back to the surface may prefer specific clusters. Supplemental Video S9 illustrates Qdot-bound Kv2.1 channels returning to the cell surface during a 2.5-min time span. Analysis of Kv2.1 recycling in seven neurons indicated that 45 of 53 Qdot-labeled Kv2.1 channels (85%) arrived back at the cell surface at a cluster perimeter. Three of these 45 Qdots were not retained within the cluster at which they arrived. In addition, eight Qdots were observed undergoing endocytosis at the Kv2.1 surface cluster perimeter.
FIGURE 9:
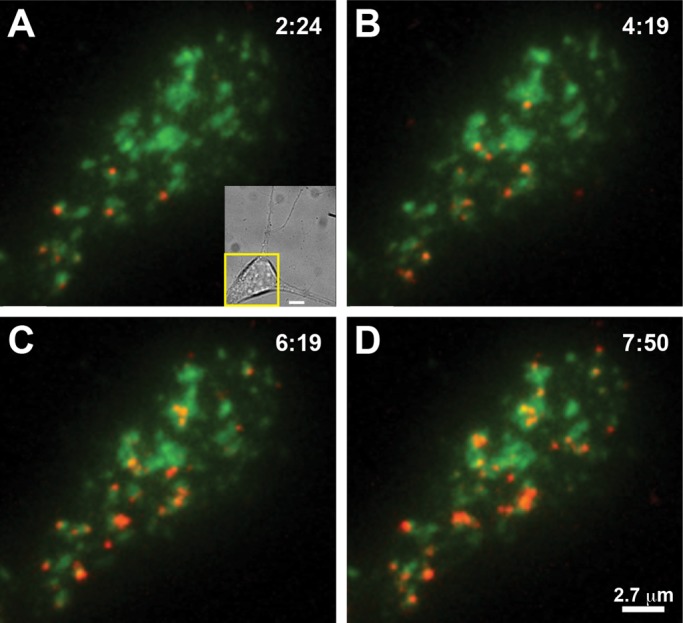
Recycling GFP-Kv2.1-loopBAD channels are targeted to surface clusters in the soma of cultured hippocampal neurons. Neurons expressing biotinylated GFP-Kv2.1-loopBAD (green) were labeled at low density with Qdot 605 (red), 1 nM for 5 min at 37°C, rinsed, and returned to the tissue culture incubator for 1 h to allow Qdot-bound channel recycling to reach a steady state. The basal membrane was then continuously imaged in TIRF at 2 Hz and 37°C for 30 min. Qdots that were internalized during the first hour are now likely recycling back to the cell surface. (A) GFP-Kv2.1-loopBAD channel clusters partially labeled with Qdots at the beginning of the imaging series. The inset shows a differential interference contrast image of this neuron, with the yellow box indicating the area imaged in TIRF. Bar, 5 μm. (B–D) Qdot localization at the indicated times. Note that by almost 8 min some Kv2.1 clusters have accumulated multiple Qdots, whereas others remain Qdot-free, indicating that Kv2.1 recycling back to the surface does not occur equally at all clusters.
DISCUSSION
Even though it is critical that ion channel surface densities and location be well controlled, little is known concerning the location of Kv channel delivery and retrieval on the cell surface. The Kv2.1 delayed rectifier channel regulates electrical activity in nerve and muscle (Vacher et al., 2008) and is unusual among voltage-gated K+ channels in that it localizes to micron-sized clusters on the cell surface of neurons and transfected HEK cells (Trimmer and Rhodes, 2004). Surprisingly, within these surface microdomains Kv2.1 is nonconducting at depolarized potentials. Because in neuroendocrine cells Kv2.1 is postulated to play a nonconducting role in SNARE-mediated membrane fusion, we tested the hypothesis that the surface clusters are specialized platforms involved in membrane trafficking to and from the cell surface. The TIR-based FRAP studies indicated that GFP-Kv2.1–containing cytoplasmic vesicles tether to and deliver cargo in a discrete manner at the Kv2.1 surface clusters in both transfected HEK cells and cultured hippocampal neurons. Qdot-based single-molecule imaging indicated that the delivery and surface retrieval of Kv2.1 occurs at the perimeter of the surface clusters. Overall, the majority of nascent and continuously recycling Kv2.1 channels in HEK cells and hippocampal neurons arrive at the cell surface within 0.5 μm of the cluster perimeter and are immediately confined within the cluster. The majority of Kv2.1 channel endocytosis in HEK cells occurred within this same region even though the clusters represented <20% of the cell surface. The nonclustering Kv1.4 channel also traffics to and from the plasma membrane at the Kv2.1 cluster perimeter, demonstrating that the Kv2.1 clusters represent cell surface platforms for the insertion and retrieval of other Kv channels. Taken together, these results, which are summarized in Figure 10, indicate that Kv2.1 clusters function as specialized cell surface microdomains involved in membrane protein trafficking.
FIGURE 10:
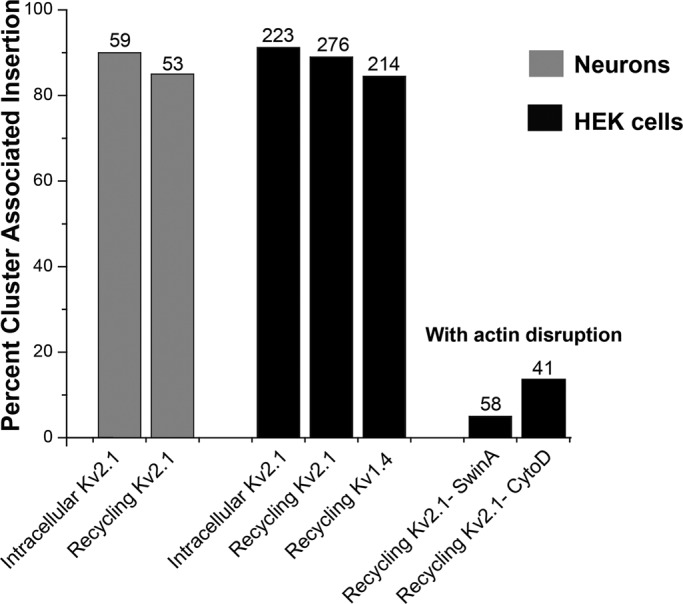
Summary of Kv channel membrane insertion. The percentage of total insertions that occurred at a Kv2.1 cluster is indicated. The gray bars represent neuronal insertions, and the black bars summarize the data from HEK cells. The insertion percentages determined by manual and automated detection were averaged. The numbers above each bar refer to the total number of surface insertions observed for the indicated condition.
Why use Kv2.1 clusters as cell surface trafficking platforms for Kv channels? We previously showed that although the Kv2.1 channels within the clusters are nonconducting, they are capable of sensing membrane voltage, in that the clustered channels produce gating currents in response to depolarization (O'Connell et al., 2010). Thus the Kv2.1 clusters could serve as voltage-sensing domains that link membrane fusion and/or endocytosis to neuronal electrical activity. Alternatively, the cluster-based trafficking could be influenced by extracellular events. For example, in α-motoneurons Kv2.1 clusters on the soma colocalize with large cholinergic synaptic inputs, suggesting that muscarinic receptor activation could modulate trafficking at these sites (Muennich and Fyffe, 2004). Most recently, a Kv2.1 beta subunit has been proposed that has the characteristics of a cell surface adhesion molecule (Peltola et al., 2011). Because this adhesion protein is concentrated within the Kv2.1 clusters on the neuronal surface, extracellular matrix interactions could also potentially modulate membrane protein delivery and retrieval. In addition, as noted earlier, the Kv2.1 clusters are regulated by ischemia in the intact brain, where ischemia blocks glutamate uptake by adjacent astrocytes, thereby activating extrasynaptic N-methyl-d-aspartate receptors, with the resulting Ca2+ influx inducing Kv2.1 declustering (Misonou et al., 2008; Mulholland et al., 2008). Altered neuronal membrane trafficking after an ischemic insult could be either damaging or neuroprotective.
The use of stable, reusable sites for exocytosis is not a commonly accepted idea. Notable exceptions are neuronal and immunological synapses, budding yeast, and polarized epithelium (Spiliotis and Nelson, 2003). However, exocyst localization has obvious advantages. 1) Static localization avoids the energy and time required to constantly reassemble the exocyst protein complex. 2) Trafficking vesicles can be delivered to stable sites along relatively static microtubules and then handed off to the cortical actin network. 3) Such localization should also provide for enhanced regulation, since GTPases, kinases, and so on can be stably incorporated into the exocyst complex. In adrenal chromaffin cells exocytic release does occur at specific reusable sites (Schroeder et al., 1994; Robinson et al., 1995, 1996; Wick et al., 1997). Of interest, Kv2.1 has been implicated in SNARE-mediated exocytosis in these neuroendocrine cells (Feinshreiber et al., 2009). Recent studies of Glut 4 trafficking suggest that specialized plasma membrane domains in adipose cells are used for Glut 4 delivery to the cell surface (Stenkula et al., 2010). Under control conditions the majority of vesicular Glut 4 is delivered to Glut 4 clusters on the cell surface, where it remains confined. The surface delivery that does occur at cluster-free membrane has the delivered Glut 4 being rapidly dispersed. Similar to what we describe here for Kv2.1, endocytosis of Glut 4 occurs primarily at the surface Glut4 clusters. Although in the past it was often assumed that endocytosis outside presynaptic membranes was randomly distributed over most cell surfaces (Ehrlich et al., 2004), the existence of stable “hot spots” for clathrin-mediated endocytosis is now accepted for many cell types (Spiliotis and Nelson, 2003; Bellve et al., 2006; McNiven, 2006; Cao et al., 2011). In agreement with this idea, clathrin puncta localize adjacent to the Kv2.1 clusters in transfected hippocampal neurons and HEK cells, as shown in Supplemental Figure S5, A and B. This association is especially strong in the neurons, where 76 ± 15% of the clathrin puncta were within 0.5 μm of the cluster perimeter, whereas the perimeter occupied only 8 ± 2% of the basal cell surface. Caveolae are involved in certain types of endocytic trafficking (Hayer et al., 2010), and caveolin 1 and 3 puncta also prefer the cluster perimeter, as illustrated in Supplemental Figure S5, C and D. In summary, localized sites for membrane protein insertion and retrieval may be much more common than previously believed, especially in neuronal cells.
Conclusion
Kv2.1 clusters represent ∼20% of the soma cell surface in hippocampal neurons, where their existence is regulated by neuronal activity and insult, even though the clustered channels are nonconducting (Misonou et al., 2004, 2005, 2008; O'Connell et al., 2010). In alpha motor neurons these microdomains exist at synaptic inputs, where they colocalize with muscarinic acetylcholine receptors and other proteins involved in cholinergic transmission (Muennich and Fyffe, 2004). The present work indicates that in transfected HEK cells and hippocampal neurons these structures are trafficking platforms involved in Kv channel movement to and from the cell surface. Whether a nonconducting function of Kv2.1 is to actually form these specialized cell surface microdomains involved in membrane protein trafficking is an area requiring further study. Nonetheless, the present work is the first to define stable cell surface sites for ion channel delivery and retrieval at the cell surface.
MATERIALS AND METHODS
Plasmid constructs, cell culture, and transfections
Fluorescent protein–tagged caveolins 1 and 3 have been used by other investigators (McEwen et al., 2008). Human clathrin light chain A subcloned into the mRFP-C1 and eGFP-C1 expression vectors was kindly provided by Santiago Di Pietro (Department of Biochemistry and Molecular Biology, Colorado State University, Fort Collins, CO). Fluorescent protein– and BAD-tagged Kv channel constructs have been used in the Tamkun laboratory (O'Connell and Tamkun, 2005; O'Connell et al., 2006, 2010; Tamkun et al., 2007) and are based on the Living Colors vector system (Clontech, Mountain View, CA). The BAD sequence is contained within the extracellular domain between the first and second transmembrane domains of both Kv1.4 and Kv2.1 (Tamkun et al., 2007; Weigel et al., 2011). When necessary, the BirA biotin ligase in the pSec vector was cotransfected with the Kv channels to achieve biotinylation during channel biosynthesis, presumably within the endoplasmic reticulum lumen (Tamkun et al., 2007). HEK 293 cells (passage 38-45; American Type Culture Collection, Manassas, VA) were transfected with 1–3 μg of Kv2.1-expressing DNA and 1 μg of pSec BirA using a Bio-Rad Genepulser Xcell (Bio-Rad Laboratories, Hercules, CA) with a 0.2-cm-gap cuvette and a single 110-V, 25-ms pulse. Transfected cells were plated on glass-bottom 35 mm dishes (MatTek, Ashland, MA) that had been previously Matrigel coated and covered in DMEM plus 10% fetal bovine serum. HEK cells were imaged within 24 h of electroporation in HEK physiological imaging saline consisting of (in mM) 146 NaCl, 4.7 KCl, 2.5 CaCl2, 0.6 MgSO4, 1.6 NaHCO3, 0.15 NaH2PO4, 0.1 ascorbic acid, 8 glucose, and 20 4-(2-hydroxyethyl)-1-piperazineethanesulfonic acid (HEPES), pH 7.4 (imaging saline). Neurons from cryopreserved E18 rat hippocampal dissociations were plated at a density of ∼15,000–30,000 cells/cm2 on poly-d-lysine–coated glass-bottom dishes (MatTek) and cultured in glial cell–conditioned neurobasal medium containing B27 supplement (Invitrogen, Carlsbad, CA) as previously described (O'Connell et al., 2006). Animals were deeply anesthetized with isoflurane and killed by decapitation according to a protocol approved by the Institutional Animal Care and Use Committee of Colorado State University. Transfections were performed after 6–8 d in culture with 2.0 μl of Lipofectamine 2000 (Invitrogen) and 0.75 μg of Kv2.1-expressing plasmid DNA in 100 μl of OptiMem (Invitrogen) according to the manufacturer's directions. When necessary, 0.5 μg of pSec BirA–expressing DNA was cotransfected. Two hours after transfection, the culture medium was replaced with fresh neurobasal/B27 media. Neurons were imaged 24–48 h posttransfection in neuronal imaging saline consisting of (in mM) 126 NaCl, 4.7 KCl, 2.5 CaCl2, 0.6 MgSO4, 0.15 NaH2PO4, 0.1 ascorbic acid, 8 glucose, and 20 HEPES, pH 7.4.
Antibody and quantum dot labeling
Neurons expressing GFP-Kv2.1 were fixed in 4% formaldehyde and 4% sucrose in phosphate-buffered saline (PBS) for 15 min, incubated in 0.5% 3-[(3-cholamidopropyl)dimethylammonio]-1-propanesulfonate in PBS for 5 min, blocked in 5% nonfat milk and 1% goat serum in PBS for 1 h, and labeled with the indicated antibody diluted in PBS containing 1% bovine serum albumin (BSA). A mouse monoclonal anti–MAP-2 antibody (1:2000 dilution, Sigma-Aldrich, St. Louis, MO) was used in conjunction with a goat anti-mouse secondary antibody conjugated to Alexa 594 (Molecular Probes, Invitrogen) diluted 1:1000 in 1% BSA PBS. Live HEK cells expressing GFP-Kv2.1-HA were labeled with Alexa 594–conjugated anti-HA antibody (1:1000 dilution in 1% BSA containing HEK imaging saline) in order to detect and monitor internalization of surface GFP-Kv2.1-HA. HEK cells were labeled for 5–10 min at 37°C before being rinsed and imaged at 37°C.
For quantum dot labeling, cells expressing either BAD-containing Kv1.4 or Kv2.1 constructs were first incubated in 1% BSA (immunoglobulin G/fatty acid-free; Sigma-Aldrich) in imaging saline for 5 min and then incubated for 5 min with 0.1 nM streptavidin-conjugated quantum dots (Qdot 605 or Qdot 655 from Invitrogen) in imaging saline containing 1% BSA. The BSA was essential to minimize nonspecific Qdot absorption to the cell surface and coverslip. The Qdot concentration and incubation time were empirically determined to minimize both nonspecific and specific Qdot binding, for it is increasingly difficult to track individual Qdots as the cell surface Qdot number increases. The cells were then rinsed extensively with imaging saline and either returned to the tissue culture incubator or placed on a heated microscope stage. All incubations were performed at 37°C. Controls for nonspecific Qdot binding included imaging cells expressing GFP-Kv2.1-HA that had been carried through the entire Qdot labeling protocol or using cells expressing GFP-Kv2.1-loopBAD that were not cotransfected with the BirA biotin ligase.
Confocal and TIRF microscopy
HEK cells and neurons expressing fluorescent protein–tagged constructs were imaged with one of five microscope systems, depending on the experiment performed. Standard 3D imaging, 0.3-μm z-steps, was performed with an Olympus FV1000 confocal microscope (Olympus, Tokyo, Japan) equipped with spectral detectors and the SIM Scanner. GFP was excited using the 488-nm line of an argon laser, and emission was collected using the variable bandpass filter set at 500–530 nm. Alexa 594 fluorophores were detected using a 543-nm HeNe laser with the variable bandpass filter set at 600–630 nm. A 60×/1.4 numerical aperture (NA) oil immersion objective was used for imaging, and the pinhole diameter was set for the appropriate Airy unit when using one laser. An intermediate pinhole diameter was used when two fluorophores were being detected simultaneously. For each image, the detector voltage was adjusted as necessary to utilize the full 12-bit range.
Experiments examining the insertion sites of intracellular, as opposed to recycling, channels were performed on one of two Olympus microscope systems, each equipped with a Yokogawa CSU-22 spinning-disk head. The confocal nature of these systems, combined with the charge-coupled device (CCD) camera sensitivity, was required to image cells bathed in the 1 nM Qdot solution required by the insertion site assay described later. The first system is built around an Olympus IX81 stand using a 100×/1.4 NA Plan Apo objective and a 1024 × 1024 Cascade electron-multiplying CCD (EMCDD) camera (Princeton Instruments, Trenton, NJ) operated at −80°C, 2 × 2 binning, and maximum electronic gain. Temperature control was via a forced air incubation chamber surrounding the stage and objectives. The second spinning-disk confocal scope is built around an Olympus IX71 stand equipped with an Olympus 100×/1.45 NA, TIRFM Plan Apo objective and an Andor 512 × 512 iXon DU-897 EMCCD camera (Andor South Windsor, CT) operated at –85°C and an electronic gain of 300. Temperature control here was via a Zeiss/PeCon stage-heating insert and objective heater (PeCon, Erbach, Germany). Both systems use acousto-optic tunable filter (AOTF)–controlled lasers and standard dichroic mirror and filter sets for detecting fluorescent proteins and Qdots. Exposure times varied between 20 and 100 ms, using frame rates of 0.5–20 Hz.
Two different TIRF imaging systems were used to detect Qdots bound to Kv2.1 and Kv1.4 channels. The first is an Olympus IX71 inverted microscope using a 100×/1.45 NA, Plan Apo TIRFM objective and a custom-designed TIRF illuminator with laser light delivered into the microscope through free space. A 473-nm laser line with 2.5 mW of power after the objective was used to excite both GFP and Qdots. An Andor 1024 × 1024 iXon DU-888 EMCCD camera was operated at −85°C and an electronic gain of 300. Simultaneous two-color imaging was achieved by optically splitting the image into two halves, each corresponding to a separate color, using an Optosplit (Cairn, Ireland). Both the tissue culture dish and the objective were maintained at 37°C using heating elements from Bioptechs (Butler, PA). Videos (>5000 frames) were acquired using Andor IQ software at an average frame rate of eight frames/s. The second TIRF system is an Eclipse Ti Perfect-Focus–equipped TIRF/widefield fluorescence microscope (Nikon, Melville, NY) equipped with AOTF-controlled 405-, 488-, and 543-nm diode lasers, 100 mW each, and an Intensilight widefield light source. A 100×/1.49 NA PlanApo TIRF objective was used for image acquisition. Emission was collected through a Lambda 10-3 filter wheel (Sutter, Novato, CA) containing the appropriate bandpass filters. The stage and objective are temperature controlled via a Zeiss/PeCon stage-heating insert and objective heater at 37°C. This microscope is equipped with the Andor 512 × 512 iXon DU-897 EMCCD camera,. For all imaging experiments, the cells were imaged for <1 h. However, no changes in the Kv2.1 surface expression were observed after up to 3 h in imaging saline at 37°C.
To view the activity of submembranous Kv2.1-containing trafficking vesicles, we used a TIR-based photobleach approach with the Nikon TIRF system. GFP-Kv2.1– or YFP-Kv2.1–expressing HEK cells or hippocampal neurons in close contact with the bottom of the dish were bleached in TIRF to decrease the intensity of the cell surface Kv2.1-containing clusters. A 1-min bleach at 100% 488-nm laser power was performed in triplicate with a 1-min delay between each bleach. These three steps reduced the intensity of both the immobile Kv2.1 clusters and the free, nonclustered Kv2.1 diffusing into the basal surface from the top of the cell. The bleached cells were imaged at 1–3% 488-nm laser power for up to 45 min to capture vesicular activity. Because intracellular vesicles are mobile and thus not consistently within the TIRF field, they are less susceptible to bleach than are the cell surface clusters. Image sequences were analyzed in Volocity 6.0 (PerkinElmer, Waltham, MA), and ROI-specific fluorescence intensity changes over time were quantitated and background subtracted. Cytoplasmic vesicles were defined by their size, fluorescence intensity, and trafficking motility (see Supplemental Figure S1 and Supplemental Videos S1 and S6).
Detection of intracellular channel insertion into the plasma membrane
The Qdot-based assay to detect the location of Kv2.1 cell surface insertion with single-molecule sensitivity involved first incubating cells expressing biotinylated GFP-Kv2.1-loop BAD with 1 μM NeutrAvidin for 5 min in imaging saline containing 1% BSA. NeutrAvidin was used to saturate the biotinylated Kv2.1 channels on the surface because it has less nonspecific binding activity than streptavidin, and thus the excess NeutrAvidin is easier to remove in the following washes. After four or five washes in imaging saline containing 1% BSA, the cells were imaged in the presence of 1 nM Qdot 605 using a spinning-disk confocal microscope. This Qdot concentration was required to minimize nonspecific binding during the relatively long imaging periods. Unbound, freely diffusing Qdots move too rapidly to be effectively detected under our imaging conditions. As Kv2.1 channels that were intracellular at the time of NeutrAvidin binding insert into the cell surface, they become Qdot labeled, and the immobilized Qdot is now detected. Thus spontaneous Qdot appearance during the continuous imaging represents Qdot binding to a recently inserted channel. Supplemental Figure S2 shows that the 1 μM NeutrAvidin block is highly effective and that Qdot binding after this block requires temperatures that permit intracellular trafficking and exocytosis (Vizi, 1998; Zhang and Jackson, 2008; Hewlett et al., 2011). Supplemental Figure S3 indicates that Qdots bind cell surface Kv2.1 soon after being added to the culture dish, with ∼75 s required to reach 50% binding. Qdot binding during the insertion site assay is likely to occur much faster since the cells are continuously bathed in a Qdot solution as opposed to the dots being added to dishes as in Supplemental Figure S3. Because the median distance covered by a nonclustered Kv2.1 channel in 40 s is 375 nm, the inserted Kv2.1 channels are unlikely to diffuse far from their site of membrane insertion before being bound by a Qdot (Weigel et al., 2011).
Detection of channel recycling
The dissociation rate of biotin–streptavidin binding is relatively slow, with 4 and 25% dissociation over 1 h at 37°C for biotin conjugates or biotin, respectively (Howarth et al., 2006; Chivers et al., 2010). This slow dissociation rate, combined with the lack of photobleaching and low potential for biological degradation (Jaiswal et al., 2004; Jaiswal and Simon, 2004), makes Qdot labeling useful for tracking individual Kv channels to and from the cell surface. HEK cells and neurons expressing biotinylated channels were labeled with Qdots at low efficiency as described earlier and then returned to the tissue culture incubator for 1–2 h to allow endocytosis and recycling to the cell surface to approach steady state. The cells were then removed from the incubator and imaged using one of the TIRF systems described previously. Spontaneous Qdot appearance represents a cytoplasmic channel previously on the cell surface now entering the 100-nm TIRF field, that is, approaching or inserting into the membrane. Spontaneous loss of a cell surface Qdot represents a channel undergoing endocytosis.
Quantitation of Qdot blinking behavior
Blinking is a well-known characteristic of semiconductor nanocrystals. In our previous single-channel-tracking work trajectories of the same dot were connected when the particle positions before and after blinking did not change by more than a set value (Weigel et al., 2011). Less appreciated, and more problematic for the present study, is the fact that Qdots can enter relatively long-lived dark states during which no light emission is detected (Yao et al., 2005). Because many of the experiments presented here rely on Qdot appearance or disappearance as an indication of exocytosis or endocytosis, the possibility of Qdots entering or exiting such a dark state was a serious concern. To address this issue, we examined the distribution of dark-state lifetimes under our imaging conditions and with the Qdot reagents used in this study. Because Qdot blinking behavior is sensitive to the environment (Yao et al., 2005), we chose to immobilize Qdots on the HEK cell surface as opposed to glass. HEK cells were incubated with a 1 nM Qdot imaging saline solution for 5 min at 37°C. This solution lacked the 1% BSA used to inhibit nonspecific binding as described earlier. Therefore the cells had immobile Qdots adhered nonspecifically to the cell surface, and imaging these over time provided a quantitative measurement of Qdot blinking behavior and dark-state lifetimes under the imaging conditions used. The nonspecifically bound Qdots were imaged for 30 min at 2–10 Hz using laser intensities typical for the experiments presented here. The distribution of dark-state durations is presented in Supplemental Figure S4 in addition to three examples of blinking and/or dark-state behavior. Dark states lasting >60 s were rare, representing only 3% (14 of 460) of total blinking events of >3 s (22,458 s of total Qdot imaging).
Actin disruption
The actin-depolymerizing agents cytochalasin D and swinholide A were used to disturb the cytoskeletal network. Both actin inhibitors were dissolved in dimethyl sulfoxide (Sigma-Aldrich) and added while imaging to a final concentration of 125 nM or 5 μM for swinholide A and cytochalasin D, respectively. Cells were imaged up to 20 min after drug application.
Image presentation and data analysis
Images were imported into Volocity 6.0 software for contrast enhancement, 3D reconstruction, object detection/tracking, and quantitative analysis. Numerical data were exported into OriginPro 8.5 (OriginLab, Northampton, MA) for further analysis and curve fitting. Image sequences were analyzed for the location of Qdot appearance, that is, membrane insertion, or disappearance, that is, endocytosis, by both manual inspection and an automated analysis. In the case of the manual analysis, Qdots that appeared or disappeared within 2 μm of the cell perimeter were not counted due to concerns that they might be just entering or leaving the basal cell surface. Qdots were classified as entering or leaving the surface at a Kv2.1 cluster if the appearance or disappearance occurred within 0.5 μm of the cluster perimeter. Potential dark states of <60 s were deemed most problematic and were dealt with as follows. Only Qdot appearances that occurred >60 s after the disappearance of a Qdot within a 1-μm radius were counted as indicating surface insertion, as opposed to representing detection of the same Qdot emerging from a dark state. The same logic applied to Qdots that disappeared only to be followed by reappearance in <60 s at <1 μm away, that is, these Qdots were not counted as being internalized by the cell.
For the automated detection and tracking of Qdot-labeled Kv2.1 and Kv1.4 channels we used an MTT approach based on the algorithm developed by Sergé et al. (2008a, b). This analysis provides the positions and intensities for each frame of targets throughout the entire video duration, allowing for determination of the time and location of newly arriving channels to the cell surface. Using the results of the MTT algorithm, we categorized Qdot-tagged Kv1.4 and Kv2.1 channels that arrived at the cell surface after a delay relative to the start of the image sequence (to allow for potential Qdot dark states) as arriving at a cluster or not. This classification was determined by overlaying the individual Qdot-tagged channel signal with the ensemble GFP channel signal along with the MTT algorithm trajectories. If the channel arrived within one pixel of cluster perimeter (1 pixel = 130 nm), it was categorized as arriving at a cluster, and similarly for channels not arriving at a cluster. Channels that appeared to diffuse from the side of the cell to the basal surface were discarded. The percentages of recycling Kv2.1 channels inserting at a Kv2.1 cluster perimeter were 75 and 76% for the 25- and 60-s delays, respectively. Because these numbers are similar, Qdot dark states are unlikely to contribute significantly to this automated insertion-site detection.
Supplementary Material
Acknowledgments
This work was supported by the National Institutes of Health under Grants R01GM84136 and R01GM084136S1 awarded to M.M.T. and by the National Science Foundation under Grant 0956714 awarded to D.K. We thank Noreen Reist and Greg Amberg for review of the manuscript and Santiago Di Pietro for helpful discussions.
Abbreviations used:
- BirA
biotin ligase
- HA
hemagglutinin
- MAP2
microtubule-associated protein 2
- MTT
multiple-target tracing
- Qdot
quantum dot
- TIR
total internal reflection
- TIRF
total internal reflection fluorescence
Footnotes
This article was published online ahead of print in MBoC in Press (http://www.molbiolcell.org/cgi/doi/10.1091/mbc.E12-01-0047) on May 30, 2012.
REFERENCES
- Amberg GC, Santana LF. Kv2 channels oppose myogenic constriction of rat cerebral arteries. Am J Physiol Cell Physiol. 2006;291:C348–C356. doi: 10.1152/ajpcell.00086.2006. [DOI] [PubMed] [Google Scholar]
- Bellve KD, Leonard D, Standley C, Lifshitz LM, Tuft RA, Hayakawa A, Corvera S, Fogarty KE. Plasma membrane domains specialized for clathrin-mediated endocytosis in primary cells. J Biol Chem. 2006;281:16139–16146. doi: 10.1074/jbc.M511370200. [DOI] [PubMed] [Google Scholar]
- Cao H, Krueger EW, McNiven MA. Hepatocytes internalize trophic receptors at large endocytic “hot spots.”. Hepatology. 2011;54:1819–1829. doi: 10.1002/hep.24572. [DOI] [PMC free article] [PubMed] [Google Scholar]
- Chivers CE, Crozat E, Chu C, Moy VT, Sherratt DJ, Howarth M. A streptavidin variant with slower biotin dissociation and increased mechanostability. Nat Methods. 2010;7:391–393. doi: 10.1038/nmeth.1450. [DOI] [PMC free article] [PubMed] [Google Scholar]
- Du J, Haak LL, Phillips-Tansey E, Russell JT, McBain CJ. Frequency-dependent regulation of rat hippocampal somato-dendritic excitability by the K+ channel subunit Kv2.1. J Physiol. 2000;522:19–31. doi: 10.1111/j.1469-7793.2000.t01-2-00019.xm. [DOI] [PMC free article] [PubMed] [Google Scholar]
- Ehrlich M, Boll W, Van Oijen A, Hariharan R, Chandran K, Nibert ML, Kirchhausen T. Endocytosis by random initiation and stabilization of clathrin-coated pits. Cell. 2004;118:591–605. doi: 10.1016/j.cell.2004.08.017. [DOI] [PubMed] [Google Scholar]
- Feinshreiber L, Singer-Lahat D, Ashery U, Lotan I. Voltage-gated potassium channel as a facilitator of exocytosis. Ann NY Acad Sci. 2009;1152:87–92. doi: 10.1111/j.1749-6632.2008.03997.x. [DOI] [PubMed] [Google Scholar]
- Feinshreiber L, et al. Non-conducting function of the Kv2.1 channel enables it to recruit vesicles for release in neuroendocrine and nerve cells. J Cell Sci. 2010;123:1940–1947. doi: 10.1242/jcs.063719. [DOI] [PubMed] [Google Scholar]
- Guan D, Horton LR, Armstrong WE, Foehring RC. Postnatal development of A-type and Kv1- and Kv2-mediated potassium channel currents in neocortical pyramidal neurons. J Neurophysiol. 2011;105:2976–2988. doi: 10.1152/jn.00758.2010. [DOI] [PMC free article] [PubMed] [Google Scholar]
- Hayer A, Stoeber M, Ritz D, Engel S, Meyer HH, Helenius A. Caveolin-1 is ubiquitinated and targeted to intralumenal vesicles in endolysosomes for degradation. J Cell Biol. 2010;191:615–629. doi: 10.1083/jcb.201003086. [DOI] [PMC free article] [PubMed] [Google Scholar]
- Hewlett L, Zupancˇicˇ G, Mashanov G, Knipe L, Ogden D, Hannah MJ, Carter T. Temperature-dependence of Weibel-Palade body exocytosis and cell surface dispersal of von Willebrand factor and its propolypeptide. PLoS ONE. 2011;6:e27314. doi: 10.1371/journal.pone.0027314. [DOI] [PMC free article] [PubMed] [Google Scholar]
- Howarth M, Chinnapen DJ-F, Gerrow K, Dorrestein PC, Grandy MR, Kelleher NL, El-Husseini A, Ting AY. A monovalent streptavidin with a single femtomolar biotin binding site. Nat Methods. 2006;3:267–273. doi: 10.1038/NMETHXXX. [DOI] [PMC free article] [PubMed] [Google Scholar]
- Hulme JT, Coppock EA, Felipe A, Martens JR, Tamkun MM. Oxygen sensitivity of cloned voltage-gated K(+) channels expressed in the pulmonary vasculature. Circ Res. 1999;85:489–497. doi: 10.1161/01.res.85.6.489. [DOI] [PubMed] [Google Scholar]
- Jacobson DA, Kuznetsov A, Lopez JP, Kash S, Ammala CE, Philipson LH. Kv2.1 ablation alters glucose-induced islet electrical activity, enhancing insulin secretion. Cell Metab. 2007;6:229–235. doi: 10.1016/j.cmet.2007.07.010. [DOI] [PMC free article] [PubMed] [Google Scholar]
- Jaiswal JK, Goldman ER, Mattoussi H, Simon SM. Use of quantum dots for live cell imaging. Nat Methods. 2004;1:73–78. doi: 10.1038/nmeth1004-73. [DOI] [PubMed] [Google Scholar]
- Jaiswal JK, Simon SM. Potentials and pitfalls of fluorescent quantum dots for biological imaging. Trends Cell Biol. 2004;14:497–504. doi: 10.1016/j.tcb.2004.07.012. [DOI] [PubMed] [Google Scholar]
- Jenkins PM, et al. Subunit-dependent axonal trafficking of distinct alpha heteromeric potassium channel complexes. J Neurosci. 2011;31:13224–13235. doi: 10.1523/JNEUROSCI.0976-11.2011. [DOI] [PMC free article] [PubMed] [Google Scholar]
- Kihira Y, Hermanstyne TO, Misonou H. Formation of heteromeric Kv2 channels in mammalian brain neurons. J Biol Chem. 2010;285:15048–15055. doi: 10.1074/jbc.M109.074260. [DOI] [PMC free article] [PubMed] [Google Scholar]
- Kirchhausen T. Imaging endocytic clathrin structures in living cells. Trends Cell Biol. 2009;19:596–605. doi: 10.1016/j.tcb.2009.09.002. [DOI] [PMC free article] [PubMed] [Google Scholar]
- Kodirov SA, Brunner M, Nerbonne JM, Buckett P, Mitchell GF, Koren G. Attenuation of I(K,slow1) and I(K,slow2) in Kv1/Kv2DN mice prolongs APD and QT intervals but does not suppress spontaneous or inducible arrhythmias. Am J Physiol Heart Circ Physiol. 2004;286:H368–H374. doi: 10.1152/ajpheart.00303.2003. [DOI] [PubMed] [Google Scholar]
- Leung YM, Kang Y, Gao X, Xia F, Xie H, Sheu L, Tsuk S, Lotan I, Tsushima RG, Gaisano HY. Syntaxin 1A binds to the cytoplasmic C terminus of Kv2.1 to regulate channel gating and trafficking. J Biol Chem. 2003;278:17532–17538. doi: 10.1074/jbc.M213088200. [DOI] [PubMed] [Google Scholar]
- MacDonald PE, et al. Synaptosome-associated protein of 25 kilodaltons modulates Kv2.1 voltage-dependent K(+) channels in neuroendocrine islet beta-cells through an interaction with the channel N terminus. Mol Endocrinol. 2002;16:2452–2461. doi: 10.1210/me.2002-0058. [DOI] [PubMed] [Google Scholar]
- McEwen DP, Li Q, Jackson S, Jenkins PM, Martens JR. Caveolin regulates kv1.5 trafficking to cholesterol-rich membrane microdomains. Mol Pharmacol. 2008;73:678–685. doi: 10.1124/mol.107.042093. [DOI] [PubMed] [Google Scholar]
- McNiven MA. Big gulps: specialized membrane domains for rapid receptor-mediated endocytosis. Trends Cell Biol. 2006;16:487–492. doi: 10.1016/j.tcb.2006.08.007. [DOI] [PubMed] [Google Scholar]
- Misonou H, Mohapatra DP, Menegola M, Trimmer JS. Calcium- and metabolic state-dependent modulation of the voltage-dependent Kv2.1 channel regulates neuronal excitability in response to ischemia. J Neurosci. 2005;25:11184–11193. doi: 10.1523/JNEUROSCI.3370-05.2005. [DOI] [PMC free article] [PubMed] [Google Scholar]
- Misonou H, Mohapatra DP, Park EW, Leung V, Zhen D, Misonou K, Anderson AE, Trimmer JS. Regulation of ion channel localization and phosphorylation by neuronal activity. Nat Neurosci. 2004;7:711–718. doi: 10.1038/nn1260. [DOI] [PubMed] [Google Scholar]
- Misonou H, Thompson SM, Cai X. Dynamic regulation of the Kv2.1 voltage-gated potassium channel during brain ischemia through neuroglial interaction. J Neurosci. 2008;28:8529–8538. doi: 10.1523/JNEUROSCI.1417-08.2008. [DOI] [PMC free article] [PubMed] [Google Scholar]
- Mohapatra DP, Trimmer JS. The Kv2.1 C terminus can autonomously transfer Kv2.1-like phosphorylation-dependent localization, voltage-dependent gating, and muscarinic modulation to diverse Kv channels. J Neurosci. 2006;26:685–695. doi: 10.1523/JNEUROSCI.4620-05.2006. [DOI] [PMC free article] [PubMed] [Google Scholar]
- Muennich EAL, Fyffe REW. Focal aggregation of voltage-gated, Kv2.1 subunit-containing, potassium channels at synaptic sites in rat spinal motoneurones. J Physiol. 2004;554:673–685. doi: 10.1113/jphysiol.2003.056192. [DOI] [PMC free article] [PubMed] [Google Scholar]
- Mulholland PJ, Carpenter-Hyland EP, Hearing MC, Becker HC, Woodward JJ, Chandler LJ. Glutamate transporters regulate extrasynaptic NMDA receptor modulation of Kv2.1 potassium channels. J Neurosci. 2008;28:8801–8809. doi: 10.1523/JNEUROSCI.2405-08.2008. [DOI] [PMC free article] [PubMed] [Google Scholar]
- O'Connell KM, Loftus R, Tamkun MM. Localization-dependent activity of the Kv2.1 delayed-rectifier K+ channel. Proc Natl Acad Sci USA. 2010;107:12351–12356. doi: 10.1073/pnas.1003028107. [DOI] [PMC free article] [PubMed] [Google Scholar]
- O'Connell KM, Rolig AS, Whitesell JD, Tamkun MM. Kv2.1 potassium channels are retained within dynamic cell surface microdomains that are defined by a perimeter fence. J Neurosci. 2006;26:9609–9618. doi: 10.1523/JNEUROSCI.1825-06.2006. [DOI] [PMC free article] [PubMed] [Google Scholar]
- O'Connell KM, Tamkun MM. Targeting of voltage-gated potassium channel isoforms to distinct cell surface microdomains. J Cell Sci. 2005;118:2155–2166. doi: 10.1242/jcs.02348. [DOI] [PubMed] [Google Scholar]
- O'Connell KMS, Whitesell JD, Tamkun MM. Localization and mobility of the delayed-rectifier K+ channel Kv2.1 in adult cardiomyocytes. Am J Physiol Heart Circ Physiol. 2008;294:H229–H237. doi: 10.1152/ajpheart.01038.2007. [DOI] [PubMed] [Google Scholar]
- Oheim M, Stuhmer W. Tracking chromaffin granules on their way through the actin cortex. Eur Biophys J. 2000;29:67–89. doi: 10.1007/s002490050253. [DOI] [PubMed] [Google Scholar]
- Ory S, Gasman S. Rho GTPases and exocytosis: what are the molecular links? Semin Cell Dev Biol. 2011;22:27–32. doi: 10.1016/j.semcdb.2010.12.002. [DOI] [PubMed] [Google Scholar]
- Pal S, Hartnett KA, Nerbonne JM, Levitan ES, Aizenman E. Mediation of neuronal apoptosis by Kv2.1-encoded potassium channels. J Neurosci. 2003;23:4798–4802. doi: 10.1523/JNEUROSCI.23-12-04798.2003. [DOI] [PMC free article] [PubMed] [Google Scholar]
- Pal SK, Takimoto K, Aizenman E, Levitan ES. Apoptotic surface delivery of K+ channels. Cell Death Differ. 2006;13:661–667. doi: 10.1038/sj.cdd.4401792. [DOI] [PMC free article] [PubMed] [Google Scholar]
- Patel AJ, Lazdunski M, Honore E. Kv2.1/Kv9.3, a novel ATP-dependent delayed-rectifier K+ channel in oxygen-sensitive pulmonary artery myocytes. EMBO J. 1997;16:6615–6625. doi: 10.1093/emboj/16.22.6615. [DOI] [PMC free article] [PubMed] [Google Scholar]
- Peltola MA, Kuja-Panula J, Lauri SE, Taira T, Rauvala H. AMIGO is an auxiliary subunit of the Kv2.1 potassium channel. EMBO Rep. 2011;12:1293–1299. doi: 10.1038/embor.2011.204. [DOI] [PMC free article] [PubMed] [Google Scholar]
- Petrini EM, Lu J, Cognet L, Lounis B, Ehlers MD, Choquet D. Endocytic trafficking and recycling maintain a pool of mobile surface AMPA receptors required for synaptic potentiation. Neuron. 2009;63:92–105. doi: 10.1016/j.neuron.2009.05.025. [DOI] [PMC free article] [PubMed] [Google Scholar]
- Robinson IM, Finnegan JM, Monck JR, Wightman RM, Fernandez JM. Colocalization of calcium entry and exocytotic release sites in adrenal chromaffin cells. Proc Natl Acad Sci USA. 1995;92:2474–2478. doi: 10.1073/pnas.92.7.2474. [DOI] [PMC free article] [PubMed] [Google Scholar]
- Robinson IM, Yamada M, Carrion-Vazquez M, Lennon VA, Fernandez JM. Specialized release zones in chromaffin cells examined with pulsed-laser imaging. Cell Calcium. 1996;20:181–201. doi: 10.1016/s0143-4160(96)90106-2. [DOI] [PubMed] [Google Scholar]
- Sarmiere PD, Weigle CM, Tamkun MM. The Kv2.1 K+ channel targets to the axon initial segment of hippocampal and cortical neurons in culture and in situ. BMC Neurosci. 2008;9:112. doi: 10.1186/1471-2202-9-112. [DOI] [PMC free article] [PubMed] [Google Scholar]
- Schroeder TJ, Jankowski JA, Senyshyn J, Holz RW, Wightman RM. Zones of exocytotic release on bovine adrenal medullary cells in culture. J Biol Chem. 1994;269:17215–17220. [PubMed] [Google Scholar]
- Sergé A, Bertaux N, Rigneault H, Marguet D. Dynamic multiple-target tracing to probe spatiotemporal cartography of cell membranes. Nat Methods. 2008a;5:687–694. doi: 10.1038/nmeth.1233. [DOI] [PubMed] [Google Scholar]
- Sergé A, Bertaux N, Rigneault H, Marguet D. Multiple-target tracing (MTT) algorithm probes molecular dynamics at cell surface. Protocol Exchange, 2008b DOI:10.1038/nprot.2008.128. [Google Scholar]
- Singer-Lahat D, et al. K+ channel facilitation of exocytosis by dynamic interaction with syntaxin. J Neurosci. 2007;27:1651–1658. doi: 10.1523/JNEUROSCI.4006-06.2007. [DOI] [PMC free article] [PubMed] [Google Scholar]
- Spiliotis ET, Nelson WJ. Spatial control of exocytosis. Curr Opin Cell Biol. 2003;15:430–437. doi: 10.1016/s0955-0674(03)00074-7. [DOI] [PMC free article] [PubMed] [Google Scholar]
- Stenkula KG, Lizunov VA, Cushman SW, Zimmerberg J. Insulin controls the spatial distribution of GLUT4 on the cell surface through regulation of its postfusion dispersal. Cell Metab. 2010;12:250–259. doi: 10.1016/j.cmet.2010.08.005. [DOI] [PMC free article] [PubMed] [Google Scholar]
- Stitka LJ. Does automation bias decision making? Int J Human-Computer Studies. 1999;51:991–1006. [Google Scholar]
- Tamkun MM, O'Connell K M, Rolig AS. A cytoskeletal-based perimeter fence selectively corrals a sub-population of cell surface Kv2.1 channels. J Cell Sci. 2007;120:2413–2423. doi: 10.1242/jcs.007351. [DOI] [PubMed] [Google Scholar]
- Tanabe T, Beam KG, Powell JA, Numa S. Restoration of excitation-contraction coupling and slow calcium current in dysgenic muscle by dihydropyridine receptor complementary DNA. Nature. 1988;336:134–139. doi: 10.1038/336134a0. [DOI] [PubMed] [Google Scholar]
- Trifaró J-M, Gasman S, Gutiérrez LM. Cytoskeletal control of vesicle transport and exocytosis in chromaffin cells. Acta Physiol (Oxf) 2008;192:165–172. doi: 10.1111/j.1748-1716.2007.01808.x. [DOI] [PubMed] [Google Scholar]
- Trimmer JS, Rhodes KJ. Localization of voltage-gated ion channels in mammalian brain. Ann Rev Physiol. 2004;66:477–519. doi: 10.1146/annurev.physiol.66.032102.113328. [DOI] [PubMed] [Google Scholar]
- Vacher H, Mohapatra DP, Misonou H, Trimmer JS. Regulation of Kv1 channel trafficking by the mamba snake neurotoxin dendrotoxin K. FASEB J. 2007;21:906–914. doi: 10.1096/fj.06-7229com. [DOI] [PMC free article] [PubMed] [Google Scholar]
- Vacher H, Mohapatra DP, Trimmer JS. Localization and targeting of voltage-dependent ion channels in mammalian central neurons. Physiol Rev. 2008;88:1407–1447. doi: 10.1152/physrev.00002.2008. [DOI] [PMC free article] [PubMed] [Google Scholar]
- Vicente R, Villalonga N, Calvo M, Escalada A, Solsona C, Soler C, Tamkun MM, Felipe A. Kv1.5 association modifies Kv1.3 traffic and membrane localization. J Biol Chem. 2008;283:8756–8764. doi: 10.1074/jbc.M708223200. [DOI] [PMC free article] [PubMed] [Google Scholar]
- Vizi ES. Different temperature dependence of carrier-mediated (cytoplasmic) and stimulus-evoked (exocytotic) release of transmitter: a simple method to separate the two types of release. Neurochem Int. 1998;33:359–366. doi: 10.1016/s0197-0186(98)00040-0. [DOI] [PubMed] [Google Scholar]
- Weigel AV, Simon B, Tamkun MM, Krapf D. Ergodic and nonergodic processes coexist in the plasma membrane as observed by single-molecule tracking. Proc Natl Acad Sci USA. 2011;108:6438–6443. doi: 10.1073/pnas.1016325108. [DOI] [PMC free article] [PubMed] [Google Scholar]
- Wick PF, Trenkle JM, Holz RW. Punctate appearance of dopamine-beta-hydroxylase on the chromaffin cell surface reflects the fusion of individual chromaffin granules upon exocytosis. Neuroscience. 1997;80:847–860. doi: 10.1016/s0306-4522(97)00062-6. [DOI] [PubMed] [Google Scholar]
- Yao J, Larson DR, Vishwasrao HD, Zipfel WR, Webb WW. Blinking and nonradiant dark fraction of water-soluble quantum dots in aqueous solution. Proc Natl Acad Sci USA. 2005;102:14284–14289. doi: 10.1073/pnas.0506523102. [DOI] [PMC free article] [PubMed] [Google Scholar]
- Zhang Q, Cao Y-Q, Tsien RW. Quantum dots provide an optical signal specific to full collapse fusion of synaptic vesicles. Proc Natl Acad Sci USA. 2007;104:17843–17848. doi: 10.1073/pnas.0706906104. [DOI] [PMC free article] [PubMed] [Google Scholar]
- Zhang Z, Jackson MB. Temperature dependence of fusion kinetics and fusion pores in Ca2+-triggered exocytosis from PC12 cells. J Gen Physiol. 2008;131:117–124. doi: 10.1085/jgp.200709891. [DOI] [PMC free article] [PubMed] [Google Scholar]
Associated Data
This section collects any data citations, data availability statements, or supplementary materials included in this article.