Abstract
We describe the validation of an anatomical brain atlas approach to the analysis of diffuse optical tomography (DOT). Using MRI data from 32 subjects, we compare the diffuse optical images of simulated cortical activation reconstructed using a registered atlas with those obtained using a subject’s true anatomy. The error in localization of the simulated cortical activations when using a registered atlas is due to a combination of imperfect registration, anatomical differences between atlas and subject anatomies and the localization error associated with diffuse optical image reconstruction. When using a subject-specific MRI, any localization error is due to diffuse optical image reconstruction only. In this study we determine that using a registered anatomical brain atlas results in an average localization error of approximately 18 mm in Euclidean space. The corresponding error when the subject’s own MRI is employed is 9.1 mm. In general, the cost of using atlas-guided DOT in place of subject-specific MRI-guided DOT is a doubling of the localization error. Our results show that despite this increase in error, reasonable anatomical localization is achievable even in cases where the subject-specific anatomy is unavailable.
Keywords: Diffuse optical tomography, NIRS, MRI, Anatomical atlas, Registration
Introduction
Near-infrared spectroscopy (NIRS) provides functional information about the oxygenation status of tissue by measuring optical signals which reflect changes in the concentrations of oxygenated-hemoglobin (HbO) and deoxygenated-hemoglobin (HbR) (Jöbsis, 1977). Diffuse optical tomography (DOT) is a multichannel NIRS approach, whereby numerous near-infrared sources and detectors coupled to the skin enable depth-resolved images of the spatio-temporal variations in hemoglobin concentrations to be reconstructed (Bluestone et al., 2001; Culver et al., 2003; Gibson et al., 2005; Zeff et al., 2007). Both NIRS and DOT have been widely applied to investigate brain function over the last 15 years (Gibson et al., 2005; Durduran et al., 2010; Lloyd-Fox et al., 2010). Recently, DOT has been used to map the visual cortex and investigate functional connectivity and motor-visual coordination with millimeter-order spatial resolution (Zeff et al., 2007; White et al., 2009). Whole-head, three-dimensional image reconstruction of regional blood volume and oxygenation has also been demonstrated in healthy and neurologically damaged infants (Austin et al., 2006; Gibson et al., 2006).
Numerous approaches have been investigated for improving DOT image sensitivity, resolution and accuracy (Boas et al., 2004; Gibson et al., 2005; Zeff et al., 2007). Employing a large number of sources and detectors (optodes), densely packed so as to provide spatially overlapping measurements, is essential for accurate DOT image reconstruction (Culver et al., 2003; Zeff et al., 2007; Durduran et al., 2010). The importance of including source-detector pairs with a relatively short separation (of 10 mm or less) has also been confirmed for both NIRS (Gagnon et al., 2011) and DOT (Gregg et al., 2010). Short-separation channels are sensitive to superficial tissues only. Such measurements allow the confounding effects of scalp hemodynamics to be removed from standard-separation signals in NIRS studies, but also improve the separation of superficial and cortical signals inherent to depth-resolved DOT.
Despite these advances, the most significant drawback of traditional DOT approaches is the absence of corresponding images of brain structure. Knowledge of the specific brain anatomy not only allows registration of DOT images to the cerebral cortex, but can significantly improve the images themselves by restraining the ill-posed DOT image reconstruction problem. This same approach has been investigated extensively for EEG and MEG techniques; registration to an anatomical MRI image can be used to restrain the source reconstruction problem and has been shown to be of significant benefit (Dale and Sereno, 1993; Huppertz et al., 1998). The same has been achieved for diffuse optical tomography using subject-specific MRI images (Barbour et al., 1995; Ntziachristos et al., 2002; Boas and Dale, 2005). However, the requirement to obtain a subject’s MRI undermines one of the fundamental advantages of DOT systems: that they are portable and can be easily applied to vulnerable subjects. A promising alternative is therefore to use a registered 3D atlas head model in place of the subject’s MRI, as described by (Custo et al., 2010). This MRI-free approach to anatomically guided DOT image reconstruction and interpretation is based on registering a selected atlas to the subject’s head surface and solving the photon migration forward problem in the registered atlas space. This approach requires measuring the positions of the optical sources and detectors and the cranial landmarks of the subject’s head in 3D space, commonly using an electromagnetic tracking system. This allows the atlas to be transformed in to the subject space (or ‘registered’) using an affine transformation computed using the corresponding cranial landmarks in the two spaces (Singh et al., 2005; Tsuzuki et al., 2007).
Atlas-guided DOT will clearly exhibit errors in the localization of cortical activations. The sources of this error will be: 1) imperfect registration between the subject and atlas spaces, 2) differences between the subject’s true anatomy and the atlas anatomy and 3) the localization error associated with diffuse optical image reconstruction. These sources of error have previously been investigated, but not in combination. Studies have shown that by employing the subject-specific MRI, the error associated with DOT localization of simulated brain activation in the cortex is 5–10 mm (Boas and Dale, 2005). The error due to the registration process has also been explicitly investigated and found to be on the order of 4–7 mm (Singh et al., 2005; Tsuzuki et al., 2007). However, it is clearly necessary to explicitly test the entire atlas-based DOT process, and how errors in localization, registration and anatomy will affect the accuracy of the image reconstruction process.
In this paper we seek to validate the atlas-guided DOT methods described in Custo et al. 2010, and quantify the corresponding error in the localization of simulated cortical activations. Using an MRI library of 32 subjects, we simulate DOT measurements of brain activation in the subject space then reconstruct the corresponding DOT images using both an atlas registered to the subject and the subject’s true anatomy. This allows us to directly compare the anatomical location of the images reconstructed in the atlas space with those reconstructed in the subject space.
Materials and methods
MRI data, atlas and pre-processing
Anatomical MRI images with a voxel size of 0.94 × 0.94 × 1.5 mm were obtained using the multi-echo FLASH pulse sequence described in (Fischl et al., 2004) for 32 adult subjects. The atlas MRI volume we employed was the high-resolution ‘Colin27’ digital brain phantom as described by (Collins et al., 1998). The atlas MRI volume and all subject MRI volumes were automatically transformed into a single coordinate system in FreeSurfer, which ensures consistent orientation. Preprocessing of the 32 individual MRI volumes and of the anatomical MRI atlas was performed in order to segment the volumes and extract the pia mater surface as a 3D mesh. The subject-specific MRI volumes were segmented into gray matter, white matter and extra-cerebral tissue, using FreeSurfer (surfer.nmr.mgh.harvard.edu) (Dale et al., 1999; Fischl et al., 1999). The anatomical atlas was segmented in the same manner and then registered to each subject space using an affine transformation from the 10/20 scalp positions on the atlas to the 10/20 scalp positions on the real anatomy (Singh et al., 2005). The 10/20 scalp positions were identified on the different head surfaces following the procedure outlined in (Jurcak et al., 2007). This pre-processing produced 32 segmented subject brain volumes and 32 registered, segmented atlas volumes.
Virtual DOT probe and sensitivity mapping
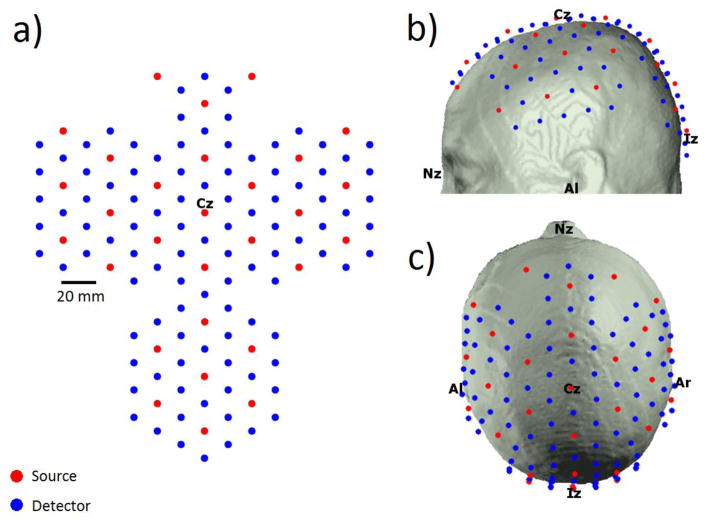
In order to simulate DOT measurements it was first necessary to produce a virtual DOT probe and map this probe to our 32 MRI data sets and our 32 registered atlases. We utilized a large virtual probe with 100 detectors and 29 sources arranged in a hexagonal pattern such that the nearest and second-nearest source-detector separations are 20 and 34.6 mm respectively. The virtual probe was created in 2D space, but was designed to be wrapped to the 3D surface of the scalp. The 2D probe was first anchored in each MRI space such that the midline of the probe was aligned to midline of each head (i.e. the nasion-inion sagittal plane) and a specific optode was positioned at Cz, the apex of the head. The remaining 128 source and detector positions were then wrapped to the head using an iterative, spring-relaxation algorithm. This algorithm introduces a spring constant between nearest neighbor optodes such that a force is applied if the separation between those optodes deviates from the optimal 20 mm. The force exerted on the optodes was then minimized by allowing the optodes to move in 3D space by up to 1 mm per iteration. Between iterations, all optode locations are forced to the surface of the scalp. Iterations continued until optode locations converged. After this process was complete, the average nearest and second-nearest source-detector separations, were 20.1 (±0.69) and 34.5 (±0.91) mm. The 2D probe is shown in figure 1a, and the virtual probe wrapped to a registered atlas head is shown in figure 1b and 1c. Note that in a real atlas-based DOT study, the 3D coordinates of the optode positions on the subject scalp would be measured and those positions would then be transformed into the registered atlas space. For the current study, we wrapped the virtual probe to the registered atlas directly rather than transforming the subject-space optode positions. The transformation of optode locations usually results in many optodes being placed above or below the scalp, which then necessitates the application of a relaxation algorithm similar to that described above to force the optodes to the scalp and correct source-detector separations.
Figure 1.
The virtual probe layout is shown in 2D (a) and wrapped to the atlas head in (b) and (c). The anchor point Cz is shown as are the 10–20 landmarks. This probe layout includes source-detector separations of 20 mm and 34.6 mm.
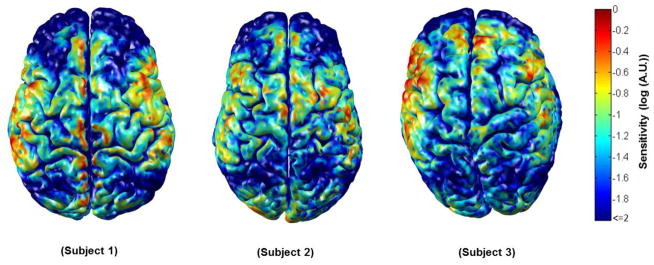
Once we had obtained each source and detector position for each of the 64 head models, Monte Carlo photon migration simulations were performed using a GPU-based Monte Carlo algorithm (Fang, 2010). Measurement sensitivity profiles were obtained for the nearest and second-nearest neighbor source-detector pairs, providing a total of 284 channels. The absorption and reduced scattering coefficients were 0.0178 mm−1 and 1.25 mm−1 for white gray and matter gray matter and 0.0159 mm−1 and 0.8 mm−1 for extra-cerebral tissues respectively (Boas and Dale, 2005). The resulting measurement sensitivity profiles form rows in the matrix A that transforms from the voxel space of localized changes in the absorption coefficient, x, to the measurement space y of optical density changes. That is, y = A x. Summing along columns of A, we obtain the aggregate sensitivity of our probe geometry to absorption changes at each voxel. This aggregate sensitivity to absorption changes within the cortex is exemplified for three subjects in figure 2.
Figure 2.
The normalized cortical sensitivity of the virtual NIRS probe in three subjects. Areas where the probe is sparse, such as over the lateral frontal lobes, clearly exhibit a reduced sensitivity. Note that all sensitivities below 1 % of the subject maximum are shown in dark blue.
Simulating cortical activation
Given the measurement sensitivity matrix, simulated DOT measurements of brain activation can be computed by first simulating a vector which defines a change in the absorption coefficient of selected voxels. Simulating an activation in the subject space allows us to compute the localization errors inherent to the DOT images reconstructed using both the subject’s anatomy and the atlas anatomy.
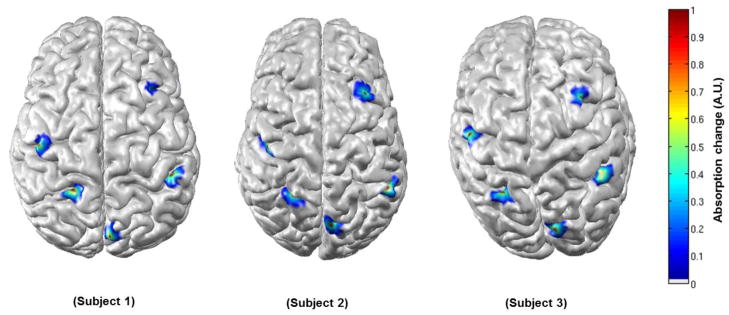
In order to quantify the localization error as a function of cortical position, we simulated approximately 4000 individual brain activations across the cortex in each of the 32 subject MRI spaces. Each simulated brain activation was centered on a unique voxel in the segmented cortex of the subject’s MRI. The position of each brain activation was made anatomically equivalent across all 32 subjects using the surface transformation approach described below. The positions of the simulated activations were chosen primarily to provide good spatial coverage of the cortex across all subjects. The center of each simulated activation was displaced by at least 4 mm from neighboring activations, while regions of poor sensitivity (less than 1% of the maximum sensitivity in each subject) were avoided where possible. In some cases (particularly towards the edges of the virtual probe) activations had to be simulated in regions of low sensitivity in order to maintain coverage. Once the center of the activation had been determined, an iterative diffusion process was applied so that the magnitude of the activation absorption change decreased with distance from the center and reached zero at 10 mm from the center in all directions. The volume of each activation was restricted to the segmented gray matter. Examples of five different brain activations produced in 3 different subjects at anatomically equivalent locations are shown in figure 3.
Figure 3.
Five simulated activations in their anatomically equivalent locations in three subjects.
Given the measurement sensitivity matrix (A) and the simulated vector of brain activations in each subject space (xtruth,subject), we were then able to calculate the simulated DOT measurement vector via: y = Asubjectxtruth,subject.
Image reconstruction
Using the DOT measurements simulated in each of the 32 subjects, we were able to reconstruct DOT images of brain activation for each of the 32 subject and 32 registered atlas volumes. As described by (Arridge S R, 1999; Boas and Dale, 2005) this constitutes solving the inverse problem:
| (1) |
Where is the measurement covariance matrix (assumed to be diagonal) and λ = α*max(diag(AAT)) is the scalar regularization parameter. We set α = 0.01, which is consistent with previous simulated and in-vivo diffuse optical reconstruction studies where NIRS measurements are expected to have a standard deviation of ~1 %, which is typical for source-detector separations of ~3 cm (Boas and Dale 2005, Custo et al., 2010). No noise was added to the simulated measurements as we wished to focus on the localization errors of atlas-guided DOT rather than exploring the impact of noise. The sensitivity matrix, A, used in this image reconstruction was either that of a given subject, Asubject, or that of a registered atlas, Aatlas. In both cases, the reconstruction was constrained to cortical voxels only. The application of this constraint has been shown in previous simulations to significantly increase the accuracy of optical reconstructions, which, without such a constraint, have a strong tendency to underestimate the depth of a given activation (see Boas and Dale, 2005). These image reconstruction processes resulted in ~4000 DOT images of simulated cortical activation for each of the 32 subject volumes and each of the 32 registered atlas volumes. Images computed using the subjects true anatomy are denoted xrecon,subject, whereas those computed using the registered atlas are denoted xrecon,atlas.
Error computation
In order to calculate the localization error of the brain activation reconstructed using each atlas, it was first necessary to transform the simulated activation location from the subject to the registered atlas space. That is, we need to find xtruth,atlas given xtruth,subject. FreeSurfer (surfer.nmr.mgh.harvard.edu) provides an appropriate approach to locate anatomically corresponding locations in two different brains (Dale et al., 1999; Fischl et al., 1999). For each brain hemisphere the surface between the gray matter and the extra-cerebral tissues is calculated (i.e. the pial surface). This surface is then transformed, through a virtual inflation process, into a unitary sphere (each brain hemisphere surface is topologically equivalent to a sphere) while maintaining information about the folding pattern of the hemisphere. Different unitary spheres then lie in a common unitary space and their folding patterns are warped to a common template. Each of these transformation steps is reversible such that it is possible to transform from a point on the cortex of one brain to a point on the cortex of another to find common anatomical locations on two different brains. This enabled us to obtain xtruth,atlas given xtruth,subject.
For each activation location, we calculated error metrics to characterize the distance between the true and reconstructed activation locations, for the 32 registered atlases (xrecon,atlas vs. xtruth,atlas) and the 32 subject volumes (xrecon,subject vs. xtruth,subject). To define the location of activation in the reconstructed DOT images, we first selected all voxels exhibiting an absorption change greater than 80 % of the maximum absorption change in each image. The centroid of the reconstructed activation was then calculated by taking an absorption-change-weighted average of the position of these selected voxels. Three different localization error metrics were then computed:
Euclidean distance (volume)
The distance in 3D space between the centroid of reconstructed activation and the centroid of the simulated activation.
Geodesic distance (surface)
The shortest distance along the cortical surface between the centroids of the reconstructed and simulated activations. This is informative when two activations are close to each other but lie on different cortical folds. In this case the Euclidean error would be small despite the reconstructed activation being in the wrong cortical area. In such situations the geodesic distance provides a more informative measure of localization error.
Hausdorff distance (Hausdorff)
Defined as the length of the greatest local deviation between the two sets of points (Huttenlocher et al., 1993). The Hausdorff distance measures the deformation of the reconstructed activation profile relative to the simulated activation profile. The activation profiles are defined in the same way for both reconstructed and simulated activations: by selecting voxels which exceed 80 % of the maximum absorption change in each image. The Hausdorff distance provides a measure of how accurately a DOT image maintains the shape of a simulated activation, rather than simply the location of its centroid. The Hausdorff error can be non-zero even if the reconstructed and simulated activation profiles are centered at a common voxel.
As described above, the error in localization inherent to atlas-guided DOT has three distinct sources. The error associated with diffuse optical image reconstruction is compounded by errors in atlas registration and anatomical differences between the subject and atlas. Any error in the registration of the atlas to the subject space, calculated via the 10–20 cranial landmarks, will produce an error in the positioning of the virtual DOT optodes. That is, the optode positioning error is a function of registration error. The optode positioning error will be inherent to the Euclidean, geodesic and Hausdorff metrics described above. However, in order to show that positioning of our simulated NIRS probe does not impact the localization errors, we explicitly calculated the optode positioning error by comparing the positions of each of the simulated optodes between every subject and subject-registered atlas. The distance between each optode and the three nearest 10–20 positions was calculated in both the registered atlas and subject spaces. These three distances describe a unique position in 3D space. The error in optode positioning was then calculated by taking the mean of the absolute difference between each distance in atlas space and its subject-space equivalent.
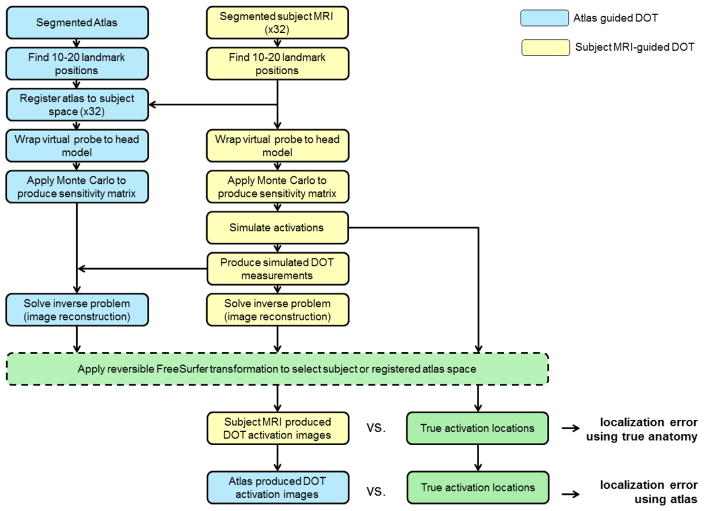
A diagram showing the whole data processing stream employed in this study, including registration, sensitivity mapping, simulating brain activations, image reconstruction and error computation is shown in figure 4.
Figure 4.
A flow diagram illustrating every stage of analysis.
Results
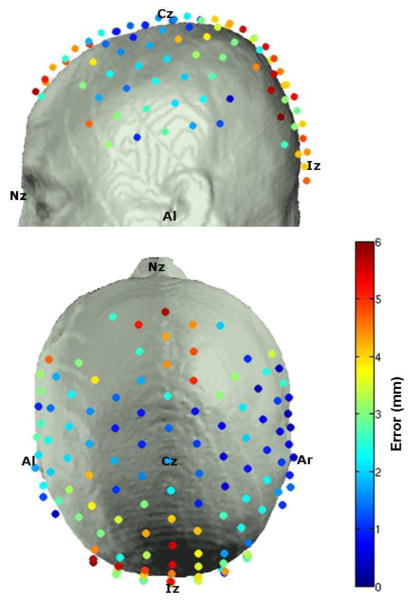
The optode positioning error was calculated for each of the 32 registered atlas heads, and the average for each optode position is depicted in figure 5. Note that the largest errors occur where the head surface is highly curved, particularly towards the occipital region. The average (and standard deviation) optode positioning error across all subjects and optodes was 2.8 (± 1.7) mm.
Figure 5.
The average error in optode positioning between subject and registered atlas.
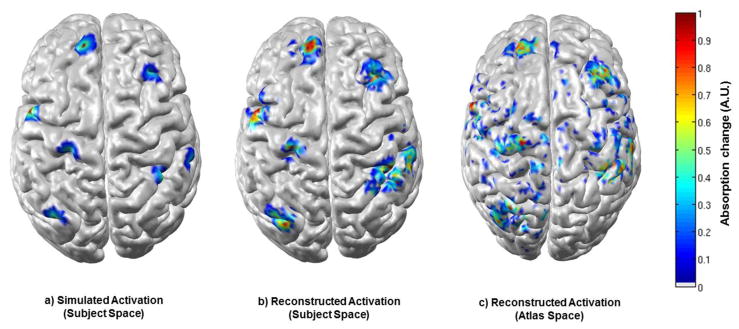
Figure 6 shows seven simulated activations, but in addition shows the corresponding DOT images reconstructed using the subject-specific anatomy (6b) and the atlas anatomy (6c) for one subject. This result is characteristic of those across the data set, and clearly shows that reasonable, but decreased localization accuracy is associated with atlas-based reconstruction. Note that as we are interested in the location, rather than the scale of the reconstructed activation, each image is scaled to its own maximum absorption change.
Figure 6.
Seven activations are shown as simulated in the subject space (a), reconstructed in the subject space (b) and reconstructed in the atlas space (c). Each figure is normalised by its own maximum absorption change.
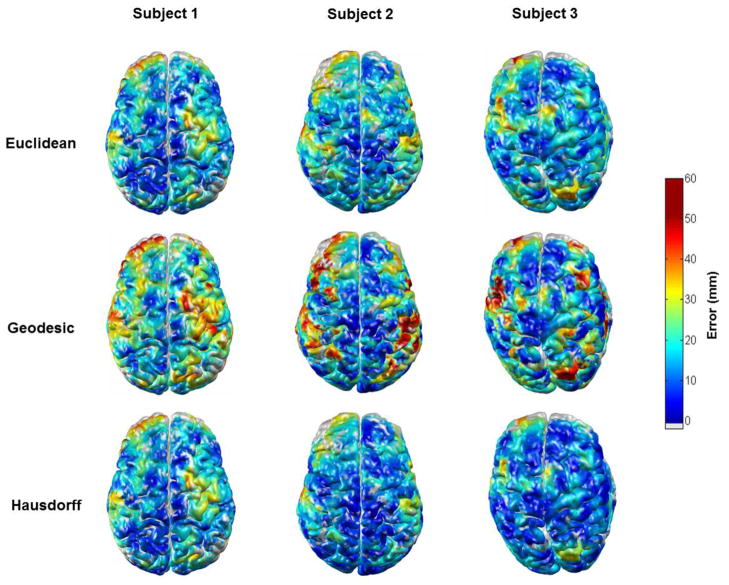
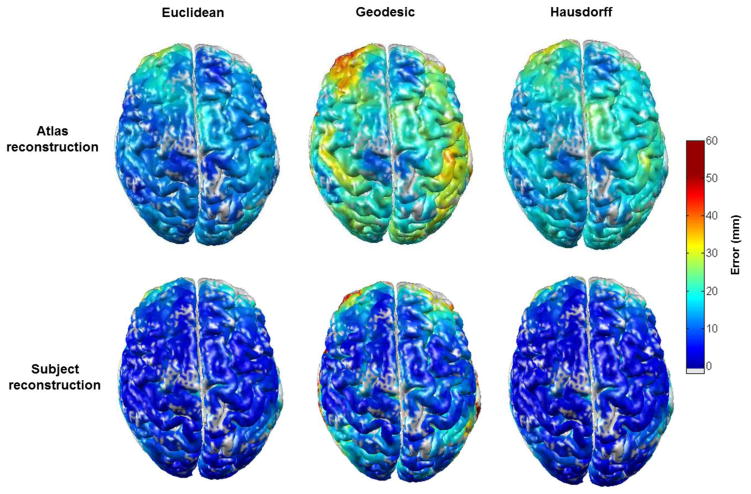
Using the reconstructed DOT images of the ~4000 simulated activations and a process of interpolation, it was possible to calculate the Euclidean, geodesic and Hausdorff error metrics at nearly every point on the cortex for each of the 32 subject and 32 registered atlas heads. The error value assigned to each voxel is a weighted sum of the localization error of every activation center within 5 mm of that voxel. If there are less than 3 activation centers within 5 mm, no error value is assigned to that voxel (such voxels appear grey in figures 7 and 8). This process produced a near-continuous cortical map of localization error for each metric and each brain. These error maps can be displayed in either the subject or atlas space using the reversible FreeSurfer anatomical transformation described above. By averaging the error associated with each of the ~4000 activations across all 32 subjects, transforming to the atlas space and then repeating our interpolation process, we are able to produce maps of mean localization error.
Figure 7.
The three localization error metrics (Euclidean, geodesic and Hausdorff) for atlas-based DOI reconstruction, as a function of cortical position in three subjects. The grey colour indicates no assigned value due to a sparsity of simulated activations in those areas.
Figure 8.
The mean localization errors across all 32 subjects for atlas-guided and subject MRI-guided DOI as a function of cortical position. The grey colour indicates no assigned value due to a sparsity of simulated activations in those areas.
Figure 7 shows examples of the Euclidean, geodesic and Hausdorff localization error maps, for atlas-guided DOT processing in three subjects. The spatial pattern of each error metric is expected to differ from subject to subject because of anatomical variation, and the location of the largest error varies significantly from subject to subject. Note that in each subject the geodesic distance is generally greater than the Euclidean distance. Figure 8 shows the average of the three localization error metrics across the 32 subjects for both atlas-guided and subject-MRI guided DOT processing. The geodesic error is consistently larger than the Euclidean error, for both forms of DOT processing. The Hausdorff distance is comparable to the Euclidean distance in regions of high localization error, but is generally higher than the Euclidean distance in regions of low error. The mean of each error metric, calculated by averaging across the cortex and across all 32 subjects for atlas and subject-MRI processing are given in table 1.
Table 1. Grand average localization errors.
The average localization errors associated with atlas-guided and subject-MRI guided DOT across all 32 subjects and their standard deviations.
| Mean Euclidean error (mm) | Mean geodesic error (mm) | Mean Hausdorff error (mm) | |
|---|---|---|---|
| Atlas-guided DOT | 18.0 ± 5.7 | 30.4 ± 11.4 | 23.2 ± 5.9 |
| Subject-MRI-guided DOT | 9.1 ± 6.7 | 14.2 ± 13.2 | 11.1 ± 8.6 |
Discussion
With the application of DOT techniques becoming more common, across a variety of fields, there is a growing need to develop a method which extracts as much of the spatial information present in DOT as possible, while maintaining the advantages the technique has over other neuroimaging modalities; namely convenience, cost and portability. The atlas-guided DOT approach described here and by Custo et al. (2010) meets this requirement. As a prerequisite for its extended application we have investigated and quantified the localization error inherent to atlas-guided DOT.
The localization error of atlas-guided DOT has three fundamental sources. The first is the error in registration of the atlas to the subject surface. This error varies from subject to subject and will depend on the accuracy of the measurement of the cranial landmarks and has been estimated by Singh et al., 2005, to be between 4 and 7 mm. The second is anatomical differences between the subject and the atlas. Even if the affine transformation of the cranial landmarks from the atlas to the subject space is perfectly accurate, there will still be significant differences between the position and folding of the atlas cortex and that of the subject’s cortex. Therefore, the contribution of registration and anatomical differences to the cortical localization is likely to be significantly greater than 4–7 mm, particularly in regions of dense cortical folding.
The third factor contributing to the error of atlas-guided DOT is the inaccuracy of diffuse optical image reconstruction itself, which is dependent on the probe geometry and the sensitivity of that probe in a given subject.
The sensitivity of the simulated probe varies across the cortex and across subjects. Regions which have consistently low sensitivity compared to the subject maximum (such as the pre-frontal cortex, figure 2) clearly yield high localization errors across subjects, (figures 7 and 8). A comparison of figures 2 and 7 shows that there are also areas of high localization error in each subject which are not consistent with low probe sensitivity, suggesting that errors in registration and anatomical differences are a significant, if not dominant, source of error in those regions.
The results of our simulation in 32 subject and 32 registered atlas volumes show that the Euclidean error in the localization of brain activations increases two-fold, from 9.1 to 18.0 mm, when an atlas is used in place of the subject’s own MRI. The subject-guided localization error of 9.1 mm should be thought of as the error inherent to diffuse optical image reconstruction in regions of the cortex to which our probe is reasonably sensitive. This figure is in good agreement with previous studies. Boas and Dale (2005) found the localization error to be between 5 and 10 mm when using a subject’s true anatomy and a similarly dense DOT probe. We can therefore conclude that the additional Euclidean localization error introduced by an atlas-driven approach is on the order of 1 cm.
The significant difference between the Euclidean and geodesic error metrics shown in figure 8 suggests that in many cases the centroid of brain activation is incorrectly reconstructed on a neighboring gyrus. The largest geodesic errors occur over the frontal poles and around the posterior temporal lobe (figures 7 and 8), which (due to the limits of the virtual probe) are regions of low sensitivity. Although the geodesic error is smaller in regions of good sensitivity (for example, around the pre-central gyrus, figure 8) it still greatly exceeds the Euclidean error. Our results therefore indicate that those applying atlas-based DOT must be extremely cautious in assigning a region of activation to a particular cortical gyrus, particularly in regions of high dense cortical folding. It is important to note that the geodesic error also significantly exceeds the Euclidean error for subject-specific DOT reconstruction in regions of low sensitivity, though the effect is clearly exacerbated by the errors associated with atlas registration and anatomical variation. It is therefore likely that employing a higher density DOT probe would allow greater confidence in localizing activations to specific gyri for both subject-specific and atlas-based DOT (Dehghani et al., 2009).
The Hausdorff distance is a useful metric for quantifying the difference between the shape and size of the reconstructed activations. The fact that the Hausdorff and Euclidean errors are of similar magnitude suggests that the Hausdorff error is generally the result of the shift in position of the peak of activation and that the spatial extent of a simulated activation is, on average, well maintained by DOT.
Figure 8 shows the localization error metrics averaged across all 32 subjects. It is clear from these figures that there is a consistent spatial pattern of localization error, despite there being significant inter-subject variability (figure 7). While it is difficult to comment on its significance, this pattern must arise because of a consistent, spatially varying bias. The source of this error could potentially be consistent anatomical differences between the subjects and the atlas. This is a possibility because the Colin27 atlas (which was chosen because of its high resolution) was produced from the repeated MRI scans of a single subject. However, it is also probable that this bias is a manifestation of the cortically varying sensitivity of the virtual DOT probe, which was applied to every subject.
In conclusion, we have performed a validation of a specific anatomical atlas-guided approach to the analysis of DOT data. Although care should be taken in assigning a hemodynamic response to a particular gyrus, atlas-guided DOT can produce reasonably accurate images of cortical activation, and constitutes a suitable functional imaging approach when a spatial resolution of approximately 2 cm is permitted.
Acknowledgments
This work was supported by NIH P41- RR14075, P41-RR13218, R01-EB006385 (to D.A.B.), Comprehensive Research on Disability, Health and Welfare from Health and Labour Sciences Research Grants (to I.D.), and the Grant-in-Aid for Scientific Research from the Japan Society for Promotion of Science (23390354, 23650217 to I.D.).
Footnotes
Publisher's Disclaimer: This is a PDF file of an unedited manuscript that has been accepted for publication. As a service to our customers we are providing this early version of the manuscript. The manuscript will undergo copyediting, typesetting, and review of the resulting proof before it is published in its final citable form. Please note that during the production process errors may be discovered which could affect the content, and all legal disclaimers that apply to the journal pertain.
References
- Arridge SR. Optical Tomography in Medical Imaging. Inverse Problems. 1999;15:R41–R93. [Google Scholar]
- Austin T, Gibson AP, Branco G, Yusof RM, Arridge SR, Meek JH, Wyatt JS, Delpy DT, Hebden JC. Three dimensional optical imaging of blood volume and oxygenation in the neonatal brain. NeuroImage. 2006;31:1426–1433. doi: 10.1016/j.neuroimage.2006.02.038. [DOI] [PubMed] [Google Scholar]
- Barbour RL, Graber HL, Chang J, Barbour SLS, Koo PC, Aronson R. MRI-Guided Optical Tomography: Prospects and Computation for a New Imaging Method. IEEE Computational Science & Engineering. 1995;2:63–77. [Google Scholar]
- Bluestone A, Abdoulaev G, Schmitz C, Barbour R, Hielscher A. Three-dimensional optical tomography of hemodynamics in the human head. Opt Express. 2001;9:272–286. doi: 10.1364/oe.9.000272. [DOI] [PubMed] [Google Scholar]
- Boas DA, Chen K, Grebert D, Franceschini MA. Improving the diffuse optical imaging spatial resolution of the cerebral hemodynamic response to brain activation in humans. Opt Lett. 2004;29:1506–1508. doi: 10.1364/ol.29.001506. [DOI] [PubMed] [Google Scholar]
- Boas DA, Dale AM. Simulation study of magnetic resonance imaging-guided cortically constrained diffuse optical tomography of human brain function. Appl Opt. 2005;44:1957–1968. doi: 10.1364/ao.44.001957. [DOI] [PubMed] [Google Scholar]
- Collins DL, Zijdenbos AP, Kollokian V, Sled JG, Kabani NJ, Holmes CJ, Evans AC. Design and construction of a realistic digital brain phantom. IEEE Transactions on Medical Imaging. 1998;17:463–468. doi: 10.1109/42.712135. [DOI] [PubMed] [Google Scholar]
- Culver JP, Choe R, Holboke MJ, Zubkov L, Durduran T, Slemp A, Ntziachristos V, Chance B, Yodh AG. Three-dimensional diffuse optical tomography in the parallel plane transmission geometry: Evaluation of a hybrid frequency domain/continuous wave clinical system for breast imaging. Med Phys. 2003;30:235–247. doi: 10.1118/1.1534109. [DOI] [PubMed] [Google Scholar]
- Custo A, Boas DA, Tsuzuki D, Dan I, Mesquita R, Fischl B, Grimson WEL, Wells W., III Anatomical atlas-guided diffuse optical tomography of brain activation. NeuroImage. 2010;49:561–567. doi: 10.1016/j.neuroimage.2009.07.033. [DOI] [PMC free article] [PubMed] [Google Scholar]
- Dale AM, Fischl B, Sereno MI. Cortical Surface-Based Analysis: I. Segmentation and Surface Reconstruction. NeuroImage. 1999;9:179–194. doi: 10.1006/nimg.1998.0395. [DOI] [PubMed] [Google Scholar]
- Dale AM, Sereno MI. Improved Localizadon of Cortical Activity by Combining EEG and MEG with MRI Cortical Surface Reconstruction: A Linear Approach. J Cognitive Neurosci. 1993;5:162–176. doi: 10.1162/jocn.1993.5.2.162. [DOI] [PubMed] [Google Scholar]
- Dehghani H, White BR, Zeff BW, Tizzard A, Culver JP. Depth sensitivity and image reconstruction analysis of dense imaging arrays for mapping brain function with diffuse optical tomography. Appl Opt. 2009;48:D137–D143. doi: 10.1364/ao.48.00d137. [DOI] [PMC free article] [PubMed] [Google Scholar]
- Durduran T, Choe R, Baker WB, Yodh AG. Diffuse optics for tissue monitoring and tomography. Rep Prog Phys. 2010;73:076701. doi: 10.1088/0034-4885/73/7/076701. [DOI] [PMC free article] [PubMed] [Google Scholar]
- Fang Q. Mesh-based Monte Carlo method using fast ray-tracing in Plücker coordinates. Biomed Opt Express. 2010;1:165–175. doi: 10.1364/BOE.1.000165. [DOI] [PMC free article] [PubMed] [Google Scholar]
- Fischl B, Salat DH, van der Kouwe AJW, Makris N, Ségonne F, Quinn BT, Dale AM. Sequence-independent segmentation of magnetic resonance images. NeuroImage. 2004;23(Supplement 1):S69–S84. doi: 10.1016/j.neuroimage.2004.07.016. [DOI] [PubMed] [Google Scholar]
- Fischl B, Sereno MI, Dale AM. Cortical Surface-Based Analysis: II: Inflation, Flattening, and a Surface-Based Coordinate System. NeuroImage. 1999;9:195–207. doi: 10.1006/nimg.1998.0396. [DOI] [PubMed] [Google Scholar]
- Gagnon L, Perdue K, Greve DN, Goldenholz D, Kaskhedikar G, Boas DA. Improved recovery of the hemodynamic response in diffuse optical imaging using short optode separations and state-space modeling. NeuroImage. 2011;56:1362–1371. doi: 10.1016/j.neuroimage.2011.03.001. [DOI] [PMC free article] [PubMed] [Google Scholar]
- Gibson AP, Austin T, Everdell NL, Schweiger M, Arridge SR, Meek JH, Wyatt JS, Delpy DT, Hebden JC. Three-dimensional whole-head optical tomography of passive motor evoked responses in the neonate. Neuroimage. 2006;30:521–8. doi: 10.1016/j.neuroimage.2005.08.059. [DOI] [PubMed] [Google Scholar]
- Gibson AP, Hebden JC, Arridge SR. Recent advances in diffuse optical imaging. Phys Med Biol. 2005;50:R1–43. doi: 10.1088/0031-9155/50/4/r01. [DOI] [PubMed] [Google Scholar]
- Gregg NM, White BR, Zeff BW, Berger AJ, Culver JP. Brain specificity of diffuse optical imaging: improvements from superficial signal regression and tomography. Front Neuroenergetics. 2010;2:1662–6427. doi: 10.3389/fnene.2010.00014. [DOI] [PMC free article] [PubMed] [Google Scholar]
- Huppertz HJ, Otte M, Grimm C, Kristeva-Feige R, Mergner T, Lücking C. Estimation of the accuracy of a surface matching technique for registration of EEG and MRI data. Electroencephalogr Clin Neurophysiol. 1998;106:409–415. doi: 10.1016/s0013-4694(98)00021-2. [DOI] [PubMed] [Google Scholar]
- Huttenlocher DP, Klanderman GA, Rucklidge WA. Comparing Images Using the Hausdorff Distance. IEEE Trans Pattern Anal Mach Intell. 1993;15:850–863. [Google Scholar]
- Jöbsis FF. Noninvasive, infrared monitoring of cerebral and myocardial oxygen sufficiency and circulatory parameters. Science. 1977;198:1264–7. doi: 10.1126/science.929199. [DOI] [PubMed] [Google Scholar]
- Jurcak V, Tsuzuki D, Dan I. 10/20, 10/10, and 10/5 systems revisited: their validity as relative head-surface-based positioning systems. Neuroimage. 2007;34:1600–1611. doi: 10.1016/j.neuroimage.2006.09.024. [DOI] [PubMed] [Google Scholar]
- Lloyd-Fox S, Blasi A, Elwell CE. Illuminating the developing brain: The past, present and future of functional near infrared spectroscopy. Neuroscience & Biobehavioral Reviews. 2010;34:269–284. doi: 10.1016/j.neubiorev.2009.07.008. [DOI] [PubMed] [Google Scholar]
- Ntziachristos V, Yodh AG, Schnall MD, Chance B. MRI-Guided Diffuse Optical Spectroscopy of Malignant and Benign Breast Lesions. Neoplasia. 2002;4:347–354. doi: 10.1038/sj.neo.7900244. [DOI] [PMC free article] [PubMed] [Google Scholar]
- Singh AK, Okamoto M, Dan H, Jurcak V, Dan I. Spatial registration of multichannel multi-subject fNIRS data to MNI space without MRI. NeuroImage. 2005;27:842–851. doi: 10.1016/j.neuroimage.2005.05.019. [DOI] [PubMed] [Google Scholar]
- Tsuzuki D, Jurcak V, Singh AK, Okamoto M, Watanabe E, Dan I. Virtual spatial registration of stand-alone fNIRS data to MNI space. NeuroImage. 2007;34:1506–1518. doi: 10.1016/j.neuroimage.2006.10.043. [DOI] [PubMed] [Google Scholar]
- White BR, Snyder AZ, Cohen AL, Petersen SE, Raichle ME, Schlaggar BL, Culver JP. Resting-state functional connectivity in the human brain revealed with diffuse optical tomography. NeuroImage. 2009;47:148–156. doi: 10.1016/j.neuroimage.2009.03.058. [DOI] [PMC free article] [PubMed] [Google Scholar]
- Zeff BW, White BR, Dehghani H, Schlaggar BL, Culver JP. Retinotopic mapping of adult human visual cortex with high-density diffuse optical tomography. Proc Natl Acad Sci. 2007;104:12169–12174. doi: 10.1073/pnas.0611266104. [DOI] [PMC free article] [PubMed] [Google Scholar]


