

Abstract
Background
Previous studies have described an “obesity paradox” with heart failure, whereby higher body mass index (BMI) is associated with lower mortality. However, little is known about the impact of obesity on survival after acute myocardial infarction.
Methods
Data from 2 registries of patients hospitalized in the United States with acute myocardial infarction between 2003–04 (PREMIER) and 2005–08 (TRIUMPH) were used to examine the association of BMI with mortality. Patients (n=6359) were categorized into BMI groups (kg/m2) using baseline measurements. Two sets of analyses were performed using Cox proportional hazards regression with fractional polynomials to model BMI as categorical and continuous variables. To assess the independent association of BMI with mortality, analyses were repeated adjusting for 7 domains of patient and clinical characteristics.
Results
Median BMI was 28.6. BMI was inversely associated with crude 1-year mortality (normal, 9.2%; overweight, 6.1%; obese, 4.7%; morbidly obese; 4.6%; p<0.001), which persisted after multivariable adjustment. When BMI was examined as a continuous variable, the hazards curve declined with increasing BMI and then increased above a BMI of 40. Compared with patients with a BMI of 18.5, patients with higher BMIs had a 20% to 68% lower mortality at 1 year. No interactions between age (p=0.37), gender (p=0.87) or diabetes mellitus (p=0.55) were observed.
Conclusions
There appears to be an “obesity paradox” among acute myocardial infarction patients such that higher BMI is associated with lower mortality, an effect that was not modified by patient characteristics and was comparable across age, gender, and diabetes subgroups.
Keywords: body mass index, mortality, myocardial infarction, fractional polynomials, obesity paradox
INTRODUCTION
The prevalence of obesity in the United States has risen dramatically in the past few decades. Current estimates place two-thirds of adults in the United States in the category of overweight or obese as defined by body mass index (BMI).1 In the general population, obesity is associated with numerous comorbidities and an increased risk of adverse outcomes including cardiovascular disease and mortality.2–3 Among patients with chronic disease however, this association may be reversed. Evidence from observational studies of patients with heart failure suggests that obese patients may have improved short- and long-term prognoses.4
This phenomenon, known as the “obesity paradox,” has been replicated in several settings that have shown either an inverse linear or U-shaped association between BMI and all-cause mortality in heart failure patients.5–10 Although the nature of this relationship is unclear, several explanations have been proposed including residual confounding by patient and clinical characteristics. Relatively few studies have explored this relationship in patients with acute coronary syndrome or examined interactions between BMI and other demographic or health-related variables. Moreover, no studies of patients with acute coronary syndromes have examined BMI as a continuous variable to more fully characterize the actual shape of the mortality curve.
Using data from 2 prospective, multicenter registries of patients with acute myocardial infarction, we sought to describe the relationship between BMI and long-term mortality after acute myocardial infarction to determine whether an observed “obesity paradox” could be explained by confounding with other patient and clinical characteristics. In particular, we systematically identified 7 variable domains to assess whether the obesity paradox was attenuated after adjustment for the potential confounders of patient demographics, risk factors and medical history, healthcare access and utilization, psychosocial factors, clinical presentation, patient functional status, and quality of care received. The goal was to identify important factors associated with obesity outcomes so that future interventions could be designed to optimize care for the growing population of obese patients with acute myocardial infarction. In addition, we examined potential interactions between obesity, gender, age, and diabetes mellitus.
METHODS
Patient Population
We combined data from 2 acute myocardial infarction registries: PREMIER (Prospective Registry Evaluating Myocardial Infarction: Events and Recovery) and TRIUMPH (Translational Research Investigating Underlying Disparities in Acute Myocardial Infarction Patients’ Health Status). A detailed description of the PREMIER study has been previously published.11 In brief, 2498 patients with acute myocardial infarction were consecutively enrolled between January 1, 2003 and June 28, 2004 from 19 centers in the United States. Similar to PREMIER, the TRIUMPH study recruited 4340 patients with acute myocardial infarction between April 11, 2005 and December 31, 2008 to identify gaps in knowledge related to racial differences in acute myocardial infarction care. Eligibility criteria for both studies required patients to be aged 18 years or older, have an acute myocardial infarction confirmed by elevated cardiac enzymes (troponin I or creatinine kinase MB), and show supporting evidence of acute myocardial infarction including prolonged (>20 minutes) ischemic symptoms or electrocardiographic ST-elevation changes. Patients who were transferred from other institutions more than 24 hours after symptom onset and patients who developed elevated cardiac enzymes as a complication of elective coronary revascularization were not included. We also excluded patients with missing BMI at baseline (n= 368 (5.4%)) and those who were underweight (BMI<18.5 kg/m2, n=111) to limit confounding by cachexia or other underlying disease. Of the 6838 patients enrolled in PREMIER and TRIUMPH, 368 (5.4%) had missing BMI data at baseline. Compared with patients with recorded BMI values, patients with missing data were less likely to be white (35.5% vs. 71.7%; p<0.001) or have health insurance (66.6% vs. 81.9%; P<0.001). No differences in sex or age were observed. Patients with missing BMI values had significantly higher mortality rates during the index hospitalization (1.9% vs. 0.5%; p=0.006), at 6 months (11.7% vs. 4.2%; p<0.001), and at 1 year (14.9% vs. 6.3%; p<0.001). Among the 6470 patients with BMI data, an additional 111 were excluded because they were underweight. The final study cohort included 6359 patients.
Patients’ demographic, clinical and treatment data were collected from detailed chart abstractions and baseline interviews administered within 24 to 72 hours of the index admission. Institutional review board approval was obtained at each participating center and all patients provided written informed consent to participate.
Variable Definitions
BMI values were calculated from patients’ admission height and weight data, as abstracted from medical records. For analyses that modeled BMI as an ordinal variable, we used criteria from the Centers for Disease Control and Prevention to define the BMI categories: normal weight (18.5 to 24.9 kg/m2), overweight (25 to 29.9 kg/m2), obese (30 to 34.9 kg/m2), and morbidly obese (≥35 kg/m2). In other analyses, we modeled BMI as a continuous variable.
As part of the interview, patients completed a series of questionnaires designed to assess quality of life (Seattle Angina Questionnaire [SAQ]), functional status (Short-Form Health Survey 12 [SF-12]), and depression (Patient Health Questionnaire [PHQ]). The SAQ is a 19-item self-administered questionnaire that measures several domains of coronary artery disease on a scale of 0–100 including disease perception, angina frequency, and quality of life.12 Like the SAQ, the SF-12 also evaluates functional status but contains both physical and mental component summary scales (PCS and MCS), on which lower numbers indicate worse health status.13 The PHQ-9 is a 9-item depression scale used to assess symptoms, functional impairment, and severity of depression.14 All scores were included as continuous variables in multivariate models.
The primary outcome, 1-year all-cause mortality, was obtained through linkage of the Social Security Death Master File to patient identifiers. We also examined 3 variables (age, gender and diabetes mellitus), obtained from baseline medical records and patient interviews, for potential interactions with BMI.
Statistical Analyses
Baseline characteristics of patients across the 4 BMI categories were compared using χ2 tests for categorical variables and analysis of variance for continuous variables. To evaluate the relationship between BMI and mortality, we performed 2 sets of analyses in which we modeled BMI as both a categorical and a continuous variable. For analyses of BMI as a categorical variable, we assessed differences in crude mortality across the 4 categories using χ2 tests and Kaplan-Meier estimates tested by the log-rank method. We repeated analyses using Cox proportional hazards regression stratified by site of care to adjust for patient and clinical characteristics. In addition, we tested for potential interactions between BMI and age, gender and diabetes status.
Covariates for multivariable analyses were selected a priori and categorized into domains using a combination of clinical and statistical judgment. These included: (1) patient demographics (age, gender, race, living arrangement, education level, employment status); (2) risk factors and medical history (smoking status, hypercholesterolemia, hypertension, peripheral artery disease, diabetes mellitus, chronic renal failure); (3) healthcare access (avoidance of medical care due to cost); (4) psychosocial factors (PHQ depression score and antidepressant use); (5) clinical presentation (systolic blood pressure >140 at presentation, left ventricular systolic function < or ≥40%, ST-elevation acute myocardial infarction, Global Registry of Acute Coronary Events (GRACE) risk score);15 (6) functional status (SF-12 PCS, SF-12 MCS, and SAQ scores); and (7) treatment and quality of care received (revascularization procedure, patient instructions including weight management and cardiac rehabilitation, aspirin at arrival and discharge, and beta-blocker at discharge).
Missing covariate data were minimal, with 12% of patients missing any covariate data (9% missing 1 covariate, and 3% missing >1 covariate). Missing data were imputed using a multiple imputation approach in IVEware software (University of Michigan, Ann Arbor, MI).
In the second set of analyses, we modeled BMI as a continuous variable to determine the specific shape of the association between BMI and 1-year mortality. We used proportional hazards regression polynomial modeling of BMI, which combines different linear and non-linear transformations of BMI for different sections of the mortality curve to identify the model that best reflects the association between BMI and mortality. We identified best fitting transformations by comparing model deviances using a χ2 distribution with 1 degree of freedom. We repeated analyses adjusting for site of care as well as the same patient and clinical characteristics detailed above to derive BMI-specific mortality estimates. When graphing the relationship between BMI and mortality, we further restricted the sample to patients with a BMI ≤55 because <1% of patients had a BMI >55. All statistical analyses were conducted with SAS 9.2 (SAS Institute, Cary, NC), Stata SE 9.0 (Stata Corporation, College Station, TX), and R version 2.10.1 (R Foundation for Statistical Computing, Vienna, Austria).
RESULTS
Of the 6359 patients with BMI data, 1449 (22.8%) were normal weight, 2314 (36.4%) were overweight, 1531 (24.1%) were obese, and 1065 (16.8%) were morbidly obese. Table 1 shows the characteristics of the sample at baseline by BMI category. Patients with lower BMIs were on average younger, more educated, more likely to have smoked in the last 30 days, and less likely to avoid getting health care due to cost. Higher proportions of patients in the obese and morbidly obese groups had obesity-associated comorbid conditions, including hypercholesterolemia, hypertension, diabetes mellitus, and depression. Despite these conditions, patients in higher BMI groups on average presented with lower GRACE mortality risk scores, indicating a better prognosis at baseline.
Table 1.
Patient Baseline Characteristics by BMI Category.*
| Normal weight BMI 18.5–24.9 (n=1449) |
Overweight BMI 25–29.9 (n=2314) |
Obese BMI 30–34.9 (n=1531) |
Morbidly obese BMI 35 (n=1065) |
P-value | |
|---|---|---|---|---|---|
| Demographic | |||||
| Age, mean (SD) | 62.9 (13.5) | 60.2 (12.5) | 58.2 (11.7) | 56.1 (11.1) | <.001 |
| Male | 895 (61.8) | 1735 (75.0) | 1068 (69.8) | 585 (54.9) | <.001 |
| Married | 745 (52.0) | 1371 (60.0) | 917 (60.8) | 559 (53.5) | .21 |
| Live alone | 406 (28.5) | 515 (22.6) | 297 (19.6) | 220 (20.9) | <.001 |
| Greater than high school education | 772 (53.7) | 1121 (48.9) | 730 (48.2) | 528 (50.4) | .07 |
| Employment status | <.001 | ||||
| Unemployed | 861 (60.0) | 1100 (48.0) | 728 (48.1) | 558 (53.3) | |
| Employed part-time | 122 (8.5) | 232 (10.1) | 129 (8.5) | 87 (8.3) | |
| Employed full-time | 451 (31.5) | 959 (41.9) | 656 (43.4) | 402 (38.4) | |
| Risk Factors and Medical History | |||||
| Cigarette smoking status | <.001 | ||||
| Never | 337 (23.4) | 470 (20.5) | 337 (22.2) | 291 (27.6) | |
| <100 total | 71 (4.9) | 135 (5.9) | 70 (4.6) | 68 (6.4) | |
| Stopped >1 year ago | 395 (27.5) | 760 (33.1) | 506 (33.4) | 307 (29.1) | |
| Stopped 1 month - 1 year ago | 58 (4.0) | 70 (3.0) | 58 (3.8) | 42 (4.0) | |
| Current (past 30 days) | 577 (40.1) | 861 (37.5) | 546 (36.0) | 348 (33.0) | |
| Alcohol use | <.001 | ||||
| Never | 680 (47.3) | 981 (42.7) | 632 (41.5) | 549 (52.0) | |
| Monthly or less | 294 (20.5) | 541 (23.6) | 434 (28.5) | 289 (27.4) | |
| 2–4 drinks per month | 204 (14.2) | 360 (15.7) | 222 (14.6) | 132 (12.5) | |
| 2–3 drinks per week | 99 (6.9) | 197 (8.6) | 112 (7.4) | 51 (4.8) | |
| 4–5 drinks per week | 120 (8.4) | 158 (6.9) | 78 (5.1) | 21 (2.0) | |
| ≥6 drinks per week | 40 (2.8) | 59 (2.6) | 44 (2.9) | 14 (1.3) | |
| Hypercholesterolemia | 618 (42.7) | 1152 (49.8) | 799 (52.2) | 589 (55.3) | <.001 |
| Hypertension | 850 (58.7) | 1440 (62.2) | 1042 (58.1) | 809 (76.0) | <.001 |
| Peripheral arterial disease | 111 (7.7) | 142 (6.1) | 72 (4.7) | 40 (3.8) | <.001 |
| Diabetes mellitus | 294 (20.3) | 600 (25.9) | 522 (34.1) | 494 (46.4) | <.001 |
| Prior PCI | 250 (17.3) | 442 (19.1) | 312 (20.4) | 222 (20.8) | .01 |
| Chronic renal failure | 137 (9.5) | 169 (7.3) | 98 (6.4) | 84 (7.9) | .06 |
| Healthcare Access and Utilization | |||||
| No insurance | 237 (16.9) | 408 (18.2) | 254 (17.0) | 216 (20.9) | .05 |
| Avoided taking medication due to cost | <.001 | ||||
| Never | 1158 (80.7) | 1849 (81.1) | 1167 (77.2) | 757 (72.2) | |
| Rarely | 79 (5.5) | 124 (5.4) | 115 (7.6) | 78 (7.4) | |
| Occasionally | 103 (7.2) | 150 (6.6) | 111 (7.3) | 109 (10.4) | |
| Frequently | 62 (4.3) | 107 (4.7) | 70 (4.6) | 74 (7.1) | |
| Always | 33 (2.3) | 50 (2.2) | 49 (3.2) | 30 (2.9) | |
| Avoided getting health care due to cost | 301 (21.2) | 481 (21.3) | 341 (22.7) | 282 (27.1) | <.001 |
| Psychosocial Factors | |||||
| Medication use or counseling for depression | 151 (10.5) | 247 (10.8) | 199 (13.2) | 172 (16.4) | <.001 |
| PHQ depression score | 5.1 ± 5.3 | 4.9 ± 5.2 | 5.6 ± 5.6 | 6.5 ± 5.8 | <.001 |
| Clinical Presentation | |||||
| STEMI (vs. NSTEMI) | 616 (42.5) | 1096 (47.4) | 710 (46.4) | 408 (38.3) | .06 |
| High systolic blood pressure (>140) | 605 (42.2) | 1062 (46.5) | 785 (51.9) | 574 (54.7) | <.001 |
| LVSF | <.001 | ||||
| Normal | 798 (55.1) | 1340 (58.0) | 883 (57.8) | 682 (64.2) | |
| Mild | 290 (20.0) | 482 (20.8) | 323 (21.1) | 203 (19.1) | |
| Moderate | 197 (13.6) | 315 (13.6) | 205 (13.4) | 105 (9.9) | |
| Severe | 162 (11.2) | 175 (7.6) | 117 (7.7) | 72 (6.8) | |
| GRACE 6-month mortality risk score | 110.1 ± 32.7 | 102.4 ± 30.8 | 98.4 ± 28.5 | 96.2 ± 28.5 | <.001 |
| Functional Status | |||||
| SF-12 Mental Component Score | 50.1 ± 11.6 | 50.5 ± 11.1 | 49.3 ± 11.8 | 48.5 ± 11.9 | <.001 |
| SF-12 Physical Component Score | 43.1 ± 12.3 | 44.2 ± 12.2 | 42.4 ± 12.3 | 38.8 ± 12.5 | <.001 |
| SAQ Score | 64.1 ± 23.6 | 64.2 ± 23.4 | 62.7 ± 23.5 | 60.4 ± 24.1 | .08 |
| Quality of Care | |||||
| Catheterization | .16 | ||||
| No catheterization | 169 (11.7) | 144 (6.2) | 92 (6.0) | 91 (8.5) | |
| Catheterization only | 303 (20.9) | 381 (16.5) | 253 (16.5) | 221 (20.8) | |
| Revascularization (PCI and CABG) | 977 (67.4) | 1789 (77.3) | 1186 (77.5) | 753 (70.7) | |
| Patient instructions: cardiac rehabilitation | 552 (38.3) | 1043 (45.4) | 701 (46.0) | 468 (44.1) | .002 |
| Patient instructions: weight management | 144 (10.0) | 299 (13.0) | 263 (17.2) | 236 (22.2) | <.001 |
| Aspirin at arrival | 1339 (95.4) | 2218 (95.9) | 1469 (96.0) | 1022 (96.0) | .21 |
| Aspirin at discharge | 1339 (92.4) | 2165 (93.6) | 1429 (93.3) | 977 (91.7) | .79 |
| Beta-blocker at discharge | 1257 (86.7) | 2058 (88.9) | 1379 (90.1) | 951 (89.3) | .002 |
All baseline characteristics were collected from detailed chart abstractions and baseline interviews administered within 24 to 72 hours of the index admission. Unless otherwise noted, data are reported as number (percentage) of patients.
BMI, body mass index; CABG, coronary artery bypass graft; GRACE, Global Registry of Acute Coronary Events; LVSF, left ventricular systolic function; NSTEMI, non-ST-elevation myocardial infarction; PCI, percutaneous coronary intervention; PHQ, Patient Health Questionnaire; SAQ, Seattle Angina Questionnaire; SD, standard deviation; SF-12, Short-Form 12; STEMI, ST-elevation myocardial infarction
After 1 year, there were 392 deaths (6.2%). Patients in higher BMI groups had a lower crude mortality rate (normal, 9.2%; overweight, 6.1%; obese, 4.7%, morbidly obese, 4.6%; p<0.001). Kaplan-Meier survival curves showed differences across BMI categories (p<0.001) with the obese and morbidly obese groups having the lowest risk of death over 1 year (Figure 1). These trends persisted after multivariable adjustment, with patients in the overweight groups having a significantly lower risk of mortality compared with those of normal weight (Table 2). No interactions between age (p=0.54), gender (p=0.97) or diabetes mellitus (p=0.51) were observed.
Figure 1.

Kaplan Meier plot showing unadjusted mortality by category of body mass index; p<.001 using the log-rank test for the overall comparison among the groups.
Table 2.
Unadjusted and Adjusted Risk of 1-Year Mortality for Post-Acute Myocardial Infarction Patients by BMI.
| Normal weight BMI 18.5–24.9 (n=1449) |
Overweight BMI 25–29.9 (n=2314) |
Obese BMI 30–34.9 (n=1531) |
Morbidly obese BMI≥35 (n=1065) |
|
|---|---|---|---|---|
| 1-year mortality rate, % | 9.2 | 6.1 | 4.7 | 4.6 |
| HR (95% CI) | ||||
| Unadjusted | 1 [Reference] | 0.68 (0.54–0.86) | 0.54 (0.40–0.71) | 0.49 (0.35–0.69) |
| Adjusted* | 1 [Reference] | 0.76 (0.59–0.97) | 0.62 (0.45–0.84) | 0.56 (0.39–0.81) |
Adjusted for demographic characteristics (age, gender, race, living arrangement, education level), risk factors and medical history (smoking status, hypercholesterolemia, hypertension, peripheral arterial disease, diabetes, chronic renal failure), healthcare access and utilization (avoided medical care due to cost), psychosocial factors (Patient Health Questionnaire score), clinical presentation (systolic blood pressure >140 at presentation, left ventricular systolic function, ST-elevation acute myocardial infarction, GRACE risk score), functional status (SF-12 Physical Component Summary scale, SF-12 Mental Component Summary scale, Seattle Angina Questionnaire scores), and quality of care received (revascularization procedure, patient instructions including weight management and cardiac rehabilitation, aspirin at arrival and discharge, and beta-blockers at discharge).
BMI, body mass index; CI, confidence interval; GRACE, Global Registry of Acute Coronary Events; HR, hazard ratio
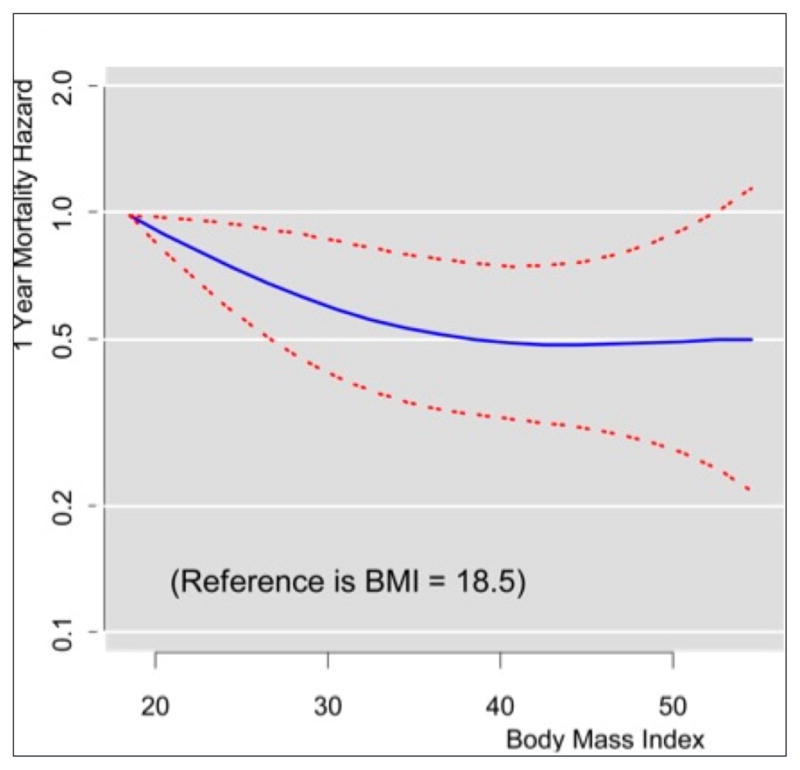
When the relationship between BMI and mortality was examined as a continuous variable using proportional hazards regression, a fractional polynomial with 3 terms best modeled the unadjusted association (Figure 2). The hazards curve appeared to decline with increasing BMI and then increase above a BMI of 40. When compared with patients with a BMI of 18.5, patients with higher BMIs had hazard ratios ranging from 0.32 to 0.80, reflecting a 20% to 68% lower mortality at 1 year. The lowest hazards were observed for patients with BMIs between 34 and 40 (Table 3).
Figure 2.

Unadjusted 1-year mortality as a function of body mass index with 95% confidence intervals.
Table 3.
Hazards of 1-Year Mortality by BMI in Post-Acute Myocardial Infarction Patients.
| BMI (kg/m2) | Unadjusted HR (95% CI) | Adjusted HR (95% CI)* |
|---|---|---|
| 18.5 | 1 [Reference] | 1.00 [Reference] |
| 20.5 | 0.80 (0.72–0.89) | 0.91 (0.83–0.99) |
| 22.5 | 0.65 (0.53–0.79) | 0.82 (0.69–0.98) |
| 24.5 | 0.54 (0.41–0.71) | 0.75 (0.59–0.96) |
| 26.5 | 0.46 (0.33–0.64) | 0.69 (0.51–0.93) |
| 28.5 | 0.40 (0.28–0.58) | 0.64 (0.46–0.90) |
| 30.5 | 0.36 (0.25–0.53) | 0.60 (0.41–0.87) |
| 32.5 | 0.34 (0.23–0.50) | 0.57 (0.38–0.84) |
| 34.5 | 0.32 (0.22–0.48) | 0.54 (0.36–0.81) |
| 36.5 | 0.32 (0.22–0.47) | 0.52 (0.35–0.79) |
| 38.5 | 0.32 (0.22–0.47) | 0.51 (0.34–0.77) |
| 40.5 | 0.33 (0.22–0.48) | 0.50 (0.33–0.77) |
| 42.5 | 0.34 (0.23–0.51) | 0.49 (0.32–0.76) |
| 44.5 | 0.36 (0.24–0.55) | 0.49 (0.31–0.78) |
| 46.5 | 0.39 (0.25–0.60) | 0.49 (0.30–0.81) |
| 48.5 | 0.41 (0.25–0.67) | 0.50 (0.29–0.85) |
| 50.5 | 0.42 (0.24–0.76) | 0.50 (0.27–0.92) |
| 52.5 | 0.43 (0.21–0.90) | 0.51 (0.25–1.02) |
| 54.5 | 0.42 (0.16–1.11) | 0.51 (0.22–1.17) |
Adjusted for demographic characteristics (age, gender, race, living arrangement, education level), risk factors and medical history (smoking status, hypercholesterolemia, hypertension, peripheral arterial disease, diabetes, chronic renal failure), healthcare access and utilization (avoided medical care due to cost), psychosocial factors (Patient Health Questionnaire score), clinical presentation (systolic blood pressure >140 at presentation, left ventricular systolic function, ST-elevation acute myocardial infarction, GRACE risk score), functional status (SF-12 Physical Component Summary scale, SF-12 Mental Component Summary scale, Seattle Angina Questionnaire scores), and quality of care received (revascularization procedure, patient instructions including weight management and cardiac rehabilitation, aspirin at arrival and discharge, and beta-blockers at discharge).
BMI, body mass index; CI, confidence interval; HR, hazard ratio
Higher BMIs continued to be associated with decreased mortality after multivariable adjustment (Figure 3). The survival curve appeared to decrease with increasing BMI and then plateau around a BMI of 40. Hazard ratios for patients with BMIs >18.5 ranged from 0.49 to 0.90, indicating a 10% to 51% reduction in 1-year mortality (Table 3).
Figure 3.
Adjusted 1-year mortality as a function of body mass index with 95% confidence intervals.
DISCUSSION
Despite adjusting for many previously unstudied patient characteristics, this study confirms a paradoxical association between BMI and mortality after acute myocardial infarction. In general, higher BMI was associated with lower long-term mortality. The relationship between BMI and mortality appeared to be J-shaped with an inflection point around a BMI of 40. We observed this effect to be independent of the 7 patient and clinical domains we identified, such that the obesity paradox does not appear to be an artifact of confounding by patient or clinical characteristics.
While previous studies of heart failure patients have generally shown that higher BMIs are associated with better outcomes, studies of post-acute myocardial infarction patients are less consistent. Some have found a survival advantage conferred by excess weight16–20 whereas others have found no association.21–22 Studies that failed to find an association, however, were generally small and limited to single centers. Still others have reported lower mortality for overweight and obese patients in the short term but no differences in the long term.23–24 In addition, a few studies have reported interactions with gender20 and age.23 Hoit et al. found a survival advantage among obese patients younger than 65 at 1 year but found that the reverse was true in patients aged 65 and older.23 In contrast, we did not find evidence of an interaction between BMI and age.
Although the exact mechanism by which obesity may improve outcomes after acute myocardial infarction is unknown, a number of theories have been proposed. One potential explanation is that overweight and obese patients present earlier in the progression of acute myocardial infarction symptoms. This may be due to increased awareness of their risk of having an acute myocardial infarction or because of more severe symptoms due to increased myocardial demands that accompany excess weight. Overweight and obese patients may also have less severe left ventricular dysfunction at presentation. In a subanalysis of acute myocardial infarction patients from the Global Utilization of Streptokinase and Tissue Plasminogen Activator for Occluded Coronary Arteries (GUSTO-I) trial, Lundergan et al. found that increasing BMI was associated with greater preservation of left ventricular function and improved 30-day survival.25 Overweight and obese subjects in our study also presented with lower rates of moderate and severe left ventricular systolic dysfunction and lower GRACE scores, which may be related to an earlier presentation and may partly explain the association between higher BMI and better prognosis.
Patients with low BMIs may have a worse prognosis after acute myocardial infarction due to the presence of cardiac cachexia. These patients may experience weight loss due to additional comorbidities, recent illness, or other BMI-associated risk factors for mortality including malnutrition, multi-organ dysfunction, and depression.26–27 Although we attempted to reduce the potential for confounding by cachexia by excluding underweight patients from the analysis, the possibility exists for residual confounding in the normal weight group.
Other theories related to treatment eligibility and prognosis have also been proposed. For example, some studies have speculated that the lack of a functional reserve in underweight and normal weight patients may lead to unfavorable hemodynamic changes, which can preclude these patients from receiving therapies or make them vulnerable to adverse procedure-related complications.28 In our sample, it is important to note that 77% of overweight and obese patients underwent revascularization procedures compared with only 67% of normal weight patients. Similarly, other studies have suggested that overweight and obese patients may fare better after catheterization because they have larger coronary vessels and thus a more favorable artery/device ratio.29
The results of our study should be considered in light of its potential limitations. First, we used BMI values measured at the index hospitalization and did not consider potential changes in BMI over the study follow-up. However, results from a study by Fadl et al. show that patients’ weights in PREMIER changed very little in the year post-acute myocardial infarction, suggesting that changes are unlikely to have biased our results.30 Second, we were unable to account for fat distribution (peripheral vs. abdominal obesity) and other measures of adiposity such as body fat percentage. While BMI is widely used in clinical settings to categorize patients as overweight or obese, it may be an imperfect measure. Third, a small though potentially significant number of patients (5.4%) were excluded from the sample due to missing BMI data. Because these patients had significantly higher mortality rates than patients in the sample, an element of selection bias may be possible. Fourth, patients in this study were followed for 1 year only and our description of the relationship between obesity and improved survival may not extend beyond that period. Finally, this sample was drawn from large, urban medical centers in the United States and may not be generalizable to all patient populations, particularly those in rural areas.
In summary, we observed an obesity paradox among patients with acute myocardial infarction in which higher BMI is associated with improved survival. This effect appeared to be independent of other patient and clinical characteristics and comparable across gender, age and diabetes subpopulations. Clinically, these findings are most relevant for patient risk stratification and prognosis at baseline. Future studies evaluating weight changes during follow-up are needed to inform guidelines for weight management in patients following acute myocardial infarction. In addition, future research should aim to understand the mechanisms underlying the obesity paradox and to characterize the obesity paradox in certain patient subgroups.
Acknowledgments
Dr. Krumholz discloses that he chairs a cardiac scientific advisory board for UnitedHealth and is the recipient of a research grant from Medtronic, Inc. through Yale University.
Dr. Spertus discloses that he serves as a consultant for UnitedHealth. Dr. Krumholz is supported by grant U01 HL105270-02 (Center for Cardiovascular Outcomes Research at Yale University) from the National Heart, Lung, and Blood Institute. Dr. Spertus is supported by grant P50 HL077113 from the National Heart, Lung, and Blood Institute.
There was no sponsor involvement in the design and conduct of the study; collection, management, analysis, and interpretation of the data; and preparation, review, or approval of the manuscript. Ms. Reid had full access to all the data in the study and takes responsibility for the integrity of the data and accuracy of the data analyses.
Funding:
Dr. Krumholz is supported by grant U01 HL105270-02 (Center for Cardiovascular Outcomes Research at Yale University) from the National Heart, Lung, and Blood Institute. Dr. Spertus is supported by grant P50 HL077113 from the National Heart, Lung, and Blood Institute.
Footnotes
Conflicts of Interest:
Dr. Krumholz discloses that he chairs a cardiac scientific advisory board for UnitedHealth and is the recipient of a research grant from Medtronic, Inc. through Yale University. Dr. Spertus discloses that he serves as a consultant for UnitedHealth. Ms. Bucholz, Mr. Rathore, Ms. Reid, Mr. Jones, Dr. Chan, and Dr. Rich have no conflicts of interest to disclose.
Contributions:
The authors had access to the data, read and had a role in writing the final manuscript, and agree to its submission in The American Journal of Medicine. They meet the criteria for authorship as follows: Conception and design (EB, SR, HK, PC, MR), analysis (EB, SR, KR, PJ), drafting (EB, HK, SR, JS), and review of the manuscript for intellectual content (EB, SR, HK, KR, PC, MR, PJ, JS).
Publisher's Disclaimer: This is a PDF file of an unedited manuscript that has been accepted for publication. As a service to our customers we are providing this early version of the manuscript. The manuscript will undergo copyediting, typesetting, and review of the resulting proof before it is published in its final citable form. Please note that during the production process errors may be discovered which could affect the content, and all legal disclaimers that apply to the journal pertain.
References
- 1.Ogden CT, Carroll MD, Curtin LF, et al. Prevalence of overweight and obesity in the United States, 1999–2004. JAMA. 2006;295(13):1549–1555. doi: 10.1001/jama.295.13.1549. [DOI] [PubMed] [Google Scholar]
- 2.Calle EE, Thun MJ, Petrelli JM, et al. Body mass index and mortality in a prospective cohort of US adults. N Engl J Med. 1999;341(15):1097–1105. doi: 10.1056/NEJM199910073411501. [DOI] [PubMed] [Google Scholar]
- 3.Peeters A, Barendregt JJ, Wilekens F, et al. Obesity in adulthood and its consequences for life expectancy: a life-table analysis. Ann Intern Med. 2003;138(1):24–32. doi: 10.7326/0003-4819-138-1-200301070-00008. [DOI] [PubMed] [Google Scholar]
- 4.Morse SA, Gulati R, Reisin E. The obesity paradox and cardiovascular disease. Curr Hypertens Rep. 2010;12(2):120–126. doi: 10.1007/s11906-010-0099-1. [DOI] [PubMed] [Google Scholar]
- 5.Horwich TB, Fonaraow GC, Hamilton MA, et al. The relationship between obesity and mortality in patients with heart failure. J Am Cardiol. 2001;38(3):789–795. doi: 10.1016/s0735-1097(01)01448-6. [DOI] [PubMed] [Google Scholar]
- 6.Curtis JP, Selter JG, Wang Y, et al. The obesity paradox: body mass index and outcomes in patients with heart failure. Arch Intern Med. 2005;165(1):55–61. doi: 10.1001/archinte.165.1.55. [DOI] [PubMed] [Google Scholar]
- 7.Fonarow GC, Srikanthan P, Costanzo MR, et al. An obesity paradox in acute heart failure: analysis of body mass index and inhospital mortality for 108,927 patients in the Acute Decompensated Heart Failure National Registry. Am Heart J. 2007;153(1):74–81. doi: 10.1016/j.ahj.2006.09.007. [DOI] [PubMed] [Google Scholar]
- 8.Wu AH, Eagle KA, Montgomery DG, et al. Relation of body mass index to mortality after development of heart failure due to acute coronary syndrome. Am J Cardiol. 2009;103(12):1736–1740. doi: 10.1016/j.amjcard.2009.02.026. [DOI] [PubMed] [Google Scholar]
- 9.Cicoira M, Maggioni AP, Latini R, et al. Body mass index, prognosis, and mode of death in chronic heart failure: results from the Valsartan Heart Failure Trial. Eur J Heart Fail. 2006;9(4):397–402. doi: 10.1016/j.ejheart.2006.10.016. [DOI] [PubMed] [Google Scholar]
- 10.Kenchaiah S, Gaziano JM, Vasan RS. Impact of obesity on the risk of heart failure and survival after the onset of heart failure. Med Clin North Am. 2004;88(5):1273–1294. doi: 10.1016/j.mcna.2004.04.011. [DOI] [PubMed] [Google Scholar]
- 11.Spertus JA, Peterson E, Rumsfeld JS, et al. The Prospective Registry Evaluating Myocardial Infarction: Events and Recovery (PREMIER)–Evaluating the impact of myocardial infarction on patient outcomes. Am Heart J. 2006;151(3):589–597. doi: 10.1016/j.ahj.2005.05.026. [DOI] [PubMed] [Google Scholar]
- 12.Spertus J, Winder J, Dewhurst T, et al. Development and evaluation of the Seattle Angina Questionnaire: a new functional status measure for coronary artery disease. J Am Coll Cardiol. 1995;25(2):333–341. doi: 10.1016/0735-1097(94)00397-9. [DOI] [PubMed] [Google Scholar]
- 13.Ware J, Jr, Kosinski M, Keller SD. A 12-item short-form health survey: construction of scales and preliminary tests of reliability and validity. Med Care. 1996;34(3):220–233. doi: 10.1097/00005650-199603000-00003. [DOI] [PubMed] [Google Scholar]
- 14.Kroenke K, Spitzer RL, Williams JB. The PHQ-9: validity of a brief depression severity measure. J Gen Intern Med. 2001;16(9):606–613. doi: 10.1046/j.1525-1497.2001.016009606.x. [DOI] [PMC free article] [PubMed] [Google Scholar]
- 15.Granger CB, Goldberg RJ, Dabbous O, et al. Predictors of hospital mortality in the Global Registry of Acute Coronary Events. Arch Intern Med. 2003;163(19):2345–2353. doi: 10.1001/archinte.163.19.2345. [DOI] [PubMed] [Google Scholar]
- 16.Wienbergen H, Gitt AK, Juenger C, et al. Impact of body mass index on occurrence and outcome of acute ST-elevation myocardial infarction. Clin Res Cardiol. 2008;97(2):83–88. doi: 10.1007/s00392-007-0585-x. [DOI] [PubMed] [Google Scholar]
- 17.Mehta RH, Califf RM, Garg J, et al. The impact of anthropomorphic indices on clinical outcomes in patients with acute ST-elevation myocardial infarction. Eur Heart J. 2007;28(4):415–424. doi: 10.1093/eurheartj/ehl329. [DOI] [PubMed] [Google Scholar]
- 18.Nicoletti I, Cicoira M, Morando G, et al. Impact of body mass index on short-term outcome after acute myocardial infarction: does excess body weight have a paradoxical protective role? Int J Cardiol. 2006;107(3):395–399. doi: 10.1016/j.ijcard.2005.04.005. [DOI] [PubMed] [Google Scholar]
- 19.Lee SH, Park JS, Kim W, et al. Impact of body mass index and waist-to-hip ratio on clinical outcomes in patients with ST-segment elevation acute myocardial infarction. Am J Cardiol. 2008;102(8):957–965. doi: 10.1016/j.amjcard.2008.06.022. [DOI] [PubMed] [Google Scholar]
- 20.Kragelund C, Hassager C, Hildebrandt P, et al. Impact of obesity on long-term prognosis following acute myocardial infarction. Int J Cardiol. 2005;98(1):123–131. doi: 10.1016/j.ijcard.2004.03.042. [DOI] [PubMed] [Google Scholar]
- 21.Iakobishvili Z, Danicek V, Porter A, et al. Is increased body mass index associated with a cardioprotective effect after ST-segment-elevation myocardial infarction? Acute Card Care. 2006;8(2):95–98. doi: 10.1080/17482940600768673. [DOI] [PubMed] [Google Scholar]
- 22.Wells B, Gentry M, Ruiz-Arango A, et al. Relation between body mass index and clinical outcome in acute myocardial infarction. Am J Cardiol. 2006;98(4):474–477. doi: 10.1016/j.amjcard.2006.02.053. [DOI] [PubMed] [Google Scholar]
- 23.Hoit BD, Gilpin A, Maisel AA, et al. Influence of obesity on morbidity and mortality after acute myocardial infarction. Am Heart J. 1987;114(6):1334–1341. doi: 10.1016/0002-8703(87)90534-5. [DOI] [PubMed] [Google Scholar]
- 24.Nigam A, Wright RS, Allison TG, et al. Excess weight at time of presentation of myocardial infarction is associated with lower initial mortality risks but higher long-term risks including recurrent re-infarction and cardiac death. Int J Cardiol. 2006;110(2):153–159. doi: 10.1016/j.ijcard.2005.06.040. [DOI] [PubMed] [Google Scholar]
- 25.Lundergan CF, Ross AM, McCarthy WF, et al. Predictors of left ventricular function after acute myocardial infarction: effects of time to treatment, patency, and body mass index. Am Heart J. 2001;142(1):43–50. doi: 10.1067/mhj.2001.116076. [DOI] [PubMed] [Google Scholar]
- 26.Habbu A, Lakkis NM, Dokainish H. The obesity paradox: fact or fiction? Am J Cardiol. 2006;98(7):944–948. doi: 10.1016/j.amjcard.2006.04.039. [DOI] [PubMed] [Google Scholar]
- 27.Knudtson MD, Klein BE, Klein R, Shankar A. Association with weight loss and subsequent mortality risk. Ann Epidemiol. 2005;15(7):483–491. doi: 10.1016/j.annepidem.2004.12.003. [DOI] [PubMed] [Google Scholar]
- 28.Steinberg BA, Cannon CP, Hernandez AF, et al. Medical therapies and invasive treatments for coronary artery disease by body mass: the “obesity paradox” in Get With The Guideline database. Am J Cardiol. 2007;100(9):1331–1335. doi: 10.1016/j.amjcard.2007.06.019. [DOI] [PubMed] [Google Scholar]
- 29.Schunkert H, Harrel L, Palacios IF. Implication of small reference vessel diameter in patients undergoing percutaneous revascularization. J Am Coll Cardiol. 1999;34(1):40–48. doi: 10.1016/s0735-1097(99)00181-3. [DOI] [PubMed] [Google Scholar]
- 30.Fadl YY, Krumholz HM, Kosiborod M, et al. Predictors of weight change in overweight patients with myocardial infarction. Am Heart J. 2007;154(4):711–717. doi: 10.1016/j.ahj.2007.06.006. [DOI] [PubMed] [Google Scholar]