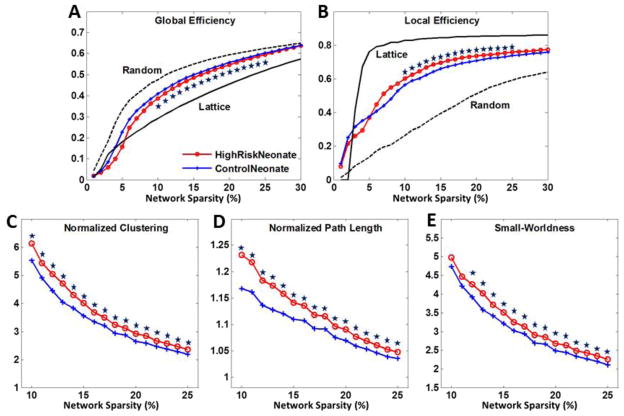
Figure 3.
Network properties of (A) global efficiency, (B) local efficiency, (C) normalized clustering, (D) normalized path length, and (E) small-worldness as functions of network sparsity for morphological networks of high-risk neonates (red) and control neonates (blue). Mean and standard deviation of network properties were illustrated at each sparsity level. Data points marked with stars indicate significant differences (p<0.01 by permutation test) were achieved within sparsity of 10–25%.

