

Abstract
Individual differences in impulsive choice behavior have been linked to a variety of behavioral problems including substance abuse, smoking, gambling, and poor financial decision-making. Given the potential importance of individual differences in impulsive choice as a predictor of behavioral problems, the present study sought to measure the extent of individual differences in a normal sample of hooded Lister rats. Three experiments utilized variations of a delay discounting task to measure the degree of variation in impulsive choice behavior across individual rats. The individual differences accounted for 22–55% of the variance in choice behavior across the three experiments. In Experiments 2 and 3, the individual differences were still apparent when behavior was measured across multiple choice points. Large individual differences in the rate of responding, and modest individual differences in timing of responding were also observed during occasional peak trials. The individual differences in timing and rate, however, did not correlate consistently with individual differences in choice behavior. This suggests that a variety of factors may affect choice behavior, response rate, and response timing.
Keywords: impulsive behavior, choice, delay discounting, timing, rats
According to models of impulsive choice (e.g., Ainslie, 1975; Mazur, 2001; Rachlin, 2000), self-control involves placing a higher value on larger-valued future consequences compared to the lower value given to more immediate smaller rewards. Self-control is often measured in the context of temporal discounting tasks (see, for example, Rachlin), in which individuals are presented with choices between a smaller reward delivered after a shorter delay (the smaller–sooner, or SS, reward) and a larger reward delivered after a longer delay (the larger–later, or LL, reward). In this context, individuals will choose the LL over the SS reward when the delay to deliver the larger reward is relatively short; however, as the delay to the larger reward increases, its subjective value decreases, making the SS reward more preferable. Self-control has been defined as the preference for the LL over a SS reward when the LL is the more profitable outcome (in terms of rewards earned per unit time); the preference for the opposite choice has been considered indicative of poor self-control, or impulsive choice.
The phenomenon by which the value of a reward is discounted over time is known as delay discounting (Mazur, 1987) and has frequently been used to explain impulsive choice behavior in both humans (Dixon, Jacobs, & Sanders, 2006; Dixon, Marley, & Jacobs, 2003; Green, Myerson, & Ostaszewski, 1999a, 1999b; Johnson & Bickel, 2002) and nonhuman animals (Green & Estle, 2003; Ito & Asaki, 1982; Kobayashi & Schultz, 2008; Madden, Smith, Brewer, Pinkston, & Johnson, 2008; Mazur, 1987, 2007a, 2007b; Rodriguez & Logue, 1988). According to discounting models of impulsive choice (Ainslie, 1975; Mazur, 2001; Rachlin, 2000), as discount rates increase, choices for the more immediate over delayed rewards tend to increase.
Higher discounting rates have been implicated in behaviors associated with attention-deficit/hyperactivity disorder (ADHD; Barkley, Edwards, Laneri, Fletcher, & Metevia, 2001; Kuntsi, Oosterlaan, & Stevenson, 2001; Luman, Oosterlaan, & Sergeant, 2005; Schweitzer & Sulzer-Azaroff, 1995; Solonto et al., 2001; Sonuga-Barke, Taylor, Sembi, & Smith, 1992; Tripp & Alsop, 2001), pathological gambling (Dixon, et al., 2006; Dixon, et al., 2003) and poor financial planning (Angeletos, Laibson, Repetto, Tobacman, & Weinberg, 2001). In addition, several studies have demonstrated that substance abusers, in comparison to non-substance abusers, tend to have higher discounting rates for delayed rewards, including users of opioids (Kirby & Petry, 2004; Kirby, Petry, & Bickel, 1999; Madden, Petry, Badger, & Bickel, 1997), cocaine (Coffey, Gudleski, Saladin, & Brady, 2003; Kirby & Petry, 2004), methamphetamine (Monterosso et al., 2007), nicotine (Baker, Johnson, & Bickel, 2003; Bickel, Odum, & Madden, 1999; Mitchell, 1999) and alcohol (Bobova, Finn, Rickert, & Lucas, 2009; Vichinich & Simpson, 1998). Discounting rates also predict abstinence rates for individuals enrolled in smoking cessation treatment programs, with those that exhibit less self-controlled choice more likely to relapse (e.g., Krishnan-Sarin et al., 2007; Yoon et al., 2007). Because self-control seems to affect many aspects of human and animal behavior, understanding the bases of individual differences in delay discounting is an important task. If the source of individual differences can be identified, then this could greatly promote the development of interventions in a number of different situations. For example, individuals could be screened to identify those at risk for problems such as the development of substance abuse, gambling, or poor financial decision-making, or those who would have a greater susceptibility to relapse following treatment for addictive disorders such as alcohol or drug abuse, gambling, or food addictions.
Not only do individual differences in impulsive choice appear to predict a variety of health-related behaviors, it also appears that impulsive choice may qualify for consideration as a trait variable. In research involving human participants, Kirby (2009) demonstrated that impulsive choice behavior was stable over the course of one year, with test–retest reliability rates comparable to many personality traits (see also Jimura et al., 2011; Simpson & Vuchinich, 2000). In addition, Odum (2011b; Odum & Baumann, 2010) demonstrated significant correlations in impulsive choice behavior for different commodities, such as food, cigarettes, and money. These findings indicate that individual differences in impulsive choice persist across situations, another important factor in demonstrating that impulsive choice may be a trait variable.
Despite the extensive literature that has disclosed individual differences in impulsive choice and that has shown a relationship between impulsive choice behavior and a variety of psychological disorders in humans, relatively little research has examined: (a) the stability of impulsive choice across situations; or (b) the degree of variance in impulsive choice in the normal population for rat preclinical models. Most of the studies mentioned above conducted one-time assessments of delay discounting in targeted subpopulations and, in addition, the previous examinations of trait characteristics of impulsive choice have focused on human participants. Given that the rat is an important preclinical model for examining the neural and psychological mechanisms of impulsive choice and the relationship of impulsive choice with drug abuse (Anderson & Diller, 2010; Locey & Dallery, 2009; Perry, Larson, German, Madden, & Carroll, 2005), it has become increasingly important to assess individual differences in impulsive choice in rats.
Harzem (1984) suggested that in experiments with animals; where prior experiences and the experimental conditions can be controlled, individual differences in behavior are likely to be related to either biological factors, or variability that may be a basic property of behavior, or a combination of both. He also noted that individual differences are impossible to eliminate and that they affect all aspects of behavioral research and interact in important ways with experimental variables. As a result, he argued that individual differences should be explicitly included in the analysis of experimental data in many situations. In terms of impulsive choice and delay discounting, it seems that individual differences are not only pervasive and persistent, but they may also serve to provide important predictions for other behaviors that are central to well-being.
The present set of experiments sought to examine the degree of variance in impulsive choice behavior in a normal population of rats on previously reported choice tasks (Experiments 1–3) and to evaluate if the individual differences observed were stable across choice situations (Experiments 2 and 3). In addition, response rates and the timing of responses were examined to determine possible correlates of impulsive choice that may give clues to underlying sources of individual differences.
EXPERIMENT 1
Experiment 1 sought to examine individual differences using an impulsive choice task. The goal of this experiment was to determine the degree of individual differences in SS versus LL choices. The training procedure closely resembled the procedure used by Green and Estle (2003) with an additional measure to examine timing behavior that was developed for the current study. In their study, rats were tested for delay discounting with both food and water. Although this was not the focus of their paper, and so not explicitly measured or discussed, considerable individual differences in choice behavior were evident for both rewards. To assess individual differences in the present study, four groups of rats received different combinations of SS and LL delays. In all cases, the SS reward was one pellet and the LL reward was two pellets, but the SS and LL delays differed across the four groups: 5/15 s, 5/20 s, 10/30 s, and 15/30 s. Based on previous studies with similar delays to those used in the current study, SS choices should increase as a function of the relatively increasing delay between the SS and LL options and as a function of the absolute delay to both alternatives (e.g., Green & Estle, 2003; Ito & Asaki, 1982).
Method
Subjects
The subjects were 24 male hooded Lister rats (Charles River, UK) approximately 12 weeks old and with a mean ad libitum weight of 389 g (range = 350 - 420 g). Prior to experimental testing, the rats' weights were reduced to and maintained at 85% of their original ad lib weight by restricted feeding of standard laboratory chow (Lab Diet 2002, IPS, UK). The rats were housed in pairs with free access to water in two different colony rooms that were maintained on a 12:12 hr light–dark cycle for 12 rats and a reversed 12:12 hr light–dark cycle for the remaining 12 rats. The experimental testing was carried out during the dark portion of the cycle in both cases.
Apparatus
The experiment was conducted in a set of 12 operant chambers (Med Associates, Vermont, USA). Each chamber measured 25 × 30 x 30 cm and was housed inside of a ventilated, noise attenuating box measuring 74 × 38 x 60 cm. Each chamber was equipped with a speaker for delivering auditory stimuli, two levers, a houselight, a food cup and a water bottle. The speaker was located on the left side of the back wall of the chamber, on the opposite wall from the food cup. The houselight was positioned in the top center of the front wall. Two retractable levers (ENV-122CM) were situated on either side of the food cup at approximately one third of the total height of the chamber; lever presses were recorded by a microswitch. A magazine pellet dispenser (ENV-203) delivered 45-mg food pellets (TestDiet MLab rodent tablet) into the food cup. Each head entry into the food cup was transduced by an LED-photocell. The water bottle was mounted outside the chamber; water was available through a metal tube that protruded through a hole in the lower center of the back wall. Med-PC (Tatham & Zurn, 1989), running on two PC computers (one for each set of six chambers), controlled experimental events and recorded the time of events with a 2-ms resolution.
Procedure
Rats were trained in sessions lasting for a maximum of 11 hr that were divided into blocks, with breaks in between. All rats received two sessions of pretraining consisting of an introductory adaptation period of 30 min during which the operant boxes were not illuminated and no cues were presented, followed by two training blocks per session with a 90-min break between blocks during which the operant chambers were in the same state as the adaptation period. In Block 1 of Session 1, the rats received 40 single-pellet food deliveries on a variable time (VT) 180-s schedule. The second block consisted of four sub-blocks within which the rats received a one-pellet food delivery for each lever press (continuous reinforcement; CRF). Pressing the left and right levers was trained independently in alternating blocks for a total of 15 food deliveries per sub-block; there was a 10-min interval between each sub-block during which no experimental events were delivered. The remaining session consisted of two blocks that followed a similar structure; however delivery of food followed a variable ratio schedule with a mean of three and five lever presses per food delivery, respectively, and with five food deliveries per sub-block. The chambers were dark throughout the session; the onset of a block was cued by the insertion of a lever, and the end of a block by lever withdrawal.
Following initial pretraining, the rats were randomly assigned to one of four groups (n = 6): 5/15, 5/20, 10/30, and 15/30; and were trained on a discrete-trial choice procedure. The group labels signify the delay to reward on the SS and LL trials, respectively. All rats received a mixture of free choice, forced choice, and peak trials that were separated by a 120-s fixed ITI; fixed ITIs have been argued to mimic real-life choice situations because they allow for reward maximization (Odum, 2011a). The sessions lasted for approximately 11 hr and consisted of an introductory 30-min adaptation period followed by four blocks of trials, with a 90-min rest period between each block as in pretraining. Each trial block consisted of 8 SS forced choice, 2 SS peak, 8 LL forced choice, 2 LL peak, and 30 free choice trials presented in a random order. On free choice trials, the SS and the LL levers were inserted to begin the trial. When the rat pressed one of the levers, then the opposing lever was retracted and a fixed interval schedule was initiated on the chosen lever. Once the target interval elapsed, the next lever press resulted in the delivery of a single food pellet on SS trials and two food pellets on LL trials. Forced choice trials were conducted in the same fashion as free choice trials except that only one lever was inserted at the start of the trial. As soon as the rat pressed the lever, then the fixed interval schedule was initiated. Peak trials were the same as forced choice trials, except that peak trials lasted for 90 s and were not reinforced. Lever presses were monitored during the peak trials, but had no consequence. The allocation of the SS and LL choices to the left and right levers was counterbalanced across rats. These contingencies remained in place for at least 20 sessions and until the rats showed stable choice behavior of no more than 10% variation over a three day mean (average 25 sessions).
Data Analysis
All analyses were conducted in SPSS (SPSS Inc, Chicago, IL) and Matlab (The Mathworks Inc, Natick, MA) unless otherwise stated and using data collected during the last 10 sessions of the experiment. A significance criterion of p < .05 was used.
Percent SS choices
The percentage of choices made to the SS option was measured on free choice trials only. This was computed by dividing the number of SS choices by the total number of choices and multiplying by 100.
Response rate functions
The response rate functions provided an index of response rate (in responses/min) as a function of time on peak trials as a measure of anticipation of the usual time of reinforcement. The frequency of responses in successive 1-s bins was determined during each peak trial and summed across trials. The frequency of response in each bin was divided by the total number of trials included in the analysis and then multiplied by 60 to provide a measure of responses/min.
Low-high-low analysis
Although the overall response rate function is often approximated by a bell-shaped curve, the response on individual trials is more appropriately characterized as a low-high-low pattern. Typically, a low rate occurs early in the trial, but then transitions abruptly to a high rate as the time of reinforcement draws nearer, followed by a transition to a low rate of response sometime after the expected time of reinforcement passes. To identify these high-rate periods of responding, a low-high-low analysis was conducted on each peak trial (Church, Meck, & Gibbon, 1994; Galtress & Kirkpatrick, 2009). This involved an exhaustive search for the best fitting low-high-low model which maximized the value of the index:
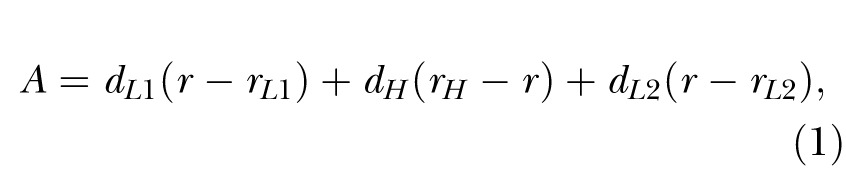 |
where r was the mean response rate over the whole trial and rL1, rH and rL2 were the response rates in the first low, the high and the second low states, respectively, and dL1, dH and dL2 were the durations of those states. The only constraint on the analysis was that the end time had to be later than the start time, and that the R2 (metric of the goodness of fit of the low-high-low model to the data) for the trial had to exceed 0.05. This latter constraint was to remove trials in which the rat did not exhibit a clear response burst, which is indicative of poor temporal control over behavior. The time of the transition from a low to high rate was recorded as the start (s) time and the time of the transition from a high to low rate was recorded as the end (e) time, respectively. The high-state duration (d) was determined as e-s. The middle time was s + (d/2), a derived measure of the middle of the high-state response function; this is an alternative to the measure of the time of maximum (peak) response rate (Church, et al., 1994). The response rate in the high state was the number of high-state responses divided by the high-state duration.
ANOVA model and estimates of effect size
An ANOVA was conducted with the between-groups variable of Group, and the within-subject variable of Session (last 10 sessions). To gain an index of the strength of the contribution of the individual differences, two measures of effect size were computed. The first measure was a standard η2 statistic, which was used to determine the percentage of variance accounted for by each of the variables in the experiment. This measure is useful for comparing the relative contribution of each of the variables in relation to the contribution of the individual differences. The computation used the following equation:
 |
where SSEffect was the sum of squares associated with each effect in the model (Session, Group, or Session x Group) and SSTotal was the total sum of squares adjusted for the grand mean. To compute the variance accounted for by the individual differences, SSEffect was the error sum of squares from the Group effect. The η2 values add to 100% if computations are made for all variables and error terms in the ANOVA.
The second estimate of effect size was the generalized eta-squared statistic,  (Bakeman, 2005; Olejnik & Algina, 2003). Olejnik and Algina derived this statistic to deal with some of the common problems with the standard and partial
  statistics. Of particular relevance to the present paper is that traditional approaches to effect size computations do not account for differences in blocking effects present in between-subjects versus repeated-measures designs. While Experiment 1 used a mixed design, Experiments 2 and 3 (below) used a two-factor nested repeated-measures design, so the generalized statistic was used to facilitate comparison across these designs. The generalized eta-squared statistic was determined by the equation
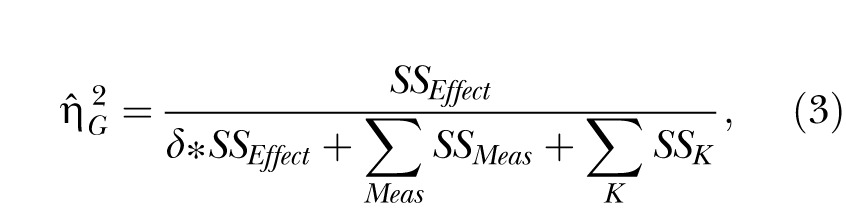 |
where SSEffect was the sum of squares associated with each effect, SSMeas includes all sources of error variance that involve measured variables (Group, Session, and Group x Session) and SSK includes all sources of error variance that include subjects or covariates (in this case, the individual differences). The parameter δ = 1 if the effect of interest is a manipulated factor, and is set to zero otherwise. For measurements of the effect size for the individual differences, SSEffect was the error sum of squares from the Group effect (this is the same as SSK). In this case, δ was set to zero so that the individual differences (SSK) only contributed to the denominator once.
As an additional index of the contribution of the individual differences to the experiment, an F-statistic was computed by dividing the mean square error for the Group effect (the interindividual error) by the mean square error for the Session effect (the intraindividual error). In all cases, the criterion for significance was p < .05 and only significant statistical tests are reported. Because the Session effect was not significant (due to running the analysis on data obtained after achieving stable performance), none of the statistics are reported for this factor.
Results
SS choice
Figure 1 displays the mean percentage of SS choices for each group and for the individual rats within a group. Overall, when the difference between the SS and LL delays was larger, the mean preference for the SS alternative was greater, as was the individual variation in choice behavior. Main effects of Group, F(3,20) = 4.21, and Individual differences, F(20,180) = 47.27, were detected. Tukey post-hoc tests revealed that Group 10/30 chose the SS alternative more than Group 15/30. The η2 computations, shown in Table 1, determined the percentage of variance accounted for by Individual differences and the other variables in the model (see Data Analysis). The Group factor accounted for 35% of the variance in SS choices, while Individual differences accounted for 55% of the total variance. The remaining 10% of variance was due to the contribution of Session, Session x Group, and the error associated with the Session effect. The  computations (also shown in Table 1) indicated a moderate effect size for the Group effect and a strong effect size for Individual differences.
Fig. 1.
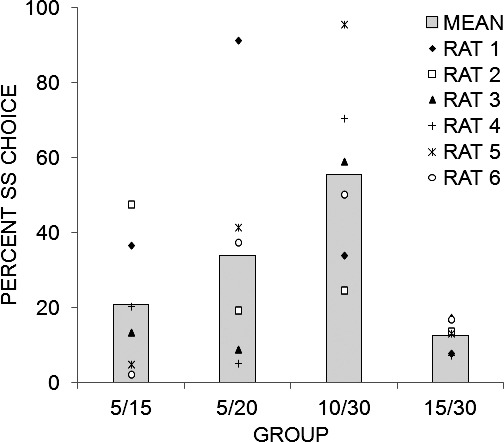
Mean (and individual rat) percentage of choices made to the SS lever for each of the four different groups of rats. Groups are labeled according to the SS and LL duration received during training in Experiment 1. Note that the rats within each group are different animals as this was a between-subjects design (e.g., Rat 1 in Group 5/15 is a different animal from Rat 1 in Group 5/20).
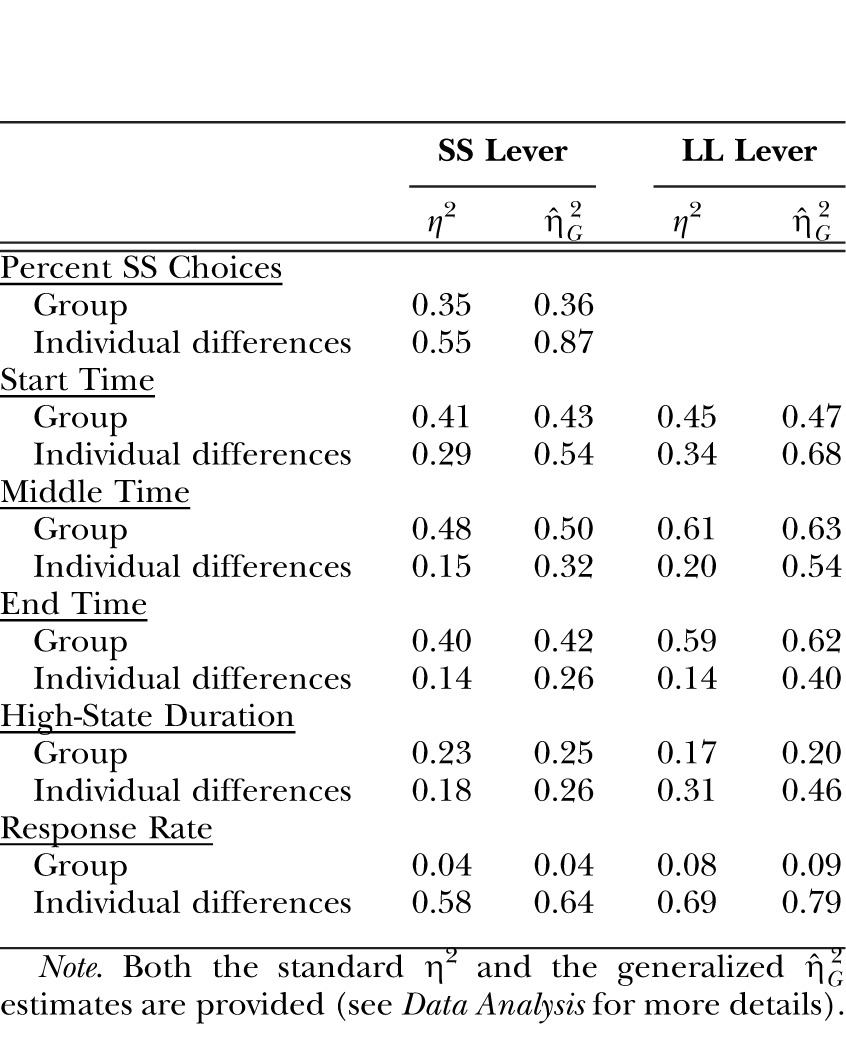
Table 1.
The effect size estimates for the Group factor and the Individual differences contributions to the dependent measures of Percent SS choices and the results of the low-high-low analysis (start, middle and end times, high-state duration, and response rate) in Experiment 1.
|
SS Lever |
LL Lever |
|||
|
η2 |

|
η2 |

|
|
| Percent SS Choices | ||||
| Group | 0.35 | 0.36 | ||
| Individual differences | 0.55 | 0.87 | ||
| Start Time | ||||
| Group | 0.41 | 0.43 | 0.45 | 0.47 |
| Individual differences | 0.29 | 0.54 | 0.34 | 0.68 |
| Middle Time | ||||
| Group | 0.48 | 0.50 | 0.61 | 0.63 |
| Individual differences | 0.15 | 0.32 | 0.20 | 0.54 |
| End Time | ||||
| Group | 0.40 | 0.42 | 0.59 | 0.62 |
| Individual differences | 0.14 | 0.26 | 0.14 | 0.40 |
| High-State Duration | ||||
| Group | 0.23 | 0.25 | 0.17 | 0.20 |
| Individual differences | 0.18 | 0.26 | 0.31 | 0.46 |
| Response Rate | ||||
| Group | 0.04 | 0.04 | 0.08 | 0.09 |
| Individual differences | 0.58 | 0.64 | 0.69 | 0.79 |
Note. Both the standard η2 and the generalized  estimates are provided (see Data Analysis for more details).
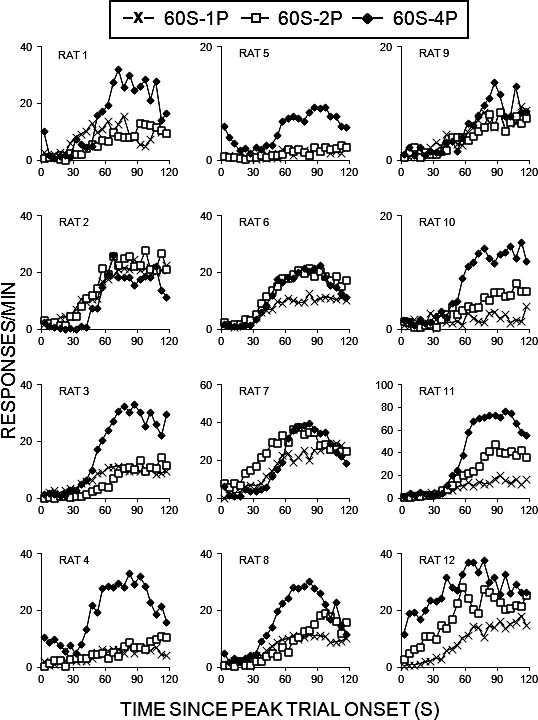
Response functions
The response rate functions for each rat within each group are displayed for the SS (left column) and LL (right column) peak trials in Figure 2. The time of reinforcement is marked with a vertical dashed line. In general, the individual functions peaked near the time of reinforcement on both SS and LL trials, but there were considerable individual differences in the peak rate of response and in the spread of the peak. In addition, some rats peaked well beyond the time of reinforcement (e.g., Rats 2 and 5 in Group 5/15 and Rat 3 in Group 15/30).
Fig. 2.
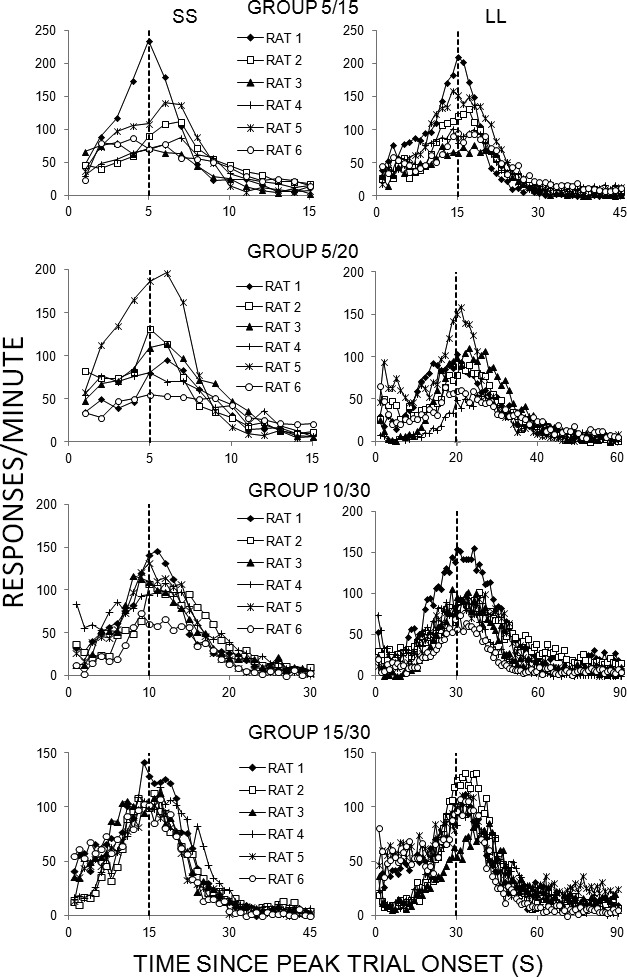
Responses/min as a function of time since peak trial onset (in seconds) on SS (left column) or LL (right column) trials for individual rats in each of the four groups in Experiment 1. The vertical axes have been scaled for each panel to enhance readability of the figures and avoid compression of data associated with lower response rates.
Low-high-low analysis
To conduct a more thorough analysis of the peak functions, the individual peak trials for each rat were subjected to a low-high-low algorithm (see Data Analysis), the results of which are shown in Figure 3. It appears that the timing measures (start time, middle time, end time, and high-state duration) on the SS and LL levers were affected by the Group manipulation. Specifically, the times were later and durations longer when the delay was longer. However, the high-state response rates were unaffected by delay. In addition, there were considerable individual differences in response rate and, to a lesser extent, in the timing measures.
Fig. 3.
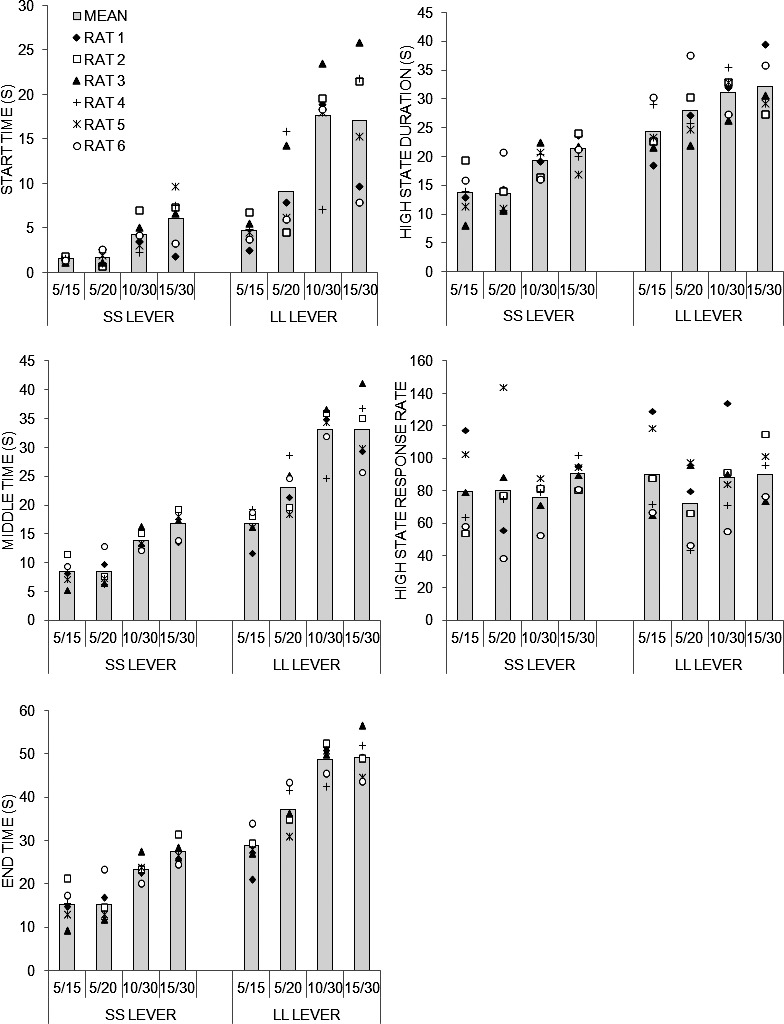
Low-high-low analysis results from the fixed-interval SS and LL peak trials in Experiment 1 for each of the four groups 5/15, 5/20, 10/30, and 15/30. Start time, middle time, end time, high-state duration, and response rate during the high state of responding as determined by a low-high-low algorithm (see Data Analysis). Each dot in the figure represents an individual rat in each group and the solid gray bars display the mean for each group.
Separate ANOVAs were conducted on the SS and LL peak trials. For the SS trials, ANOVAs on the start, middle, end times, high-state duration and response rate in the high response state revealed an effect of Group on the start, F(3,20) = 9.33, middle, F(3,20) = 21.27, end times, F(3,20) = 18.55, and high-state duration, F(3,20) = 8.53. There was an effect of Individual differences on the start, F(20,180) = 10.00, middle, F(20,180) = 4.36, end times, F(20,180) = 3.22, high-state duration, F(20,180) = 3.18, and high-state response rate, F(20,180) = 15.96. Tukey post-hoc tests on the Group main effect indicated that the start times in Group 15/30 were later than those in Groups 5/15 and 5/20; meanwhile the middle and end times were later and the high-state duration was greater in Groups 10/30 and 15/30 than in Groups 5/15 and 5/20. The two effect size estimates, η2 and  , for responding on the SS lever are shown in Table 1. It appears that Group exerted more influence over the timing measures, with moderate effect sizes, whereas the Individual differences had more impact on the response rate in the high state, with moderate-to-strong effect size estimates.
For the LL duration, there was an effect of Group on the start, F(3,20) = 8.78, middle, F(3,20) = 20.87, end times, F(3,20) = 27.82, and high-state duration, F(3,20) = 3.63. There was an effect of Individual differences on the start, F(20,180) = 19.21, middle, F(20,180) = 10.28, end times, F(20,180) = 5.91, high-state duration, F(20,180) = 7.81, and high-state response rate, F(20,180) = 33.98. Tukey post-hoc tests on the main effect of Group revealed that the start times in Group 10/30 were later than those in Groups 5/15 and 5/20 and in Group 15/30 later than those in Group 5/15; the middle times were later in Groups 15/30 and 10/30 than in Groups 5/15 and 5/20; the end times were later in Groups 15/30 and 10/30 than in Groups 5/15 and 5/20 and later in Group 5/20 than Group 5/15 and the high-state duration was greater in Group 15/30 than in Group 5/15. The effect size computations (Table 1) indicated a stronger effect of Group on the timing measures, and a stronger effect of the Individual differences on the response rate in the high state.
Correlations
Bivariate correlation coefficients were computed, collapsing across groups, to determine the relationship between the measures of timing and response rate from the low-high-low analyses with the percentage of SS choices made on free-choice trials. Separate correlations were conducted for the SS and LL peak trials. This revealed no significant correlation between any of the timing measures or the high state response rate and the percentage SS choice (largest r = .20). An additional correlation was conducted on relative timing and rate measures. These were constructed by dividing the start, middle, and end times, high-state duration, and high-state rate associated with the LL lever by the SS lever as an index of judgment of relative duration. Although the correlation coefficients were generally larger with the relative timing and rate measures (compared to the absolute measures), there still was no significant correlation with the percentage SS choice (largest r = −0.27).
Discussion
Experiment 1 examined the effect of SS and LL duration on choice, response rate, and timing. In all measures of behavior, there were substantial individual differences that sometimes outweighed the effect of the Group on performance. The largest individual differences were found in the percentage of SS choices (see Table 1), where the individual differences accounted for 55% of the variance (effect size,  = .87), and in the high-state response rate, where individual differences accounted for 58% of the variance in SS responding (
 = .64) and 69% of the variance in LL responding (
 = .79). However, the individual differences in response rate and choice were not significantly correlated, indicating that separate factors were most likely responsible for producing individual differences in these two measures. The individual differences in timing ranged from 14–29% on the SS peak trials and 14–34% on the LL peak trials with low to moderate effect size estimates in all measures. While some individuals exhibited poorer timing than others, most of the rats timed the delays accurately. As with the rate measure, there was no correlation between timing and choice behavior.
A lack of significant correlation between timing measures and percentage SS choice may be due to relatively low variability in timing performance between the rats. Most of the rats timed both schedules accurately and so the variance in timing performance may not have been sufficient to support a correlation with the relatively high level of individual variation in choice performance. Alternatively, the individual differences in timing may have been reduced because control over timing behavior was being exerted by the independent variable of SS/LL duration. On the other hand, the response rate was not under very strong control of the independent variable so this explanation would not apply to the weak correlations between response rate and choice behavior, where clear control was exerted by the SS/LL durations. This suggests that choice behavior may be inherently more variable than timing behavior, and may be determined by somewhat different factors than timing or response rate.
Individual differences in choice between SS and LL rewards may arise from many factors. Individual rats may possess response biases that are either related (e.g., prefer short duration, prefer large reward) or unrelated (e.g., prefer left lever, prefer lever farther away from the door) to the procedure. There also may be individual differences in sensitivity to reward amounts or incentive motivational processes that would affect choice behavior. For example, if an individual rat possessed low incentive motivation, then it would most likely prefer the SS reward. Individual differences in timing could be due to variations in internal clock, memory, or decision processes and individual differences in response rate most likely reflect differences in motivation or motor output capabilities.
One limitation of the current study is that the choice behavior was only assessed with one set of choice parameters for each group of rats, and as a result may have overestimated individual differences due to, for example, response biases. Experiment 2 assessed choice over a larger set of parameters.
EXPERIMENT 2
Experiment 2 examined individual differences in choice behavior in a delay discounting choice task adapted from Hackenberg and Hineline (1992). This task was designed to examine choice behavior in a more dynamic procedure that utilized a fixed LL delay versus an SS delay that was incremented between trials. The addition of peak trials delivered in a manner similar to Experiment 1 also allowed measurements of timing behavior (which was not examined in Hackenberg and Hineline's paper). The incremental SS delay procedure was designed to minimize response biases that may have contributed to the individual differences observed in Experiment 1. The magnitude of the LL reward was manipulated across phases of the experiment to determine if individual differences were maintained across phases. A second rationale for manipulating LL reward magnitude was related to the large variation in response rate observed in Experiment 1. If these individual differences were due to incentive motivational processes, manipulating reward magnitude should impact response rates and choice behavior.
Method
Subjects
The subjects were 12 male hooded Lister rats (Charles River, UK) approximately 12 weeks old and with a mean ad libitum weight of 345 g (range = 310–365 g). The housing and husbandry conditions were the same as in Experiment 1 except that all rats were kept on a reverse light-dark cycle.
Apparatus
The apparatus was the same as in Experiment 1.
Procedure
The experiment was conducted in overnight sessions lasting for approximately 14 hr that consisted of multiple trial blocks with breaks in between. All rats received one session of pretraining consisting of an introductory adaptation period of 30 min and then four training blocks with a 90-min break between blocks, delivered as in Experiment 1. In the first block, the rats received 40 single-pellet food deliveries on a variable time (VT) 180-s schedule. The second block consisted of four sub-blocks within which the rats received a one-pellet food delivery for each lever press (continuous reinforcement; CRF). Pressing of the left and right levers was trained independently in alternating blocks for a total of 15 food deliveries per sub-block; there was a 10-min interval between each sub-block. The remaining two blocks followed a similar structure; however, delivery of food followed a variable-ratio schedule with a mean of three and five lever presses per food delivery, respectively, and with 10 food deliveries per sub-block. The chambers were dark throughout the session; the onset of a block was cued by the insertion of a lever, and the end of a block by lever withdrawal.
Following pretraining, rats were trained on the incremental SS delay procedure. Sessions lasted until 220 food pellets had been delivered, or for a maximum of 14 hr, whichever occurred first. Each session was split into four blocks. There was an initial adaptation period of 30 min prior to the start of the first block and a 90-min interval between each block. Each block contained 22 choice trials and a maximum of two peak trials. The ITI was 120 s.
Each trial began with the insertion of both levers. The rat was allowed to make a choice by pressing one of the levers. This led to the withdrawal of the other lever and initiation of the FI schedule on the chosen lever. When the FI was completed, the lever was retracted, food was delivered, and the ITI was initiated. The incremental schedule (a progressive interval schedule) on the SS lever began at 0 s at the start of a block and incremented by 15 s between consecutive SS choices; the reward on the SS lever was a single food pellet. Pressing the LL lever initiated an FI 60 s schedule and reset the SS delay to 0 s. The reset of the SS delay was signaled by briefly inserting and withdrawing both levers at the beginning of the following choice trial. The allocation of the SS and LL schedules to the left and right levers was counterbalanced between rats and remained consistent for each rat throughout the experiment.
Nonreinforced peak trials were intermixed with choice trials. The peak trials occurred after the second and fourth choice of the LL lever in each block. On peak trials, the LL lever was inserted and responses were recorded for 180 s. The lever was then withdrawn and an ITI was initiated. There were no food deliveries during peak trials.
The incremental SS schedule with a single food pellet reward remained the same throughout the experiment, but the LL reward magnitude decreased over successive phases from four to two to one pellet(s), while the LL delay remained at 60 s (60S-4P, 60S-2P, 60S-1P). In all phases, the decision to progress to a new phase occurred when the mean choice performance of the group varied by less than 20% over three consecutive sessions. The three phases lasted 33, 31, and 32 sessions, respectively.
Data Analysis
The data analyses were conducted as in Experiment 1 except that the measure of choice behavior was the SS increment. The SS increment was the delay on the SS lever on the trial before the rat switched to the LL alternative and reset the SS delay to its initial value. The average of these SS increments was computed for each session.
ANOVAs were conducted with the within-subject variables of Phase (i.e., LL reward amount) and Session for each dependent variable. The estimates of effect size were conducted as in Experiment 1. The sum of squares for the individual differences, SSEffect, was determined by totaling the sum of squares for all of the factors and error terms in the ANOVA model and then subtracting this sum from the total adjusted sum of squares, SSTotal. The F values for the individual differences were computed by dividing the mean square error for the interindividual variance by the mean square error for the intraindividual variance (session error). Only significant effects (p < .05) are reported.
Results
SS increment
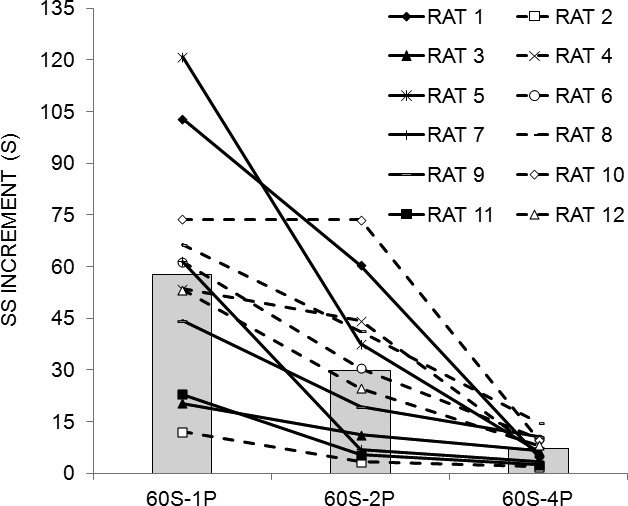
Figure 4 displays the SS increment (see Data Analysis) for each phase of the experiment for each of the 12 individual rats (lines), and the mean across all rats (bars). The SS increment increased with decreases in LL reward magnitude; that is, as fewer pellets were delivered following the completion of the FI 60-s schedule on the LL lever, rats chose the SS alternative on more consecutive trials before switching to the LL lever. Individual differences in choice behavior increased over phases, as the reward magnitude on the LL lever decreased. However, the relative position of each rat within the group did not change appreciably over the phases of the experiment for 10 of the 12 rats.
Fig. 4.
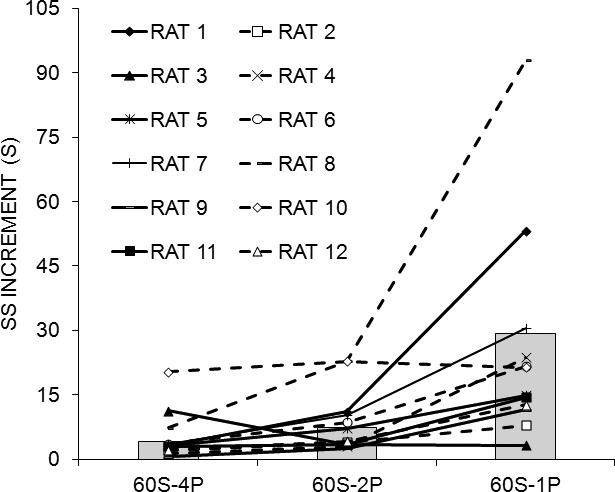
SS increment for individual rats (lines) and the group mean (bars) as a function of phase of Experiment 2: 60S-4P = 60 S LL fixed interval with a four-pellet reinforcer, 60S-2P = 60 S LL fixed interval with a two-pellet reinforcer, 60S-1P = 60 S LL fixed interval with a one-pellet reinforcer.
An ANOVA conducted on the mean SS increment over the last 10 sessions of each phase revealed an effect of Phase, F(2,22) = 8.10, and Individual differences, F(11,99) = 43.29. Tukey post-hoc tests on the Phase effect revealed that the rats incremented the SS farther in the 60S-1P phase than in the 60S-4P phase. The effect size estimates, shown in Table 2, indicated that Individual differences had a stronger effect on SS increment than did the manipulated factor of Phase.
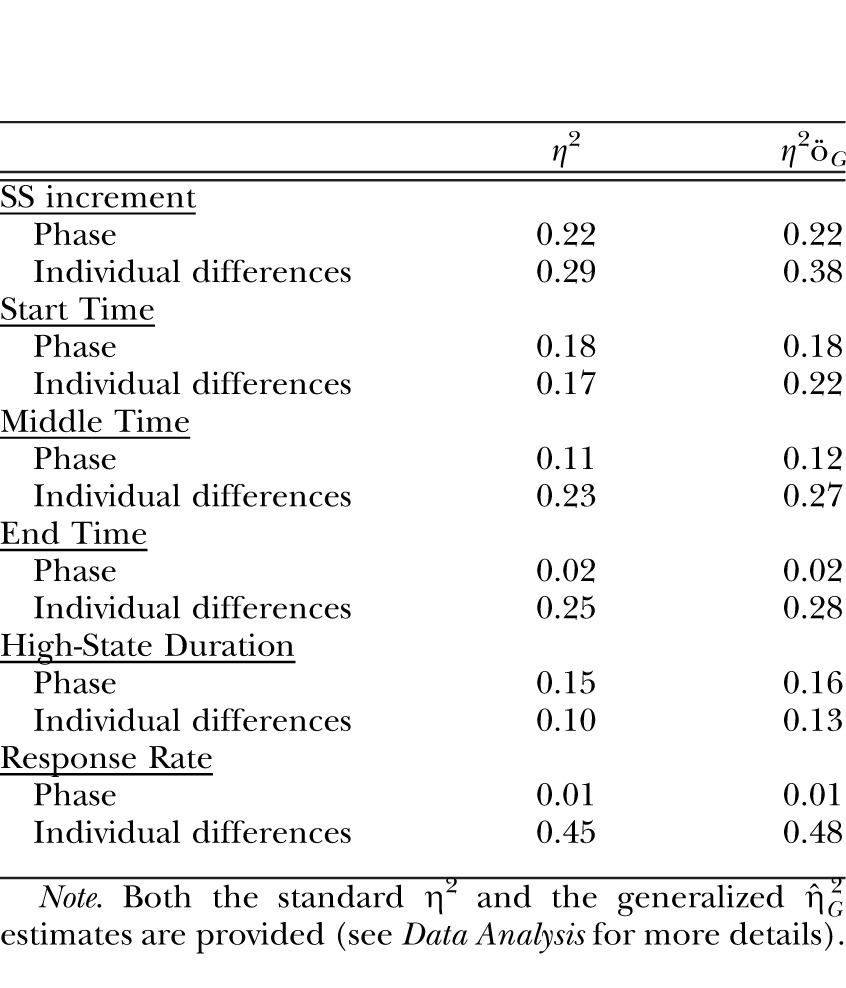
Table 2.
The effect size estimates for the Group factor and the Individual differences contributions to the dependent measures of SS increment and the results of the low-high-low analysis (start, middle and end times, high-state duration, and response rate) in Experiment 2.
|
η2 |
η2öG |
|
| SS increment | ||
| Phase | 0.22 | 0.22 |
| Individual differences | 0.29 | 0.38 |
| Start Time | ||
| Phase | 0.18 | 0.18 |
| Individual differences | 0.17 | 0.22 |
| Middle Time | ||
| Phase | 0.11 | 0.12 |
| Individual differences | 0.23 | 0.27 |
| End Time | ||
| Phase | 0.02 | 0.02 |
| Individual differences | 0.25 | 0.28 |
| High-State Duration | ||
| Phase | 0.15 | 0.16 |
| Individual differences | 0.10 | 0.13 |
| Response Rate | ||
| Phase | 0.01 | 0.01 |
| Individual differences | 0.45 | 0.48 |
Note. Both the standard η2 and the generalized  estimates are provided (see Data Analysis for more details).
Response rate functions
Figure 5 displays the response rate functions (in responses/min) from peak trials on the LL lever for each individual rat for each of the three phases of the experiment. In general, the rats displayed peaks near or shortly after the expected time of reinforcement (60 s). Some rats (see especially Rats 3, 7, and 10) peaked well beyond 60 s in at least one of the phases. In addition, the response rate functions were more concentrated around the expected time of reinforcement when the reward magnitude was four pellets compared to two or one pellet(s).
Fig. 5.
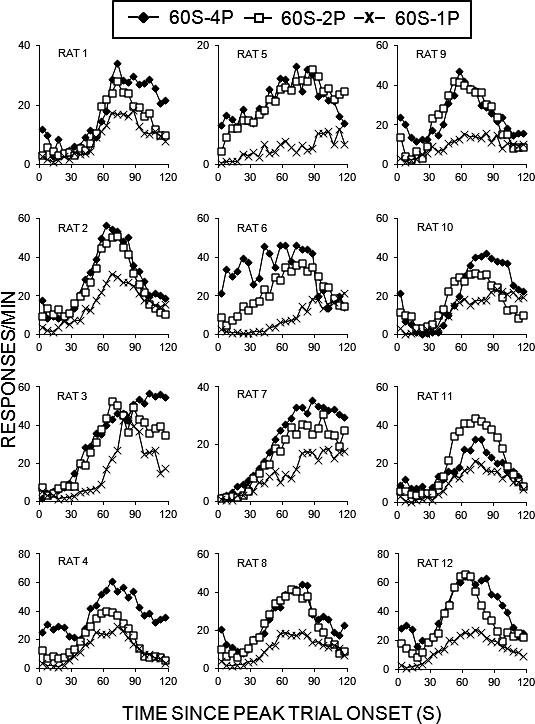
Responses/min as a function of time since peak trial onset (in seconds) for individual rats in Experiment 2. The vertical axes have been scaled for each panel to enhance readability of the figures and avoid compression of data associated with lower response rates.
Low-high-low analysis
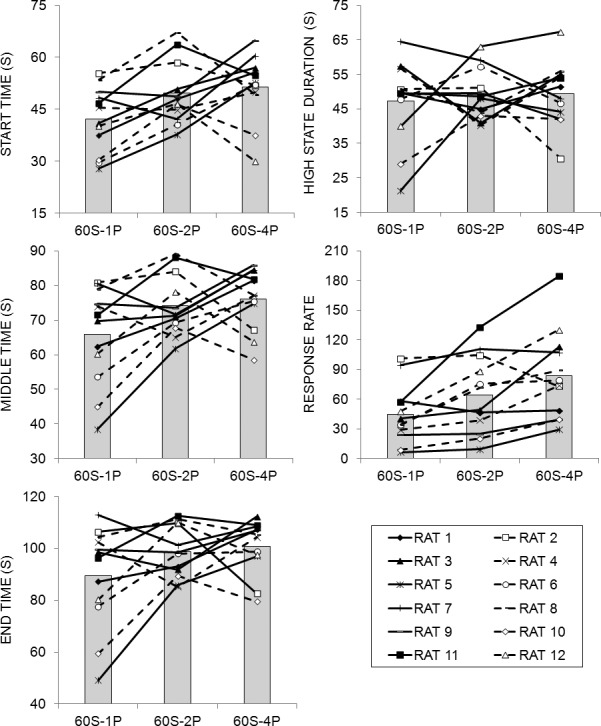
A low-high-low analysis was conducted to quantify the descriptive aspects of the peak functions on LL trials. The results of this analysis are displayed in Figure 6, which shows the start, middle, and end times, duration of the high state, and response rate in the high state as a function of phase for individual rats (lines) and the mean of the group (bars). Start and middle times generally increased and the high-state duration decreased as the reward magnitude on the LL lever decreased. There were considerable individual differences in performance, but the extent of individual differences did not appear to change over phases. The greatest individual differences appeared to occur in the measure of high-state response rate.
Fig. 6.
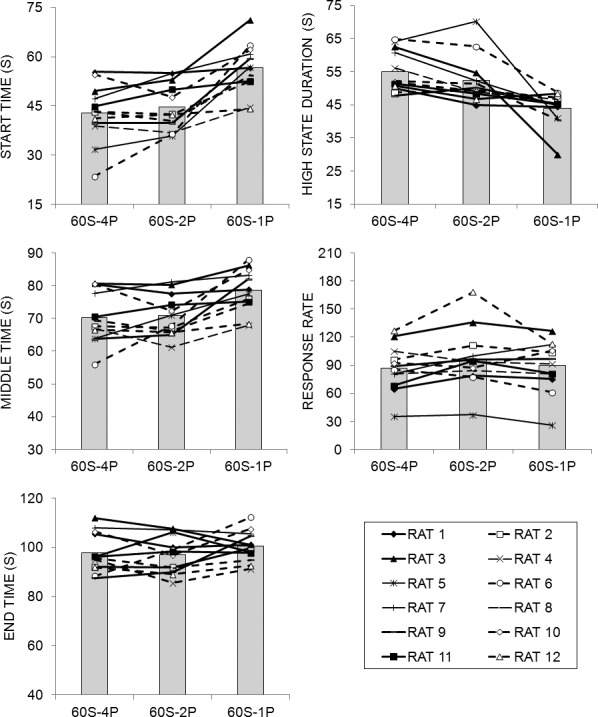
Low-high-low analysis results from the fixed-interval peak trials in Experiment 2. Start time, middle time, end time, high-state duration, and response rate during the high state of responding as determined by a low-high-low algorithm (see Data Analysis). Each line in the figure is the function for an individual rat and the bars indicate the mean of the 12 rats.
Separate ANOVAs on each of the dependent measures over the last 10 sessions of each phase revealed an effect of Phase on start time, F(2,22) = 18.28, middle time, F(2,22) = 10.01, and high-state duration, F(2,22) = 12.14. There was a significant effect of Individual differences on start time F(11,99) = 11.78, middle time, F(11,99) = 14.30, end time, F(11,99) = 17.14, high-state duration, F(11,99) = 6.12, and high-state response rate, F(11,99) = 29.10. Tukey post-hoc tests on the Phase effect revealed that the start and middle times were later in the 60S-1P phase than the 60S-2P and 60S-4P phases; and the high-state duration was greater in the 60S-2P and 60S-4P phases than the 60S-1P pellet phase. The effect size estimates (Table 2) indicated that both Phase and Individual differences had only weak effects on the timing measures. Phase also had a weak effect on response rate, but the Individual differences exhibited a moderate effect on response rates.
SS increment-timing correlations
Mean start, middle and end times, high-state duration and high-state response rate were correlated against SS increment within each phase. A positive correlation (with alpha adjusted for multiple assessments) was found between SS increment and middle times, r = .58 and SS increment and end times, r = .60 in the 60S-4P phase. There were no significant correlations present in the 60S-1P and 60S-2P phases.
Discussion
In examining the SS increment (Figure 4), the rats were sensitive to the decrease in reward magnitude on the LL lever, displaying larger SS increment times (indicating more persistence on the SS lever) as LL reward decreased. The rats displayed a general preference for the LL lever throughout the study that resulted in less than optimal behavior. If the rats had engaged in momentary maximizing, the SS increment should have been 15 s, 30 s, and 60 s in the 60S-4P, 60S-2P and 60S-1P phases, respectively. This may be due to a bias for that lever as a result of the initial receipt of four pellets on the LL side.
Individual differences in the likelihood of choosing the SS alternative accounted for a moderate percentage of the variance (29%), and contributed more variance than the independent variable of reward magnitude (22%). Individual differences were greatest when the LL reward was one pellet. The observation that individual differences continued to contribute a significant percentage of the variance over the course of multiple phases with different choice options indicates that individual variability was maintained over the experiment. The significant effect of the individual differences on the choice and timing measures indicates that the individual rats within the group remained relatively stable over phases even though the behavior of the rats as a group changed in response to the between-phase reward magnitude manipulation. This finding lends support to the possibility that individual differences in impulsive choice behavior may constitute a trait variable.
While the results of Experiment 2 are consistent with stable individual differences, only moderate effect size estimates in choice behavior were observed in Experiment 2 ( = .38) compared to the large effect size observed Experiment 1 (
 = .87). This may have been due to a reduction in idiosyncratic biases for one lever over another, as was the intent in administering the incremental SS delay procedure in Experiment 2.
The response rate functions (Figure 5) indicated that the rats were tracking the time of reinforcement on LL trials and their pattern of responding on peak trials appeared to be affected by the reward magnitude manipulation; that is, as reward amount decreased, responding was initiated later and the time spent in the high state was lower (Galtress & Kirkpatrick, 2009).
As in Experiment 1, there was greater individual variation in high-state response rate (45%) than in any of the timing measures (10–25%). In this study, the middle and end times were positively correlated with SS increment time, but only in the 60S-4P phase. Later middle and end times might be indicative of poorer precision in timing the LL duration. If so, then rats that perceived the time to the LL reward with poorer precision may have persisted in choosing the SS option due to their poor learning of the LL delay. This suggests that timing and choice behaviors may be resulting from some shared factors in the present procedure. The lack of significant correlations in subsequent phases may have been due to between-phase contrast effects on timing and/or choice behavior that reduced the strength of the correlations.
As reward magnitude decreased, start and middle times occurred later and high-state durations were shorter. Reward magnitude effects on timing have been reported previously in both pigeons (Ludvig, Balci, & Spetch, 2011) and rats (Blomeley, Lowe, & Wearden, 2004; Galtress & Kirkpatrick, 2009, 2010a; Ludvig, Conover, & Shizgal, 2007). Galtress and Kirkpatrick (2009, 2010a) suggested this effect is due to alterations in attention to time. Whether the effect of attention on timing produces any impact on choice behavior is difficult to determine with the present data set, so this remains an open question for further study.
EXPERIMENT 3
Experiment 3 conducted further tests with the incremental SS delay procedure, but in this study the reward magnitude on the LL lever started at one pellet and increased to two and then to four pellets. In Experiment 2, the rats did not maximize reinforcement, and this may have been due to the initial presentation of the four-pellet reward on the LL lever. The main goal of the reverse manipulation was to determine whether beginning with a neutral baseline condition would lead to momentary maximizing of choice behavior, and whether that would have any implications for the contribution of individual differences.
Method
Subjects
The animals were 12 male hooded Lister rats (Charles River, UK) approximately 12 weeks old at the start of the experiment and with a mean ad libitum weight of 315 g (range = 300–325 g). Other aspects of housing and husbandry were the same as in Experiment 2.
Apparatus
The apparatus was identical to that in Experiments 1 and 2.
Procedure
All rats were given magazine and instrumental lever training prior to the implementation of the incremental SS delay procedure in a manner identical to Experiment 2.
The incremental SS delay procedure was the same as in Experiment 2, except that the LL reward increased from one to two to four pellet(s) across phases. The 60S-1P, 60S-2P, and 60S-4P phases lasted for 20, 18, and 25 sessions, respectively.
Data Analysis
The data analysis was performed using the same methods as in Experiment 2.
Results
SS increment
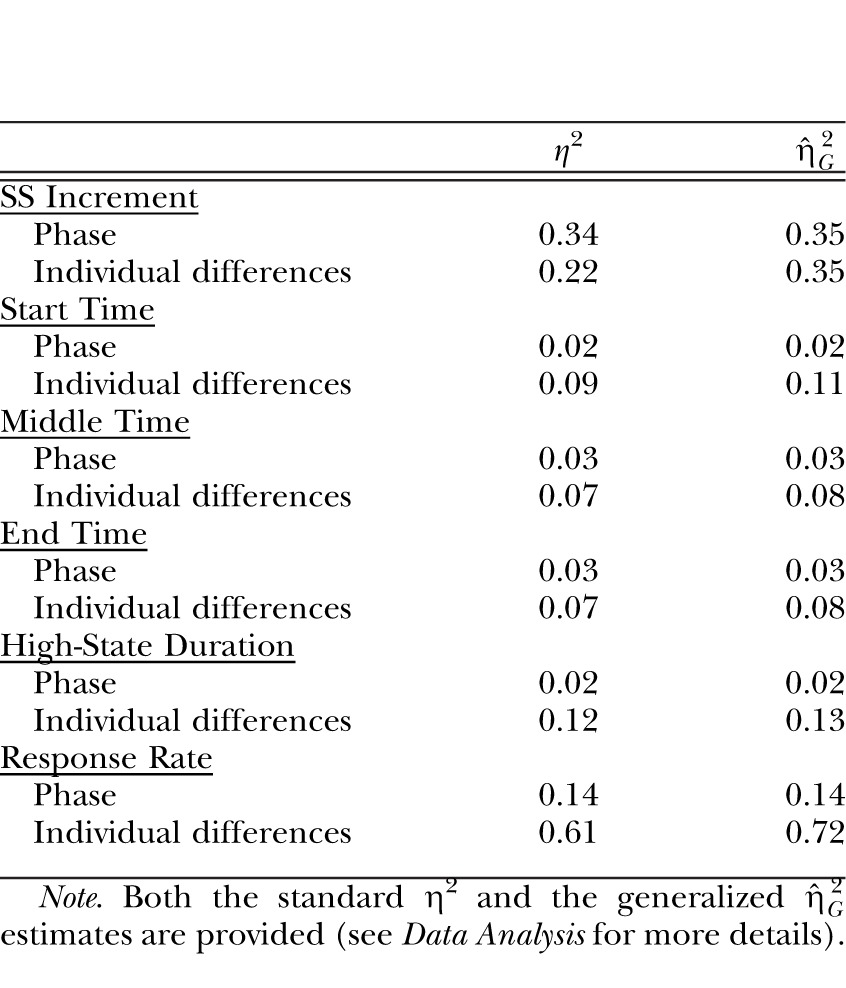
The SS increment is displayed in Figure 7 as a function of phase for the individual rats (lines) and also for the group (bars). The rats incremented the SS delay to the greatest degree when the reward on the LL lever was one pellet and this decreased as the reward increased on the LL lever. Individual differences in the SS increment decreased as the magnitude of reward on the LL lever increased and the relative rank position of each rat within the group remained relatively stable over phases. An ANOVA conducted on the mean SS increment revealed an effect of Phase, F(2,22) = 23.62, and Individual differences, F(11,99) = 22.76. Tukey post-hoc tests revealed that the rats incremented the SS interval to a greater degree in the 60S-1P phase than the 60S-2P phase and in both of these phases compared to the 60S-4P phase. The effect size estimates, displayed in Table 3, indicated that the individual differences accounted for 22% of the variance in SS increment, whereas Phase accounted for 34% of the variance in SS increment, and both variables had a moderate effect size, measured by  .
.
Fig. 7.
SS increment duration for individual rats (lines) and for the group (bars) as a function of phase in Experiment 3: 60S-1P = 60 S LL duration with a one-pellet reward, 60S-2P = 60 S LL duration with a two-pellet reward, 60S-4P = 60 S LL duration with a four-pellet reward.
Table 3.
The effect size estimates for the Group factor and the Individual differences contributions to the dependent measures of SS increment and the results of the low-high-low analysis (start, middle and end times, high-state duration, and response rate) in Experiment 3.
|
η2 |

|
|
| SS Increment | ||
| Phase | 0.34 | 0.35 |
| Individual differences | 0.22 | 0.35 |
| Start Time | ||
| Phase | 0.02 | 0.02 |
| Individual differences | 0.09 | 0.11 |
| Middle Time | ||
| Phase | 0.03 | 0.03 |
| Individual differences | 0.07 | 0.08 |
| End Time | ||
| Phase | 0.03 | 0.03 |
| Individual differences | 0.07 | 0.08 |
| High-State Duration | ||
| Phase | 0.02 | 0.02 |
| Individual differences | 0.12 | 0.13 |
| Response Rate | ||
| Phase | 0.14 | 0.14 |
| Individual differences | 0.61 | 0.72 |
Note. Both the standard η2 and the generalized  estimates are provided (see Data Analysis for more details).
Response rate functions
The response rate functions on LL peak trials for individual rats as a function of phase are displayed in Figure 8. The peak rates increased as a function of the number of pellets on the LL lever, and the peaks became more well-defined. Most of the rats displayed peak rates after 60 s.
Fig. 8.
Responses/min as a function of time since peak trial onset (in seconds) for individual rats in Experiment 3. The vertical axes have been scaled for each panel to enhance readability of the figures and avoid compression of data associated with lower response rates.
Low-high-low analysis
The results from the low-high-low algorithm are displayed in Figure 9. The high-state response rate increased slightly as a function of increasing LL reward magnitude, but there were no other systematic differences in performance across phases. There were considerable individual differences in all measures in all phases. Separate ANOVAs on the start, middle, end times, high-state duration and response rate in the high state revealed an effect of Phase, F(2,22) = 10.48, on high-state response rate. Tukey post-hoc tests indicated that the rats produced a higher response rate in the 60S-4P phase than the 60S-1P phase. There was no effect of Phase on any of the other measures. There was a significant effect of Individual differences on start time F(11,99) = 3.64, middle time, F(11,99) = 3.09, end time, F(11,99) = 2.96, high-state duration, F(11,99) = 2.95, and high-state response rate, F(11,99) = 165.28. The effect size estimates (Table 3) indicated a weak effect of Phase on all of the measures of responding, a weak effect of Individual differences on the timing measures, and a moderate to strong effect of Individual differences on response rate.
Fig. 9.
Low-high-low analysis results from the fixed-interval peak trials in Experiment 3. Start time, middle time, end time, high-state duration, and response rate during the high state of responding as determined by a low-high-low algorithm (see Data Analysis). Each line in the figure is the function for an individual rat and the bars are the means across rats.
SS increment-timing correlations
A negative correlation (with alpha values corrected for multiple comparisons) was found between SS increment and end times in the 60S-1P phase (r = -.56) and SS increment and high-state response rate in the 60S-2P phase (r = -.66); no other correlations were significant.
Discussion
The reversed direction of the incremental SS delay procedure resulted in SS increments that were close to momentary maximizing of reinforcement. And, as a result, there was a stronger effect of Phase on the SS increment compared to Experiment 2. Although the reinforcer magnitude exerted more control over choice behavior in Experiment 3 compared to Experiment 2, the individual differences still contributed significantly to the overall variance with a moderate effect size estimate (see Tables 2 and 3) and the rank order positions of the rats remained relatively stable across phases. As in Experiment 2, the individual differences were greater when the two rewards were the same magnitude (60S-1P).
The timing measure of end time was correlated negatively with the SS increment, but only in the first phase in which the LL reward was one pellet. However, in Experiment 2, the correlation was positive in the first phase when four pellets were delivered on the LL lever. Given that reward magnitude has been shown to affect timing (Galtress & Kirkpatrick, 2009), it is possible that the different correlation patterns may have been due to a complex interaction of reward magnitude, anticipatory timing, and choice behavior. Reward magnitude has two main effects on timing behavior: (1) higher magnitudes result in sharper peak functions (Galtress & Kirkpatrick, 2009; see also Figures 5 and 8); and (2) changes in reward magnitude can result in shifts in the location of the peak with increases in magnitude shifting the peak to the left and decreases shifting the peak to the right (Galtress & Kirkpatrick, 2009, 2010a; Ludvig, et al., 2011; Ludvig, et al., 2007). Only the initial phase resulted in significant correlations in both experiments. The correlations in the subsequent phases were generally trending in the same direction as the initial phase, but were weakened. The weakening of the correlations with changes in reward magnitude may be due to the reward contrast-timing interactions. An interaction of reward magnitude with timing would add variance to the timing functions, and would also potentially produce additional effects on choice behavior above and beyond the effect of magnitude alone (e.g., reward magnitude increases could subjectively shorten the LL delay, thereby increasing LL choices to a greater degree than the effect of magnitude alone). These interaction effects would presumably reduce the bivariate correlations between timing measures and choice behavior by adding noise to the timing–choice relationship.
The different pattern of correlations in the initial phase with either a four-pellet (Experiment 2) or one-pellet (Experiment 3) reward is more challenging to explain. Earlier end times would be indicative of sharper functions, which should reflect more precise timing. There is no clear precedent in the literature for explaining these correlation patterns, so one can only speculate as to possible mechanisms at this stage. More precise timing may indicate superior learning of the LL option. When the LL magnitude is larger, more precise timing of the LL should lead to shorter SS increments (i.e., a preference for the LL) as was observed in Experiment 2. However, more precise timing of the one-pellet magnitude LL led to greater preference for the SS option in Experiment 3 when both reward magnitudes were equal. Perhaps more precise timing in this case led to amplified delay aversion due to the equal reward magnitudes, which may have enhanced the preference for the SS delay. As a general principle, this possible explanation suggests that if an individual has fairly precise knowledge of the 60-s LL delay and the LL magnitude is large, then they would prefer the LL option, but if the LL magnitude is equal to the SS magnitude, then they should prefer the shorter SS. It is clear that further research will be needed to determine the underlying source of the effects of absolute magnitude on timing and choice behavior and timing–choice correlations, but timing and magnitude do appear to be exerting complex effects on choice behavior in this case.
The analysis of the peak trials again disclosed high individual differences in high-state response rate (η2 = 61% and  = .72). However, the timing measures only revealed a 7%-12% contribution of the individual differences with generally weak effect size estimates (largest
  = .13). This pattern is consistent with the two previous studies, and indicates a much smaller contribution of individual differences to timing than to choice or response rate measures. There was no effect of reward magnitude increase on LL timing in the present study. The only effect observed was on the high-state response rate. Increasing reward magnitude has been previously reported to alter timing in a peak procedure (Galtress & Kirkpatrick, 2009). Further study is required to determine the conditions under which the contrast effects of reward magnitude have an impact on timing.
GENERAL DISCUSSION
The present series of studies examined individual differences in choice, timing, and response rate in two different temporal discounting choice procedures. In Experiment 1, there were substantial individual differences in choice performance, accounting for 55% of the total variance in the experiment. The examination of choice behavior using the incremental SS delay procedure resulted in reduced contribution of individual differences to performance, with the interindividual variation accounting for 29% and 22% of the total variance in Experiments 2 and 3, respectively. There are a number of possible reasons for the reduced estimate of individual differences in the incremental SS delay procedure. One possibility is that this procedure may more effectively reduce response biases than typical SSLL choice procedures which rely on forced choice trials to reduce biases. The incremental nature of the SS lever produced a situation in which persisting on that lever was not advantageous due to the increasing delay to reward. This lever only yielded a single food pellet, so the SS increment would be 60 s, 30 s, or 15 s when the LL lever reward was equal to one, two, or four pellets to achieve momentary maximizing. In Experiment 3, the mean SS increment was close to the point of momentary maximizing of reward earning. In the incremental SS delay procedure, switching to the LL lever should occur at the SS delay at which the reward amount earned per second of trial time is equal to that of the LL schedule for momentary maximizing of reinforcement. However, once the LL lever is chosen, the SS increment returns to 0 s, making the SS lever the better alternative again, at least for the initial trial(s) following LL choice. The dynamics of the procedure encourage sampling of both levers and therefore should reduce biases without the need for forced choice trials that expose the rats to the reward schedules outside of the choice paradigm. The incremental SS delay procedure, therefore, appears preferable to the simpler SSLL choice procedure employed in Experiment 1, if the goal is reducing individual differences. The incremental SS delay procedure can employ alterations in both the LL reward magnitude and the LL delay over the course of phases to determine sensitivity to magnitude and delay (Galtress & Kirkpatrick, 2010b).
Although the incremental SS delay procedure reduced individual differences, there was still a significant contribution to the overall variance in choice behavior. This indicates that individual differences are substantial and should be subjected to further analysis. In addition, the individual differences remained consistent across three different sets of choice parameters. This suggests that the individual differences in choice behavior may be a trait of the rat. Impulsive choice behavior has already been shown to qualify for consideration as a trait in human participants (Jimura, et al., 2011; Kirby, 2009; Odum, 2011b; Odum & Baumann, 2010; Simpson & Vuchinich, 2000). The present results suggest that the rat could serve as a preclinical model for assessing sources of individual differences that may apply to humans.
The underlying causes of individual differences still remain to be determined. In addition to response biases that are unrelated to choice, such as lever preference, that have been already discussed, there may be individual differences in temporal processing, reward processing, integration of time and reward information, and also other factors such as memory processes and incentive motivation to obtain rewards. The current study attempted to determine whether aspects of timing of the interval duration were related to choice behavior, but there was no clear pattern in the correlations. This may be due to weak involvement of timing in impulsive choice, but more likely reflects complexities in the task demands. It may be preferable to assess timing outside of the discounting task (particularly in the absence of differential magnitudes of reinforcement) as timing within the task may be affected by the choices themselves, by the anticipated reward magnitude, or by reward magnitude contrast effects. Further research should explore these and other possible factors as a means of identifying the mechanisms that underlie individual differences in impulsive choice behavior.
In summary, the present set of studies indicated substantial individual differences in a normal rat population in two different choice paradigms. The individual differences persisted across different choice situations conducted over many sessions of training, indicating stability in individual differences. This suggests that the rat preclinical model could potentially be used to assess the underlying factors (both neural and psychological) that may be involved in producing individual differences in impulsive choice. Given the importance of impulsive choice as a metric for impulsivity (particularly in ADHD), and a potential predictor for drug use, gambling, and a general poor style of decision-making, understanding the factors that underlie individual differences should be a major goal for advancing the field.
Acknowledgments
The authors would like to thank Angela Crumer for her help with data analysis and Richard Wood and Stuart Morley for technical support and animal care.
Footnotes
The results presented in this article formed part of a PhD dissertation completed by Tiffany Galtress at the University of York, UK.
This research was supported by a grant from the Biotechnology and Biological Sciences Research Foundation to the University of York (Grant number BB/E008224/1).
REFERENCES
- Ainslie G. Specious reward: a behavioral theory of impulsiveness and impulse control. Psychological Bulletin. 1975;82:463–496. doi: 10.1037/h0076860. [DOI] [PubMed] [Google Scholar]
- Anderson K. G, Diller J. W. Effects of acute and repeated nicotine administration on delay discounting in Lewis and Fischer 344 rats. Behavioural Pharmacology. 2010;21(8):754–764. doi: 10.1097/FBP.0b013e328340a050. [DOI] [PMC free article] [PubMed] [Google Scholar]
- Angeletos G.-M, Laibson D, Repetto A, Tobacman J, Weinberg S. The hyperbolic consumption model: Calibration, simulation, and empirical evaluation. Journal of Economic Perspectives. 2001;15(3):47–68. [Google Scholar]
- Bakeman R. Recommended effect size statistics for repeated measures designs. Behavior Research Methods. 2005;37(3):379–384. doi: 10.3758/bf03192707. [DOI] [PubMed] [Google Scholar]
- Baker F, Johnson M. W, Bickel W. K. Delay discounting in current and never-before cigarette smokers: Similarities and differences across commodity, sign, and magnitude. Journal of Abnormal Psychology. 2003;112(3):382–392. doi: 10.1037/0021-843x.112.3.382. [DOI] [PubMed] [Google Scholar]
- Barkley R. A, Edwards G, Laneri M, Fletcher K, Metevia L. Executive functioning, temporal discounting, and sense of time in adolescents with attention deficit hyperactivity disorder (ADHD) and oppositional defiant disorder (ODD) Journal of Abnormal Child Psychology. 2001;29:541–556. doi: 10.1023/a:1012233310098. [DOI] [PubMed] [Google Scholar]
- Bickel W. K, Odum A. L, Madden G. J. Impulsivity and cigarette smoking: Delay discounting in current, never, and ex-smokers. Psychopharmacology (Berlin) 1999;146:447–454. doi: 10.1007/pl00005490. [DOI] [PubMed] [Google Scholar]
- Blomeley F. J, Lowe C. F, Wearden J. H. Reinforcer concentration effects on a fixed-interval schedule. Behavioural Processes. 2004;67:55–66. doi: 10.1016/j.beproc.2004.02.005. [DOI] [PubMed] [Google Scholar]
- Bobova L, Finn P. R, Rickert M. E, Lucas J. Disinhibitory psychopathology and delay discounting in alcohol dependence: Personality and cognitive correlates. Experimental and Clinical Psychopharmacology. 2009;17(1):51–61. doi: 10.1037/a0014503. [DOI] [PMC free article] [PubMed] [Google Scholar]
- Church R. M, Meck W. H, Gibbon J. Application of scalar timing theory to individual trials. Journal of Experimental Psychology: Animal Behavior Processes. 1994;20(2):135–155. doi: 10.1037//0097-7403.20.2.135. [DOI] [PubMed] [Google Scholar]
- Coffey S. F, Gudleski G. D, Saladin M. E, Brady K. T. Impulsivity and rapid discounting of delayed hypothetical rewards in cocaine-dependent individuals. Experimental and Clinical Psychopharmacology. 2003;11(1):18–25. doi: 10.1037//1064-1297.11.1.18. [DOI] [PubMed] [Google Scholar]
- Dixon M. R, Jacobs E. A, Sanders S. Contextual control of delay discounting by pathological gamblers. Journal of Applied Behavior Analysis. 2006;39(4):413–422. doi: 10.1901/jaba.2006.173-05. [DOI] [PMC free article] [PubMed] [Google Scholar]
- Dixon M. R, Marley J, Jacobs E. A. Delay discounting by pathological gamblers. Journal of Applied Behavior Analysis. 2003;36(4):449–458. doi: 10.1901/jaba.2003.36-449. [DOI] [PMC free article] [PubMed] [Google Scholar]
- Galtress T, Kirkpatrick K. Reward value effects on timing in the peak procedure. Learning and Motivation. 2009;40:109–131. doi: 10.1016/j.lmot.2010.01.002. doi: 10.1016/j.lmot.2008.05.004. [DOI] [PMC free article] [PubMed] [Google Scholar]
- Galtress T, Kirkpatrick K. Reward magnitude effects on temporal discrimination. Learning and Motivation. 2010a;41(2):108–124. doi: 10.1016/j.lmot.2010.01.002. [DOI] [PMC free article] [PubMed] [Google Scholar]
- Galtress T, Kirkpatrick K. The role of the nucleus accumbens core in impulsive choice, timing, and reward processing. Behavioral Neuroscience. 2010b;124(1):26–43. doi: 10.1037/a0018464. [DOI] [PMC free article] [PubMed] [Google Scholar]
- Green L, Estle S. J. Preference reversals with food and water reinforcers in rats. Journal of the Experimental Analysis of Behavior. 2003;79(2):233–242. doi: 10.1901/jeab.2003.79-233. [DOI] [PMC free article] [PubMed] [Google Scholar]
- Green L, Myerson J, Ostaszewski P. Amount of reward has opposite effects on the discounting of delayed and probabilistic outcomes. Journal of Experimental Psychology: Learning, Memory, and Cognition. 1999a;25(2):418–427. doi: 10.1037//0278-7393.25.2.418. [DOI] [PubMed] [Google Scholar]
- Green L, Myerson J, Ostaszewski P. Discounting of delayed rewards across the lifespan: Age differences in individual discounting functions. Behavioural Processes. 1999b;46:89–96. doi: 10.1016/S0376-6357(99)00021-2. [DOI] [PubMed] [Google Scholar]
- Hackenberg T. D, Hineline P. N. Choice in situations of time-based diminishing returns: Immediate versus delayed consequences of action. Journal of the Experimental Analysis of Behavior. 1992;57(1):67–80. doi: 10.1901/jeab.1992.57-67. [DOI] [PMC free article] [PubMed] [Google Scholar]
- Harzem P. Experimental analysis of individual differences and personality. Journal of the Experimental Analysis of Behavior. 1984;42(3):385–395. doi: 10.1901/jeab.1984.42-385. [DOI] [PMC free article] [PubMed] [Google Scholar]
- Ito M, Asaki K. Choice behavior of rats in a concurrent chains schedule: Amount and delay of reinforcement. Journal of the Experimental Analysis of Behavior. 1982;37:383–392. doi: 10.1901/jeab.1982.37-383. [DOI] [PMC free article] [PubMed] [Google Scholar]
- Jimura K, Myerson J, Hilgard J, Keighley J, Braver T. S, Green L. Domain independence and stability in young and older adults' discounting of delayed rewards. Behavioural Processes. 2011;87:253–259. doi: 10.1016/j.beproc.2011.04.006. [DOI] [PMC free article] [PubMed] [Google Scholar]
- Johnson M. W, Bickel W. K. Within-subject comparison of real and hypothetical money rewards in delay discounting. Journal of the Experimental Analysis of Behavior. 2002;77(2):129–146. doi: 10.1901/jeab.2002.77-129. [DOI] [PMC free article] [PubMed] [Google Scholar]
- Kirby K. N. One-year temporal stability of delay-discount rates. Psychonomic Bulletin & Review. 2009;16(3):457–462. doi: 10.3758/PBR.16.3.457. [DOI] [PubMed] [Google Scholar]
- Kirby K. N, Petry N. M. Heroin and cocaine abusers have higher discount rates for delayed rewards than alcoholics or non-drug-using controls. Addiction. 2004;99:461–471. doi: 10.1111/j.1360-0443.2003.00669.x. [DOI] [PubMed] [Google Scholar]
- Kirby K. N, Petry N. M, Bickel W. K. Heroin addicts have higher discount rates for delayed rewards than non-drug-using controls. Journal of Experimental Psychology: General. 1999;128(1):78–87. doi: 10.1037//0096-3445.128.1.78. [DOI] [PubMed] [Google Scholar]
- Kobayashi S, Schultz W. Influence of reward delays on responses of dopamine neurons. The Journal of Neuroscience. 2008;28(31):7837–7846. doi: 10.1523/JNEUROSCI.1600-08.2008. [DOI] [PMC free article] [PubMed] [Google Scholar]
- Krishnan-Sarin S, Reynolds B, Duhig A. M, Smith A, Liss T, McFetridge A, …Potenza N.M. Behavioral impulsivity predicts treatment outcome in a smoking cessation program for adolescent smokers. Drug and Alcohol Dependence. 2007;88(1):79–82. doi: 10.1016/j.drugalcdep.2006.09.006. [DOI] [PMC free article] [PubMed] [Google Scholar]
- Kuntsi J, Oosterlaan J, Stevenson J. Psychological mechanisms in hyperactivity. I. Response inhibition deficit, working memory impairment, delay aversion, or something else. Journal of Child Psychology and Psychiatry. 2001;42:199–210. [PubMed] [Google Scholar]
- Locey M. L, Dallery J. Isolating behavioral mechanisms of inter-temporal choice: Nicotine effects on delay discounting and amount sensitivity. Journal of the Experimental Analysis of Behavior. 2009;91(2):213–223. doi: 10.1901/jeab.2009.91-213. [DOI] [PMC free article] [PubMed] [Google Scholar]
- Ludvig E. A, Balci F, Spetch M. L. Reward magnitude and timing in pigeons. Behavioural Processes. 2011;86:359–363. doi: 10.1016/j.beproc.2011.01.003. [DOI] [PubMed] [Google Scholar]
- Ludvig E. A, Conover K, Shizgal P. The effects of reinforcer magnitude on timing in rats. Journal of the Experimental Analysis of Behavior. 2007;87(2):201–218. doi: 10.1901/jeab.2007.38-06. [DOI] [PMC free article] [PubMed] [Google Scholar]
- Luman M, Oosterlaan J, Sergeant J. A. The impact of reinforcement contingencies on AD/HD: A review and theoretical appraisal. Clinical Psychology Review. 2005;25:183–213. doi: 10.1016/j.cpr.2004.11.001. [DOI] [PubMed] [Google Scholar]
- Madden G. J, Petry N. M, Badger G. J, Bickel W. K. Impulsive and self-control choices in opioid-dependent patients and non-drug-using control participants: Drug and monetary rewards. Experimental and Clinical Psychopharmacology. 1997;5(3):256–262. doi: 10.1037//1064-1297.5.3.256. [DOI] [PubMed] [Google Scholar]
- Madden G. J, Smith N. G, Brewer A. T, Pinkston J. W, Johnson P. S. Steady-state assessment of impulsive choice in Lewis and Fischer 344 rats: Between-condition delay manipulations. Journal of the Experimental Analysis of Behavior. 2008;90(3):333–344. doi: 10.1901/jeab.2008.90-333. [DOI] [PMC free article] [PubMed] [Google Scholar]
- Mazur J. E. An adjusting procedure for studying delayed reinforcement. In: Commons M. L, Mazur J. E, Nevin J. A, Rachlin H, editors. Quantitative analyses of behavior. Vol. 5. The effect of delay and of intervening events on reinforcer value. Hillsdale, NJ: Erlbaum; 1987. pp. 55–73). In. (Eds.) (pp. [Google Scholar]
- Mazur J. E. Hyperbolic value addition and general models of animal choice. Psychological Review. 2001;108(1):96–112. doi: 10.1037/0033-295x.108.1.96. [DOI] [PubMed] [Google Scholar]
- Mazur J. E. Rats' choices between one and two delayed reinforcers. Learning & Behavior. 2007a;35(3):169–176. doi: 10.3758/bf03193052. [DOI] [PMC free article] [PubMed] [Google Scholar]
- Mazur J. E. Species differences between rats and pigeons in choices with probabilistic and delayed reinforcers. Behavioural Processes. 2007b;75(2):220–224. doi: 10.1016/j.beproc.2007.02.004. [DOI] [PubMed] [Google Scholar]
- Mitchell S. H. Measures of impulsivity in cigarette smokers and non-smokers. Psychopharmacology (Berlin) 1999;146:455–464. doi: 10.1007/pl00005491. [DOI] [PubMed] [Google Scholar]
- Monterosso J. R, Ainslie G, Xu J, Cordova X, Domier C. P, London E. D. Frontoparietal cortical activity of methamphetamine-dependent and comparison subjects performing a delay discounting task. Human Brain Mapping. 2007;28:383–393. doi: 10.1002/hbm.20281. [DOI] [PMC free article] [PubMed] [Google Scholar]
- Odum A. L. Delay discounting: I'm a k, your're a k. Journal of the Experimental Analysis of Behavior. 2011a;96(3):427–439. doi: 10.1901/jeab.2011.96-423. [DOI] [PMC free article] [PubMed] [Google Scholar]
- Odum A. L. Delay discounting: Trait variable. Behavioural Processes. 2011b;87:1–9. doi: 10.1016/j.beproc.2011.02.007. [DOI] [PMC free article] [PubMed] [Google Scholar]
- Odum A. L, Baumann A. A. L. Delay discounting: state and trait variable. In: Madden G. J, Bickel W. K, editors. Impulsivity: The behavioral and neurological science of discounting. Washington, DC: APA Books; 2010. pp. 39–65). In. (Eds.) (pp. [Google Scholar]
- Olejnik S, Algina J. Generalized eta and omega squared statistics: Measures of effect size for some common research designs. Psychological Methods. 2003;8(4):434–447. doi: 10.1037/1082-989X.8.4.434. [DOI] [PubMed] [Google Scholar]
- Perry J. L, Larson E. B, German J. P, Madden G. J, Carroll M. E. Impulsivity (delay discounting) as a predictor of acquisition of IV cocaine self-administration in female rats. Psychopharmacology. 2005;178:193–201. doi: 10.1007/s00213-004-1994-4. [DOI] [PubMed] [Google Scholar]
- Rachlin H. The science of self-control. Cambridge, MA: Harvard University Press; 2000. [Google Scholar]
- Rodriguez M. L, Logue A. W. Adjusting delay to reinforcement: Comparing choice in pigeons and humans. Journal of Experimental Psychology: Animal Behavior Processes. 1988;14(1):105–117. [PubMed] [Google Scholar]
- Schweitzer J. B, Sulzer-Azaroff B. Self-control in boys with attention deficit hyperactivity disorder: Effects of added stimulation and time. Journal of Child Psychology and Psychiatry. 1995;36:671–686. doi: 10.1111/j.1469-7610.1995.tb02321.x. [DOI] [PubMed] [Google Scholar]
- Simpson C. A, Vuchinich R. E. Reliability of a measure of temporal discounting. The Psychological Record. 2000;50:3–16. [Google Scholar]
- Solonto M. V, Abikoff H, Sonuga-Barke E, Schachar R, Logan G. D, Wigal T, …Turkel E. The ecological validity of delay aversion and response inhibition as measures of impulsivity in AD/HD: A supplement to the NIMH multimodal treatment study of AD/HD. Journal of Abnormal Child Psychology. 2001;29:215–228. doi: 10.1023/a:1010329714819. [DOI] [PubMed] [Google Scholar]
- Sonuga-Barke E. J, Taylor E, Sembi S, Smith J. Hyperactivity and delay aversion. I. The effect of delay on choice. Journal of Child Psychology and Psychiatry. 1992;33:387–398. doi: 10.1111/j.1469-7610.1992.tb00874.x. [DOI] [PubMed] [Google Scholar]
- Tatham T. A, Zurn K. R. The Med-PC experimental apparatus programming system. Behavior Research Methods, Instruments, and Computers. 1989;21:294–302. [Google Scholar]
- Tripp G, Alsop B. Sensitivity to reward delay in children with attention deficit hyperactivity disorder (ADHD) Journal of Child Psychology and Psychiatry. 2001;42:691–698. [PubMed] [Google Scholar]
- Vichinich R. E, Simpson C. A. Hyperbolic temporal discounting in social drinkers and problem drinkers. Experimental and Clinical Psychopharmacology. 1998;6(3):292–305. doi: 10.1037//1064-1297.6.3.292. [DOI] [PubMed] [Google Scholar]
- Yoon J. H, Higgins S. T, Heil S. H, Sugarbaker R. J, Thomas C. S, Badger G. J. Delay discounting predicts postpartum relapse to cigarette smoking among pregnant women. Experimental and Clinical Psychopharmacology. 2007;15(2):176–186. doi: 10.1037/1064-1297.15.2.186. [DOI] [PubMed] [Google Scholar]