Abstract
The histone methyltransferase WHSC1 (also known as MMSET) is overexpressed in multiple myeloma (MM) as a result of the t(4;14) chromosomal translocation and in a broad variety of other cancers by unclear mechanisms. Overexpression of WHSC1 did not transform wild-type or tumor-prone primary hematopoietic cells. We found that ACA11, an orphan box H/ACA class small nucleolar RNA (snoRNA) encoded within an intron of WHSC1, was highly expressed in t(4;14)-positive MM and other cancers. ACA11 localized to nucleoli and bound what we believe to be a novel small nuclear ribonucleoprotein (snRNP) complex composed of several proteins involved in postsplicing intron complexes. RNA targets of this uncharacterized snRNP included snoRNA intermediates hosted within ribosomal protein (RP) genes, and an RP gene signature was strongly associated with t(4;14) in patients with MM. Expression of ACA11 was sufficient to downregulate RP genes and other snoRNAs implicated in the control of oxidative stress. ACA11 suppressed oxidative stress, afforded resistance to chemotherapy, and increased the proliferation of MM cells, demonstrating that ACA11 is a critical target of the t(4;14) translocation in MM and suggesting an oncogenic role in other cancers as well.
Introduction
Multiple myeloma (MM) is an incurable cancer of B-lineage plasma cells, associated with anemia, renal failure, and cortical bone destruction (1). The recurrent t(4;14)(p16.3;q32.3) chromosomal translocation is detected in 20% of MMs and is associated with shortened overall survival (2–5). The t(4;14) transposes immunoglobulin heavy chain region enhancer elements to the 5′ end of the Wolf-Hirschhorn syndrome candidate 1 gene (WHSC1; also known as MMSET and NSD2) to drive its ectopic expression (4, 6). WHSC1 encodes 3 protein isoforms that are expressed as a result of alternative splicing (WHSC1-I and WHSC1-II) and an internal promoter (REIIBP; refs. 6, 7, and Supplemental Figure 1A; supplemental material available online with this article; doi: 10.1172/JCI63051DS1). The WHSC1-II and REIIBP isoforms contain a SET domain that encodes a histone methyltransferase (HMT), with activity reported toward H4K20 (8, 9), H3K36 (10, 11), and H3K27 (12). The HMT activity of WHSC1-II plays a role in DNA damage responses by recruiting repair factors to DNA breaks, and this recruitment is dependent upon phosphorylation of WHSC1-II Ser102 by ATM (9, 13).
Three lines of evidence support the role of WHSC1 as an oncogene. First, WHSC1 transcripts are consistently overexpressed in t(4;14)-positive myelomas, and WHSC1 is also upregulated by unknown mechanisms in subsets of diverse solid tumor types, including neuroblastoma, in which high WHSC1 levels are associated with tumor aggressiveness (14–16). Second, transcriptional deregulation by the HMT encoded by WHSC1 is a plausible mechanism of carcinogenesis. Indeed, H3K36 methyltransferase activity can be sufficient to initiate malignant transformation (17), and attractive candidate target genes and pathways have been identified for WHSC1 (18, 19). Third, WHSC1 knockdown using shRNAs decreases cell growth and cell adhesion in MM and neuroblastoma cell lines (8, 10, 15, 20). Knockdown using a variety of shRNA constructs has established the dependence of transformed cells on WHSC1 expression, but which WHSC1 isoform is responsible for cell transformation has not been clearly established.
A difficult-to-explain clue into the cell biology of WHSC1 is that a subset of t(4;14) patients with MM harbor translocation breakpoints that result in the overexpression of amino-truncated WHSC1 proteins. Loss of a nucleolar exclusion signal at the amino terminus of WHSC1-II causes altered subcellular localization of these shortened WHSC1 protein products (21), and Ser102 is lost in these truncations, affecting function of WHSC1 in DNA repair (9). Yet, the clinical course of t(4;14)-positive patients is independent of the location of the translocation breakpoints within WHSC1 (21). Therefore, the precise mechanism by which these different WHSC1 gene products contribute to transformation remains unclear.
To improve our understanding of how the t(4;14) contributes to myelomagenesis, we evaluated the effects of 3 major WHSC1 isoforms (WHSC1-I, WHSC1-II, and REIIBP) on hematopoietic cell transformation. Despite an extensive set of reverse genetic experiments, none of the WHSC1 proteins demonstrated significant pro-growth effects. These unexpected results prompted us to examine the 4p16.3 breakpoint region in t(4;14)-positive patients with MM for a missing oncogene. Using RNA tiling arrays, we identified what we believe to be a novel box H/ACA ncRNA, ACA11, encoded within intron 18–19 of the WHSC1 gene overexpressed in t(4;14)-positive MM and other cancers. ACA11 is an orphan small nucleolar RNA (snoRNA) that binds what we believe to be a novel small nuclear ribonucleoprotein (snRNP) complex in MM cells. Overexpression of ACA11 protected MM cells from oxidative stress and modulated tumor proliferation, and knockdown of ACA11 slowed cell proliferation and sensitized MM cells to cytotoxic chemotherapy. The discovery of a snoRNA within WHSC1, a “missing ingredient” overexpressed as a result of the t(4;14), provides an important molecular target in MM pathogenesis.
Results
WHSC1 cDNAs are not sufficient to induce malignant transformation.
Oncogenic activity has been reported for WHSC1 (10, 18, 19), so we sought to compare the transformation potential of the 3 major WHSC1 isoforms. However, overexpression of WHSC1-I, WHSC1-II, and REIIBP did not affect NIH/3T3 fibroblast cell proliferation and did not protect cells from cytotoxic chemotherapy or protect hematopoietic Ba/F3 cells from growth factor withdrawal (Supplemental Figure 1 and data not shown). To assess the effects of WHSC1 isoforms overexpressed in animals, we developed transgenic strains of mice expressing WHSC1-I, WHSC1-II, or REIIBP cDNAs under the control of the B cell–specific immunoglobulin heavy chain enhancer and promoter (Eμ). None of the Eμ-WHSC1 mice had any significant hematopoietic phenotype after 2 years (data not shown). Next, we expressed WHSC1 isoform transcripts more broadly in primary murine hematopoietic cells using ecotropic retroviruses encoding WHSC1-I, WHSC1-II, or REIIBP introduced into bone marrow mononuclear cells transplanted into lethally irradiated syngeneic recipients (BMT recipients). WHSC1 BMT recipients had no detectable hematopoietic phenotype after 1 year of observation using wild-type or tumor-prone Cdkn2a–/– (Arf/Ink4a-null) (22) mice as bone marrow donors (Supplemental Figure 2 and data not shown). While these negative results do not exclude the possibility that WHSC1 proteins contribute to myelomagenesis, they prompted us to reexamine the t(4;14) breakpoint locus at 4p16.3 for an additional oncogenic element.
A noncoding RNA within WHSC1 is overexpressed in t(4;14)-positive MM and other cancers.
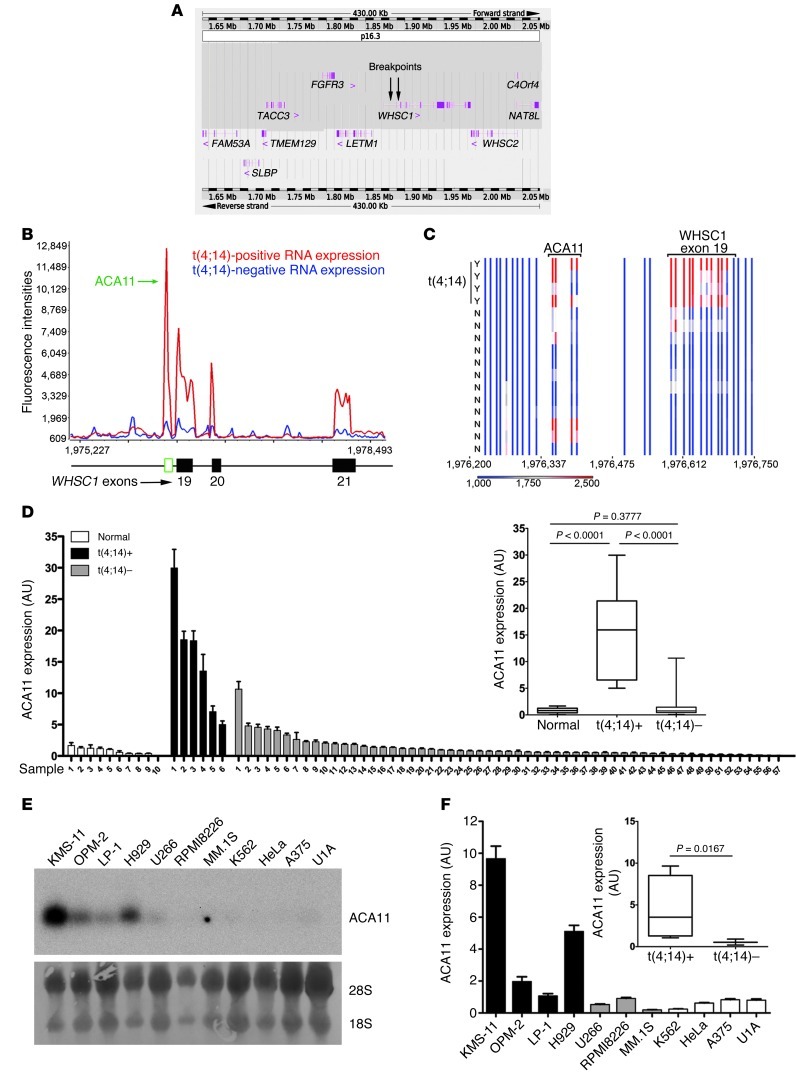
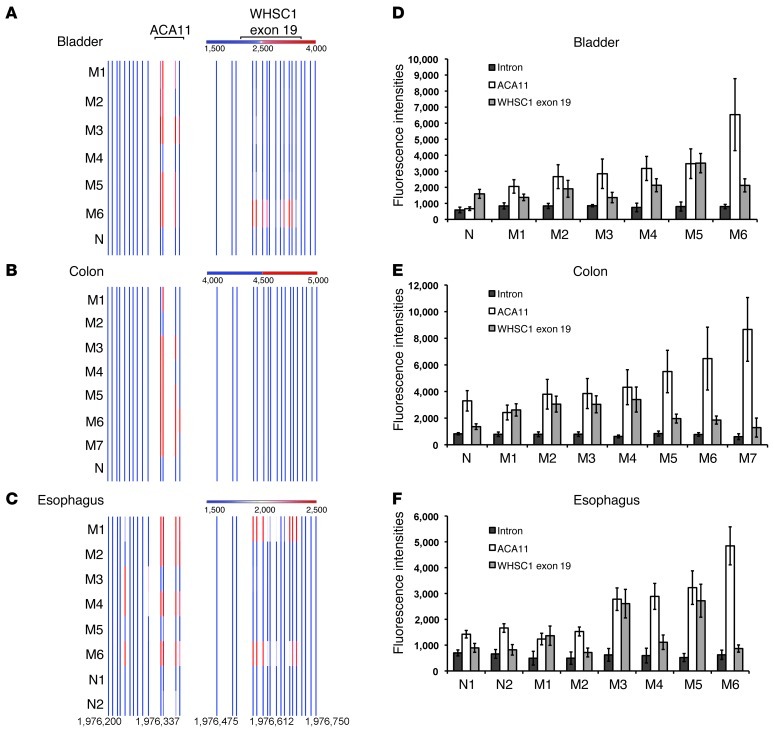
To identify additional oncogenes on chromosome 4 in an unbiased fashion, we designed oligonucleotide tiling arrays spanning the t(4;14) breakpoint region on chromosome 4 (Figure 1A). In samples from patients with MM, expressed RNAs most significantly associated with t(4;14) status mapped to the WHSC1 locus (P = 6.33 × 10⁻⁵; Table 1). Notably, in addition to WHSC1 exon sequences, 1 substantial segment mapped to ACA11 (SCARNA22), a 125-bp noncoding RNA (ncRNA) located within intron 18–19 of WHSC1 (Figure 1, B and C, and Supplemental Figure 3, A and B). Robust expression of ACA11 was significantly associated with the t(4;14) translocation in MM cell lines and patient samples (Figure 1, D–F). ACA11 was also overexpressed in a subset of samples from patients with primary colon, esophageal, and bladder cancer (Figure 2), consistent with its location within WHSC1 (16). These data confirm ACA11 overexpression in t(4;14)-positive MM, but additional studies are required to confirm the hypothesis that ACA11 is upregulated in other cancer types.
Figure 1. ACA11 is activated by t(4;14) in MM.
(A) Schematic diagram of the chromosome 4p16.3 tiling oligonucleotide microarray, spanning 430 Kb across the t(4;14) breakpoint region (breakpoints are indicated by arrows). Annotated genes are indicated with exon structures. (B) Tiling microarray expression data of representative t(4;14)-positive and -negative patients with MM. (C) Heat map of t(4;14)-positive (Y; n = 4) and -negative (N; n = 12) patient samples. (B and C) Numbers indicate base pairs on chromosome 4 (human genome assembly GRCh37). (D) Real-time PCR of ACA11 in samples from patients with MM. The inset shows that ACA11 is significantly associated with t(4;14) status. Normal, normal plasma cells (n = 10); t(4;14)+, t(4;14)-positive patient samples (n = 6); t(4;14)–, t(4;14)-negative patient samples (n = 57). (E) Northern blot of ACA11 expression in human MM cell lines. t(4;14)-positive cell lines included KMS-11, OPM-2, LP-1, and H929 cells; t(4;14)-negative cell lines included U266, RPMI8226, and MM.1S cells; and non-MM cell lines included K562, HeLa, A375, and U1A cells. Loading controls were 28S and 18S rRNA. (F) ACA11 expression by real-time PCR is significantly associated with t(4;14) in MM cell lines. qRT-PCR data in D and F were normalized to the mean of 3 reference genes (GAPDH, UBC, YWHAZ). Data are presented as mean ± SD, with a box-whisker plot of minimum-to-maximum values (inset) (n = 3). The line within the box is the median value. The box represents the first and third quartiles. The whiskers show the largest and smallest events within at least 1.5 times the size of the box from the nearest edge.
Table 1.
List of tiling array probe segments associated with t(4;14) status in samples from patients with MM
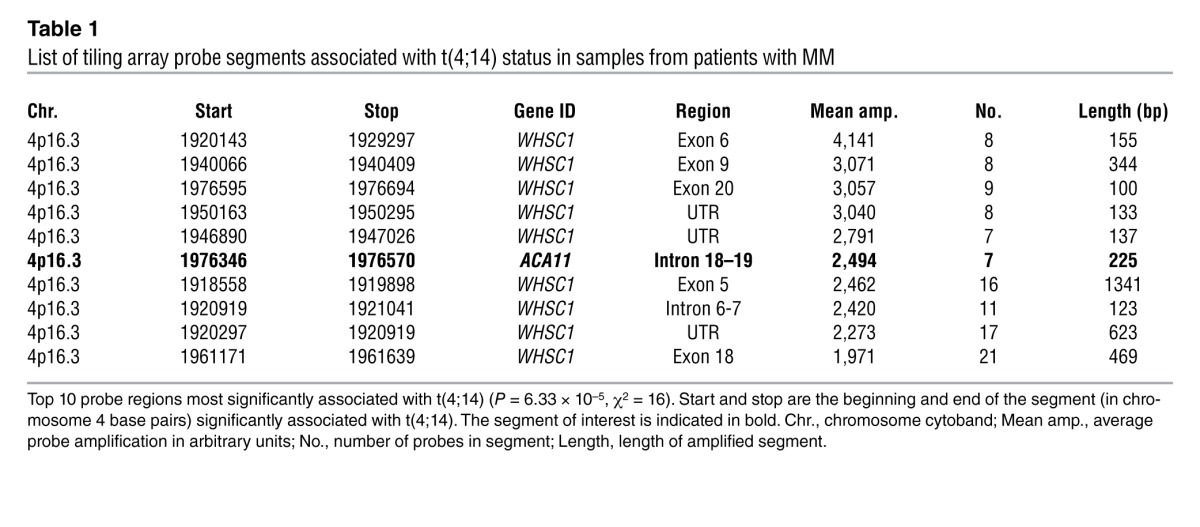
Figure 2. ACA11 is overexpressed in bladder, colon, and esophageal cancers.
(A–C) ACA11 is overexpressed in samples from patients with (A) bladder, (B) colon, and (C) esophageal cancer. Heat maps of RNA expression at the ACA11 locus were measured using our custom chromosome 4 tiling arrays. Each bar represents the normalized mean expression value obtained from quadruplicate probes representing each physical location. Numbers indicate base pairs on chromosome 4 (human genome assembly GRCh37). (D–F) Graphs of data shown in A–C. ACA11 levels in (D) bladder, (E) colon, and (F) esophagus samples were plotted using raw expression values of 4 probes. Intron, intron 18–19 of WHSC1 upstream of ACA11. Data in D–F are presented as mean ± SD (n = 4). M, malignant tumor samples. N, normal control samples.
ACA11 is a box H/ACA snoRNA.
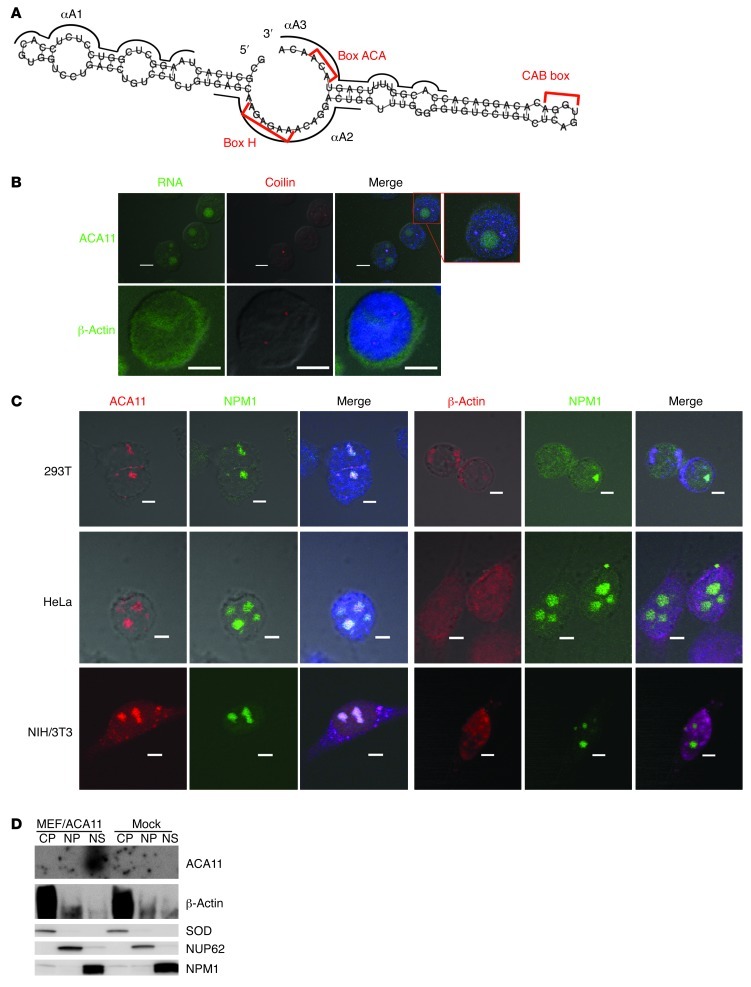
The predicted secondary structure of ACA11 was typical of box H/ACA ncRNAs and revealed 2 hairpin elements connected by a single-stranded hinge carrying the canonical H box (AnAnnA) followed by a 3′ tail containing the ACA box (Figure 3A). ACA11 is evolutionarily conserved (Supplemental Figure 3C), but the murine homolog of ACA11 (SCARNA23), with 82% sequence homology to ACA11, is hosted by a different, distant gene in mice (Supplemental Figure 3D), consistent with the categorization of box H/ACA snoRNAs as retroposon-associated mobile genetic elements (23).
Figure 3. ACA11 localizes to nucleoli.
(A) Predicted secondary structure of ACA11. Red brackets indicate H box, ACA box, and CAB motifs. Black lines indicate ASOs. (B) Endogenous ACA11 is not significantly localized to Cajal bodies (coilin, red) in MM cells. ACA11 or β-actin is in green; DNA (DAPI) is in blue. Scale bar: 5 μm. (C) Localization of ACA11 to nucleoli. ACA11 or β-actin is shown in red; NPM1 is shown in green; DNA (DAPI) is in blue. Scale bar: 5 μm. (D) Northern blot (top 2 panels) for ACA11 in cytoplasmic (CP), nucleoplasmic (NP), and nucleolar (NS) fractions. Western blot (bottom 3 panels) of cytoplasmic (SOD), nuclear (NUP62), and nucleolar (NPM1) markers.
Box H/ACA RNAs can accumulate either in nucleoli (i.e., snoRNAs) or in the nucleoplasmic Cajal bodies (i.e., small Cajal body–specific RNAs [scaRNAs]) (24), and we sought to better classify ACA11 based on its subcellular localization. Using in situ hybridization followed by immunofluorescence in t(4;14)-positive H929 MM cells, we found that ACA11 localized to dot-like nuclear structures. Costaining the same cells with a marker of Cajal bodies demonstrated that the majority of ACA11 RNA did not localize to Cajal bodies (Figure 3B). On the other hand, we found that ACA11 colocalized with GFP-tagged nucleophosmin (NPM1), a marker of nucleoli (Figure 3C and ref. 25). To confirm the nucleolar localization of ACA11, stably transfected Arf–/– mouse embryonic fibroblasts (MEFs) were separated into cytoplasmic, nucleoplasmic, and nucleolar fractions and subjected to Northern blot analysis for ACA11. ACA11 was predominantly localized to the nucleolar fraction and was not detectable in either cytoplasmic or nucleoplasmic fractions (Figure 3D). Although these data do not exclude a role for small amounts of ACA11 in Cajal bodies, based on its predominant nucleolar localization, we classified ACA11 as a snoRNA.
ACA11 binds nucleolar proteins implicated in RNA processing.
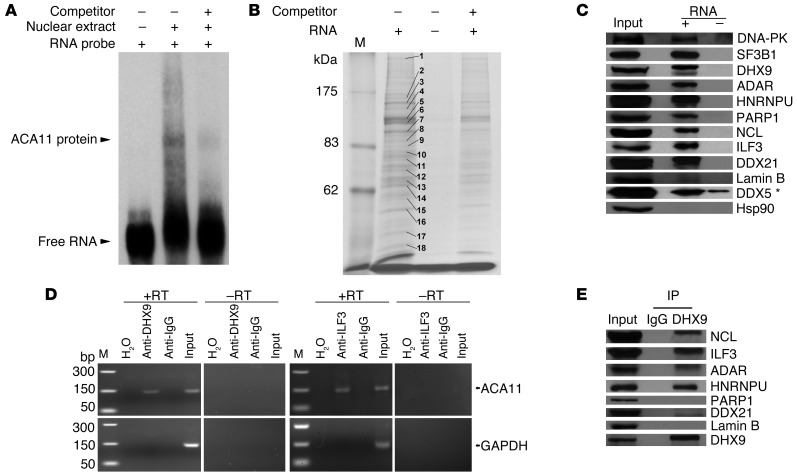
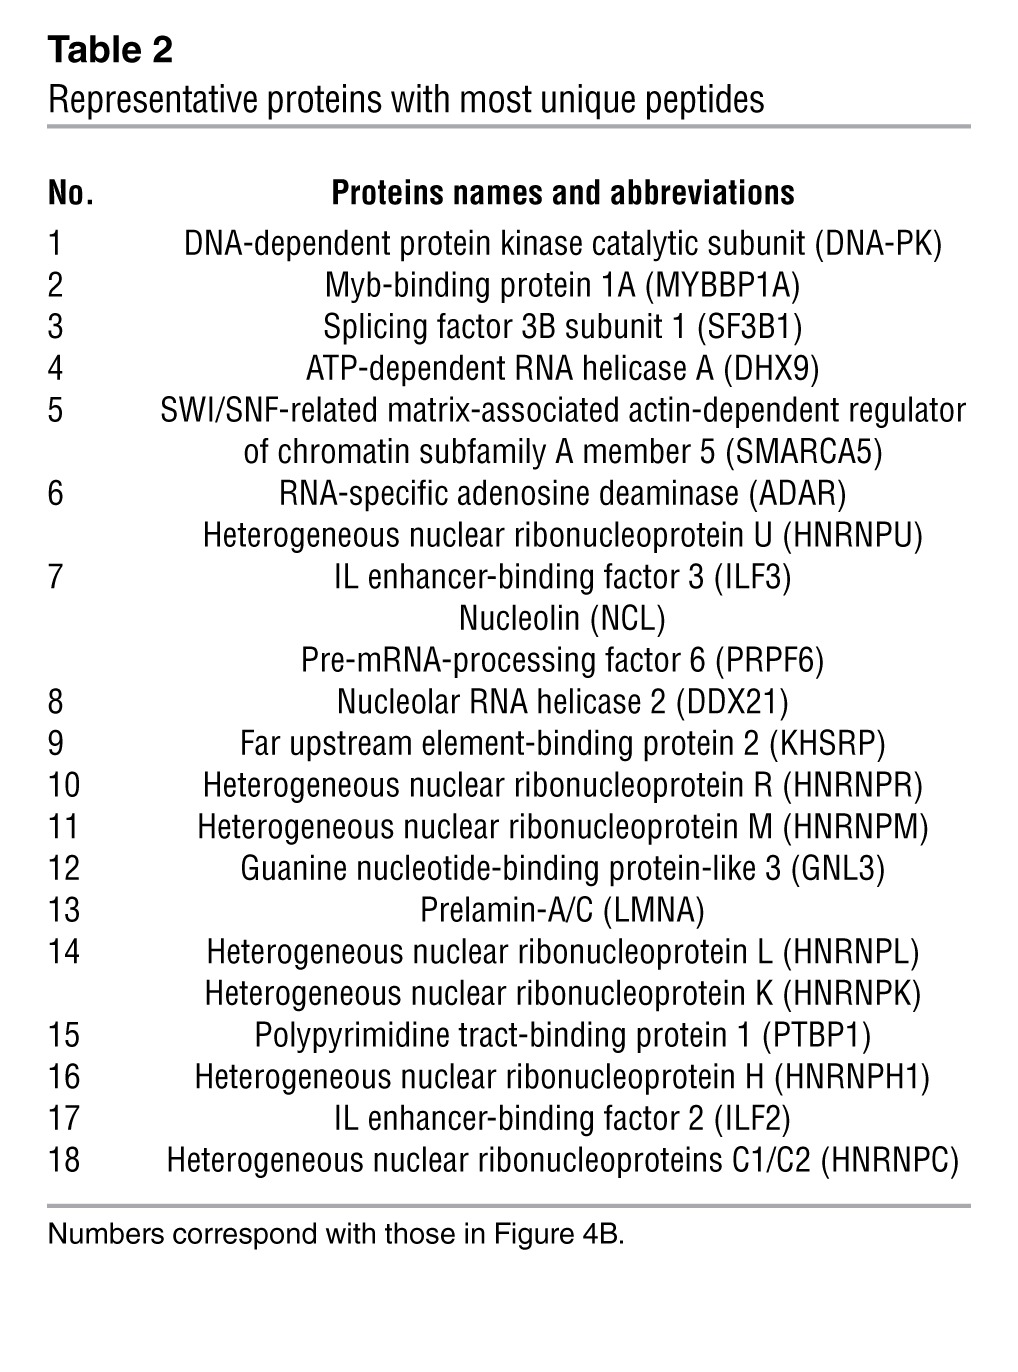
Box H/ACA snoRNAs function as guide RNAs for snRNP complexes (26). To test whether ACA11 physically associates with nuclear proteins, we performed RNA EMSA. The migration of labeled ACA11 RNA was slowed after incubating with H929 cell nuclear extracts, demonstrating a physical interaction of ACA11 with nuclear proteins (Figure 4A). We then used RNA affinity purification followed by mass spectrometry (MS) to identify specific protein partners of ACA11 in t(4;14)-positive MM cells (Figure 4B and Table 2). Using molecular pathway analysis, most identified proteins that bound to ACA11 (Supplemental Table 1) were implicated in RNA processing (Supplemental Table 2), including RNA splicing factors (SF3B1, SF3B2, and SFPQ), ATP-dependent RNA helicase A (DHX9), RNA-specific adenosine deaminase (ADAR), and 8 members of the heterogeneous nuclear ribonucleoprotein family (HNRNP). Western blot of RNA affinity-purified lysates confirmed that 9 proteins identified by MS specifically bound to ACA11 (Figure 4C). Notably, dyskerin and other well-characterized components of the pseudouridylation machinery that comprise other box H/ACA snoRNA snRNPs (27) were absent from the ACA11 snRNP.
Figure 4. ACA11 binds a noncanonical ribonucleoprotein complex consisting of a set of proteins implicated in RNA processing.
(A) RNA EMSA confirming ACA11 binding to proteins from H929 cell nuclear extracts. Competitor, unlabeled ACA11 RNA. (B) Coomassie-stained SDS-PAGE gel of ACA11 pull-downs used for identification of proteins binding to ACA11 by MS. Representative proteins with the most abundant, unique peptides in each indicated band are marked with numbers that correspond to those in Table 2. M, protein marker. (C) Confirmation of ACA11-binding proteins by Western blot. The ACA11-protein complex was purified as in B and subjected to Western blot with antibodies to proteins identified by MS. The asterisk indicates nonspecific binding. Hsp90 was used as a negative control. (D) Confirmation of ACA11 presence in a DHX9/ILF3 ribonucleoprotein complex by CLIP followed by RT-PCR using H929 cells. H2O was used as a water template for RT-PCR. GAPDH was used as an internal control. M, DNA marker. (E) Physical interaction of ACA11 ribonucleoprotein complex proteins NCL, ILF3, ADAR, and HNRNPU with DHX9 in H929 cells was confirmed by immunoprecipitation.
Table 2.
Representative proteins with most unique peptides
To confirm association between these proteins and ACA11, we performed cross-linking immunoprecipitation (CLIP) followed by RT-PCR. ACA11 RNA was readily detectable in both DHX9 and IL enhancer-binding factor 3 (ILF3) immunoprecipitates in H929 cells (Figure 4D). We also used immunoprecipitation–Western analysis to evaluate protein-protein interactions within the ACA11 complex. Endogenous ILF3 was readily identified in DHX9 immunoprecipitates, as were the candidate ACA11-binding proteins nucleolin (NCL), ADAR, and HNRNPU (Figure 4E). These results were confirmed in a second t(4;14)-positive MM cell line (LP-1; data not shown). DNA-dependent protein kinase catalytic subunit (DNA-PK) and SF3B1 immunoreactive bands were less intense, suggesting weaker or indirect binding to DHX9 (data not shown). In MM cells, therefore, ACA11 appeared to participate in a unique snRNP complex composed of at least DHX9, ILF3, NCL, ADAR, and HNRNPU. Additional studies are required to confirm the components of this snRNP in live cells.
RNA targets of the ACA11 snRNP include a set of snoRNA intermediates.
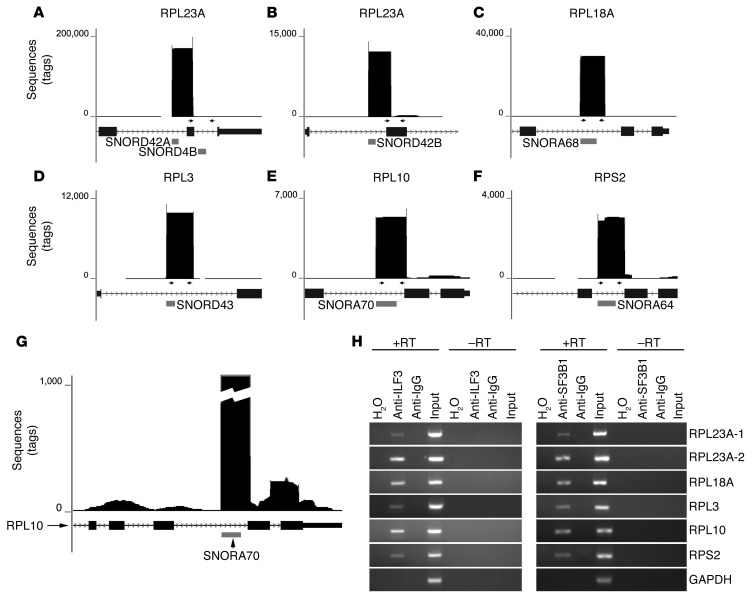
To identify RNA substrates of the ACA11 snRNP, we immunoprecipitated ILF3 from H929 cells and subjected isolated RNA to deep sequencing (Supplemental Figure 4). Among the 50 most abundant sequences (Supplemental Table 3), the largest number of sequence reads (626,876) mapped to snoRNA genes (Table 3). Six of these snoRNAs are positioned within ribosomal protein (RP) gene hosts. More precisely, these reads uniformly mapped sharply to the 5′ ends of snoRNA genes, spanned the snoRNAs, and extended into 3′ intronic and exonic regions of the host RP genes (Figure 5, A–G). Sequence data were confirmed by RT-PCR of snoRNA genes in ILF3 and SF3B1 immunoprecipitates in 2 MM cell lines (Figure 5H). These results suggest that ACA11 snRNP complexes interact with a set of snoRNA intermediates characterized by sequences partially excised from their host introns at their 5′ end but retaining a 3′ intronic tail.
Table 3.
Summary of deep sequencing data
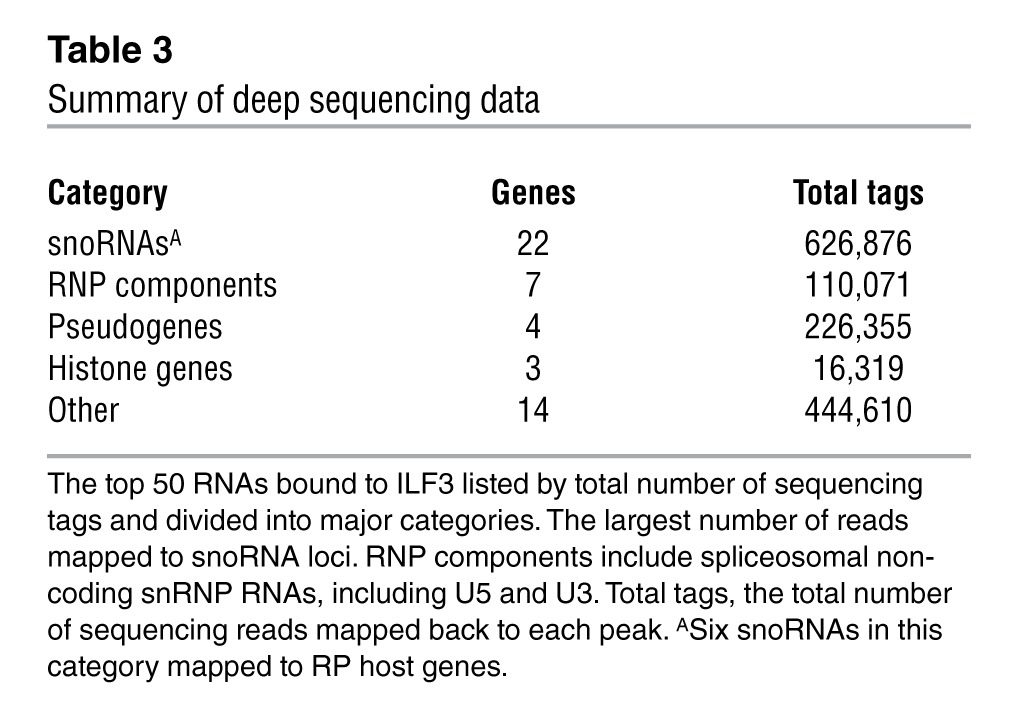
Figure 5. RNA targets of the ACA11 ribonucleoprotein complex identified by RNP immunoprecipitation and deep sequencing.
(A–F) Graphical representation of sequencing peaks mapping to the 6 targets of ACA11 snRNP. The horizontal gray bars indicate the locations of snoRNAs visualized in the UCSC genome browser. Arrows represent primers used for RT-PCR in H. (G) The same data as in E shown with lower vertical scale demonstrate smaller peaks of RPL10 exons. (H) RT-PCR confirms the presence of the indicated snoRNA intermediates resident within RP genes in the ILF3-, SF3B1-, or control IgG-precipitated complexes from H929 cells. H2O was used as a water template. GAPDH was used as control.
ACA11 downregulates RP genes without affecting ribosomal biogenesis or cell growth.
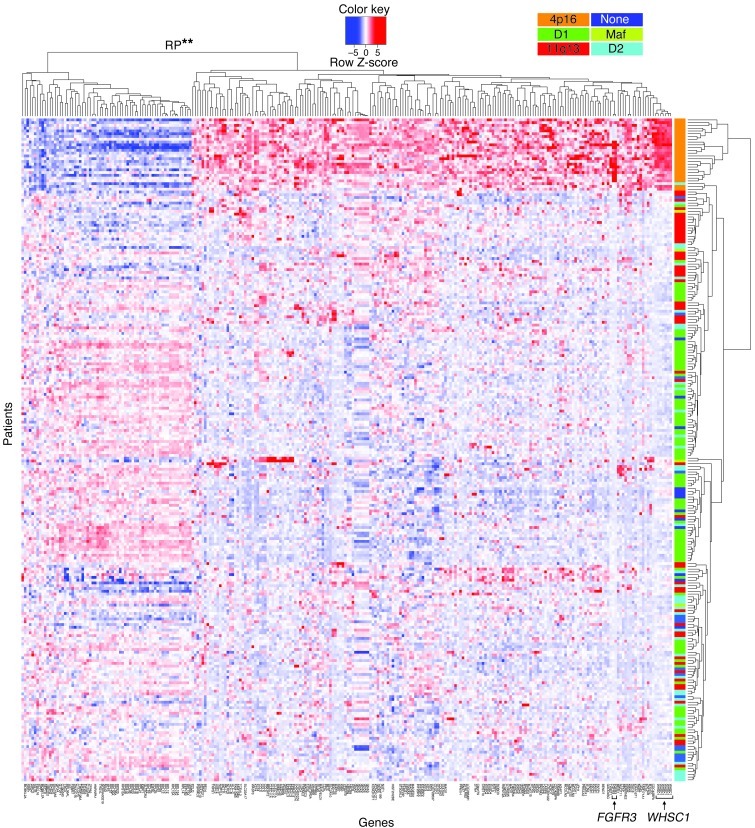
At the same time, we sought to identify an mRNA expression signature associated with t(4;14)-positive MM using available microarray data from 239 patients with MM. We compared the WHSC1 expression cluster [i.e., t(4;14)] pairwise with 5 other defined MM expression clusters to identify a prioritized list of gene expression changes specifically associated with t(4;14)-positive myeloma cases. As expected, the WHSC1 and FGFR3 genes closest to chromosome 4 breakpoints were highly expressed in t(4;14)-positive cases (Figure 6). Among the total 260 probes, we found 192 probes (111 unique genes) upregulated and 68 probes (50 unique genes) downregulated in t(4;14)-positive cases (Supplemental Table 4). We analyzed the t(4;14) signature genes using the Kyoto Encyclopedia of Genes and Genomes database. Strikingly, there was a powerful association between t(4;14) and downregulation of RP genes (P = 4.8 × 10⁻²⁰; Supplemental Table 5) in samples from patients with MM.
Figure 6. A t(4;14) gene expression signature defined by mRNA expression microarray data from 239 samples from patients with myeloma.
WHSC1 is upregulated in all 4p16 patients (arrow), and the nearby FGFR3 gene (arrow) is upregulated in most but not all 4p16 patients. Previously defined patient subgroup clusters (see Methods) are indicated by orange, dark green, red, dark blue, light green, and light blue. Highly significant downregulation (**P = 4.8 × 10⁻²⁰) of RP genes was found in the 4p16 (i.e., WHSC1, orange) subgroup.
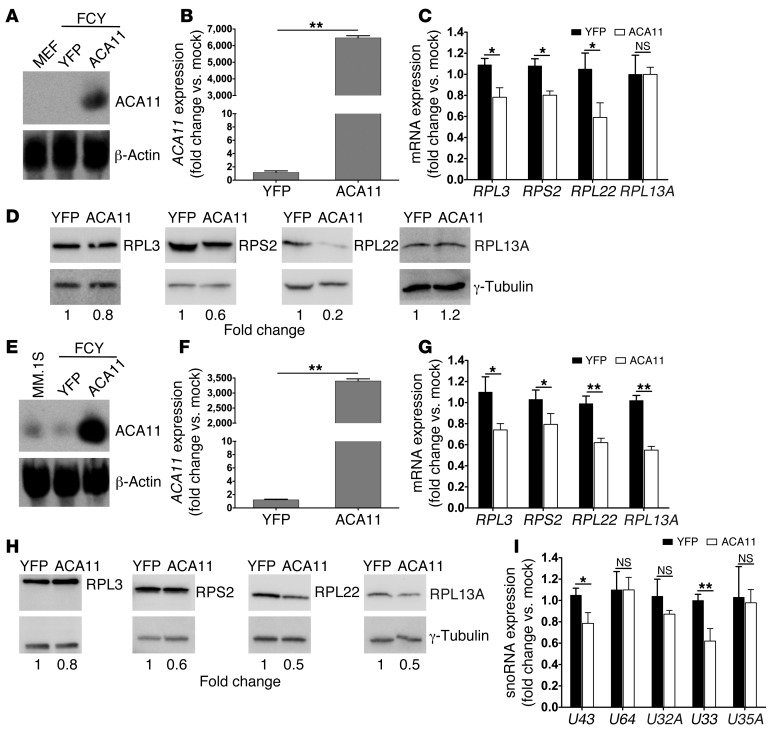
snoRNAs function primarily as guide RNAs for the pseudouridylation of ribosomal and spliceosomal RNAs, but additional roles for this large class of ncRNAs likely remain undiscovered. We sought to explore the possible role of ACA11 in cancer and began by determining whether ACA11 expression mediated the downregulation of RP gene transcripts that we observed in t(4;14)-positive patients with MM. Consistent with the mRNA expression signature observed (Figure 6), we found that ACA11 expression significantly suppressed certain RP gene transcripts and steady-state ribosome protein levels in MEFs (Figure 7, A–D) and in MM cells (Figure 7, E–H). Intriguingly, however, overexpression of ACA11 did not significantly affect ribosomal subunit assembly (data not shown) or polysome formation (Supplemental Figure 5A), and ACA11 overexpression did not affect cell volume or cell mass, hallmarks of ribosomal biogenesis (Supplemental Figure 5, B and C). Recently, box C/D snoRNAs resident in the RP gene RPL13A were found to mediate cell death in response to oxidative stress (28). Importantly, we noted that RPL13A and snoRNA U33 at that locus were downregulated by ACA11 in MM cells (Figure 7, G–I). These findings lead us to test the effect of ACA11 expression on oxidative stress.
Figure 7. ACA11 provides evidence for the t(4;14) gene signature in part — ACA11 is sufficient to downregulate RP genes.
(A) Overexpression of ACA11 confirmed by Northern blot analysis in Arf–/– MEFs stably transduced with ACA11 lentiviruses. β-Actin was used as loading control. (B) Overexpression of ACA11 in Arf–/– MEFs as measured by qRT-PCR. (C) RP mRNA expression in Arf–/– MEFs overexpressing ACA11 was analyzed by qRT-PCR. (D) Expression of RPs in Arf–/– MEFs overexpressing ACA11 demonstrated by Western blot. γ-Tubulin was used as loading control. (E) Overexpression of ACA11 confirmed by Northern blot analysis in MM.1S cells stably transduced with ACA11 lentiviruses. β-Actin was used as loading control. (F) qRT-PCR showing the expression of ACA11 in MM.1S cells in E. (G) RP mRNA expression in MM.1S cells overexpressing ACA11 was analyzed by qRT-PCR. (H) Downregulation of RPs in MM.1S cells overexpressing ACA11 demonstrated by Western blot. γ-Tubulin was used as loading control. (I) Small RNAs were isolated from MM.1S cells overexpressing ACA11. snoRNA expression was analyzed by qRT-PCR. U43, snoRNA located in RPL3; U64, snoRNA located in RPS2; U32A, U33, and U35A, snoRNAs located in RPL13A. qRT-PCR data were normalized to the average of 3 reference genes, (B, C, F, and G) GAPDH, UBC, and YWHAZ or (I) U6, U44, and U48, and are shown as fold change relative to that of mock-treated cells. Data represent mean ± SD (n = 3). *P < 0.05, **P < 0.01.
ACA11 modulates oxidative stress responses and contributes to MM cell proliferation.
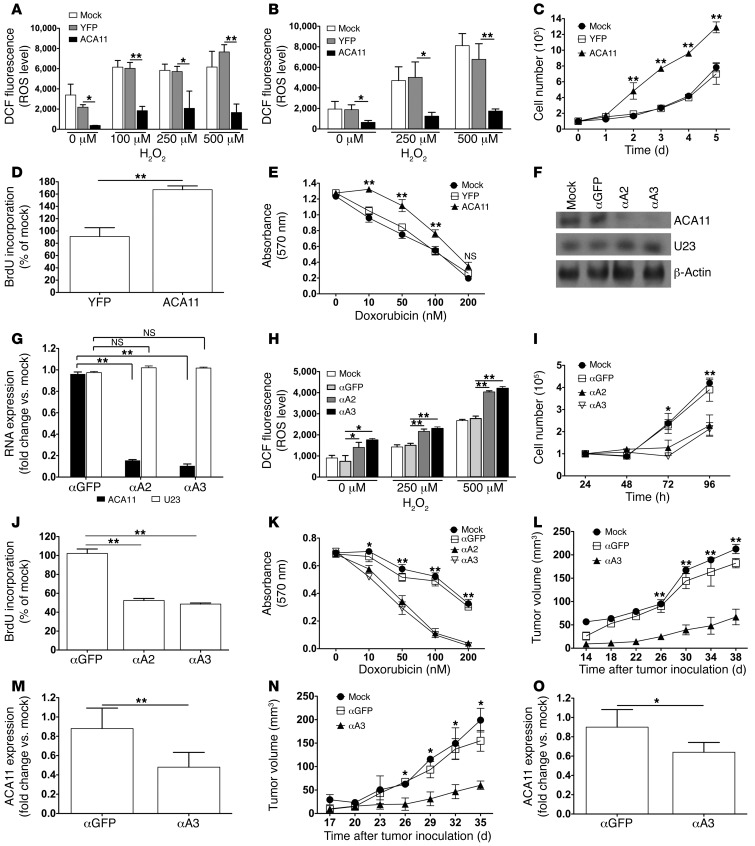
ACA11 overexpression significantly lowered basal levels of ROS and suppressed ROS levels following challenge with hydrogen peroxide (H2O2) in MEFs (Figure 8A). To evaluate its effect in human MM cells, we overexpressed ACA11 in the t(4;14)-negative MM.1S cell line, and these cells had significantly reduced ROS levels at baseline and in response to challenge with peroxide (Figure 8B). Furthermore, overexpression of ACA11 increased proliferation (Figure 8, C and D) and conferred resistance to cytotoxic chemotherapy in t(4;14)-negative MM.1S cells (Figure 8E). Next, we knocked down ACA11 in t(4;14)-positive H929 human MM cells using antisense oligonucleotides (ASOs; Figure 3A, Figure 8, F and G, and Supplemental Figure 6, A–D). ACA11 knockdown significantly increased ROS production (Figure 8H), decreased cell proliferation as measured by cell counts and BrdU incorporation (Figure 8, I and J), and sensitized MM cells to chemotherapy (Figure 8K). Knockdown of ACA11 also significantly reduced growth of MM tumors in mice (Figure 8, L–O). Importantly, knockdown of ACA11 did not alter WHSC1-I, WHSC1-II, or REIIBP protein levels (Supplemental Figure 6E), but knockout of WHSC1 by other investigators (20) resulted in loss of ACA11 expression (Supplemental Figure 6F). Knockdown of ACA11 to undetectable levels in ACA11-low RPMI8226 MM cells also increased ROS levels, decreased cell proliferation, and reduced growth of tumors in mice, suggesting that ACA11 functions even at low levels in t(4;14)-negative MM cells (Figure 8, N and O, and Supplemental Figure 7). These results demonstrate that ACA11 suppresses oxidative stress, facilitates cell proliferation, and protects cells from the effects of chemotherapy.
Figure 8. ACA11 functions to modulate oxidative stress, cell proliferation, and resistance to chemotherapy.
(A and B) ROS levels, quantified by DCFH-DA (DCF) labeling, are suppressed by ACA11 expression in (A) Arf–/– MEFs or (B) MM.1S cells at baseline and upon challenge with hydrogen peroxide (H2O2). (C and D) ACA11 expression increased growth and proliferation of MM.1S cells as measured by (C) cell counting and (D) BrdU-ELISA relative to mock-treated cells. (E) ACA11 increased resistance of MM.1S cells to cytotoxic chemotherapy as measured by MTT viability assay. (F and G) Northern blot and qRT-PCR analyses of ACA11 knockdown in H929 cells 4 days after transfection with ASOs. β-Actin was used as loading control. U23, unrelated snoRNA. αA2 and αA3 are ASOs that target ACA11. (H–K) Knockdown of ACA11 in H929 cells (H) increased ROS levels, (I) decreased cell growth, (J) decreased cell proliferation, and (K) decreased resistance to cytotoxic chemotherapy. (L and N) Growth of (L) KMS-11 and (N) RPMI8226 cells in immunocompromised mice is reduced by ACA11 knockdown. (M and O) qRT-PCR showing the expression of ACA11 in (M) KMS-11 and (O) RPMI8226 xenograft tumors. Cells were nucleofected with 600 pmol ASOs per 106 cells and cultured for (I) 24 hours or (H, J–L, and N) 48 hours before further analysis. qRT-PCR data in G, M, and O were normalized to the average of 3 reference genes (GAPDH, UBC, YWHAZ) and are shown as fold change relative to that of mock-treated cells. All data shown represent mean ± SD (n = 3 [A–E and G–K], n = 5 [L–O]). *P < 0.05, **P < 0.01.
Discussion
WHSC1 proteins are consistently expressed as a consequence of the t(4;14) and are required for the survival of MM cell lines. Surprisingly, we found no phenotype for WHSC1 cDNA isoforms in a range of overexpression assays. WHSC1 overexpression had no effect on proliferation either in lymphoid Ba/F3 or immortalized NIH/3T3 cells (Supplemental Figure 1). Similarly, we found no phenotype in Eμ-WHSC1-I, WHSC1-II, or REIIBP transgenic mice or in wild-type murine bone marrow transduction-transplantation (BMT) experiments. Unpublished studies suggest that WHSC1 overexpression in primary B cells may have cell death-promoting effects (P. Leif Bergsagel, unpublished observations), and the potential toxicity of WHSC1 was the rationale for our use of Cdkn2a knockout (null for both Ink4a and Arf) mice as bone marrow donors in follow-up BMT experiments. Using tumor-prone, apoptosis-resistant Cdkn2a–/– mice as bone marrow donors, we overexpressed WHSC1 isoforms in primary hematopoietic cells (Supplemental Figure 2D). However, even in this permissive genetic background, none of the WHSC1 isoforms perturbed normal hematopoiesis (Supplemental Figure 2). Negative results do not exclude an important role for WHSC1 proteins in MM cell transformation, but they stimulated our search for a missing ingredient in t(4;14) biology. We analyzed transcripts deregulated by the t(4;14) at the 4p16.3 locus in an unbiased fashion using expression tiling arrays and uncovered what we believe to be a new piece to the puzzle: a snoRNA embedded within the WHSC1 locus. ACA11 is a small (125-bp) nucleolar-localized RNA (i.e., snoRNA), with a double-hairpin structure and box H and box ACA domains (Figure 3A). Box H/ACA snoRNAs play roles in splicing and ribosome biogenesis by guiding the pseudouridylation of spliceosomal and ribosomal RNAs, but ACA11 is an orphan snoRNA with no known RNA target.
Using custom tiling arrays, we detected the expression of ACA11 in MM and other cancers in a pattern consistent with the physical linkage of this snoRNA to WHSC1 (Figure 1, B and C, and Figure 2). We confirmed ACA11 expression in MM cell lines using Northern blots (Figure 1E). We also developed a quantitative real-time PCR (qRT-PCR) assay for ACA11 using 3 housekeeping gene controls to accurately measure ACA11 levels in 11 cell lines and 63 samples from patients with MM (Figure 1, D and F). ACA11 was significantly associated with t(4;14) in MM cell lines (P = 0.0167) and in patients with MM (P < 0.0001). Despite this strong association, ACA11 was overexpressed in some t(4;14)-negative cell lines and patient samples, which we did not find surprising. Up to 25% of t(4;14)-negative cases upregulate WHSC1 transcripts to the same level as that in t(4;14)-positive cases (14, 29), suggesting that WHSC1 is deregulated by mechanisms besides t(4;14). Furthermore, WHSC1 is overexpressed in neuroblastoma, colon, esophageal, and bladder cancers that do not harbor the t(4;14) (14–16). ACA11 overexpression in primary bladder, colon, and esophageal cancer samples suggests a potential role for ACA11 in nonhematopoietic tumors (Figure 2). Activation of ACA11 by more than one mechanism may be considered a sign of its importance to tumor biology.
We confirmed by confocal microscopy and cell fractionation studies that ACA11 localized predominantly to cell nucleoli in MEF cells overexpressing ACA11 (Figure 3D). snoRNAs are nucleolar-localized ncRNAs, which serve as template guides for the posttranscriptional modification of target ribosomal and spliceosomal RNAs (24). We can not exclude the possibility that during normal development endogenous ACA11 might localize to Cajal bodies (i.e., and be categorized as a scaRNA), but in this setting our data categorize ACA11 as a snoRNA. After the telomerase RNA subunit, ACA11 is the only the second box H/ACA class snoRNA to our knowledge with a role in cancer and the first to be directly activated in cancer by chromosomal translocation.
We found ACA11 to be a component of a novel snRNP complex. Box H/ACA snoRNAs function primarily as guide RNAs for the dyskerin snRNP complex responsible for pseudouridylation of ribosomal RNAs (27). MS analysis of ACA11-binding proteins revealed a cohort of proteins distinct from the canonical box H/ACA snoRNA-binding proteins: SF3B1, RNA helicase A, ADAR, and several members of the heterogeneous nuclear ribonucleoprotein family (HNRNPR, HNRNPL, HNRNPM, HNRNPK, and HNRNPU; Figure 4B and Table 2). We confirmed ACA11 interaction with 5 highly expressed proteins by Western blotting of ACA11 snoRNA pull-downs (Figure 4, C–E). We did not find any protein components of the dyskerin snRNP binding to ACA11 in MM cells. Instead, the ACA11 snRNP appears to be a novel complex involved in regulation of RNA processing. Deep sequencing experiments revealed an unusual species of RNA, consisting of partially processed snoRNAs (Figure 5 and Table 3). We propose that the ACA11 snRNP is required for the 3′ processing of select snoRNAs. Additional work will be required to characterize the biochemistry of this snRNP and the targets that may be relevant to cancer biology.
Gene targeting at the human WHSC1 locus must be performed with caution, because ACA11 expression is coupled to that of WHSC1. ACA11 knockdown by ASOs did not affect WHSC1 protein levels, but ACA11 expression was drastically reduced in KMS-11 MM cells with WHSC1 knocked out by homologous recombination (TKO1 and TKO2 cells; Supplemental Figure 6, E and F). Kuo et al. (18) recently used KMS-11 and TKO2 cells as a foundation to identify target genes of WHSC1 and proposed that WHSC1 HMT activity activates an oncogenic program. These authors first compared gene expression profiles of KMS-11 cells (WHSC1 intact) and TKO2 cells (WHSC1 deleted) as an initial screen for WHSC1 target genes, but TKO2 cells are in fact knocked out for ACA11 as well, not just WHSC1. These authors used WHSC1 cDNA constructs (i.e., without ACA11) to demonstrate the specificity of HMT regulation of specific oncogenes (e.g., TGFA and MET), but it remains unclear which HMT-induced genes contribute to t(4;14)-positive MM disease behavior. Kuo also demonstrated that WHSC1 cDNAs transformed primary Arf-null fibroblasts (MEFs), which we cannot reconcile with our data except to say that we used different assays for transformation (BMT compared with methylcellulose). WHSC1 expression certainly plays an important role in t(4;14)-mediated transformation. We propose that WHSC1 and ACA11 are 2 distinct cancer genes encoded at the same locus, much as Arf and Ink4a are both encoded by the Cdkn2a locus. Future studies of WHSC1 effects in tumor biology should take into account the fact that ACA11 is a distinct entity within the WHSC1 locus that can significantly affect cell behavior.
We found that a major component of the t(4;14) mRNA expression profile in samples from patients with MM, i.e., downregulation of RP genes (Figure 6), can be attributed to ACA11 expression. Downregulation of RP genes has been observed in patients with MM by other investigators but without explanation (30). Genes involved in protein biosynthesis, including RP genes, are relatively upregulated in hyperdiploid MM due to chromosomal copy number abnormalities (31), but the RP gene signature that we observed is unlikely due simply to nonhyperdiploidy, because we used recursive analysis to identify a gene signature specifically associated with t(4;14). We demonstrated that ACA11 was sufficient to downregulate a handful of t(4;14)-associated RP genes (Figure 7).
We assessed the downstream effects of ACA11 on ribosome function by testing polysome formation, cell growth, and cell volume but found no significant changes upon overexpression of ACA11 (Supplemental Figure 5). Rather, as revealed by deep sequencing of ACA11 snRNP RNAs, the molecular targets of ACA11 appear to be snoRNAs, hosted within RP genes. Recently, RPL13A and its resident snoRNAs were found to mediate ROS (28), and we found that ACA11 expression protected cells from oxidative stress and cytotoxic chemotherapy. We used 3 MM cell lines for functional studies, including the MM.1S cell line, which expresses ACA11 at very low levels. Forced expression of ACA11 in MM.1S cells reduced ROS levels, increased proliferation, and significantly protected the cells from cytotoxic chemotherapy (Figure 8, B–E). Knockdown of ACA11 significantly affected the proliferation, BrdU incorporation, and ROS levels in both t(4;14)-positive H929 and t(4;14)-negative RPMI8226 cells, and these biologic effects were consistently matched with the degree of knockdown achieved (Figure 8, F–K, and Supplemental Figure 7). Real-time PCR assays for ACA11 expression found that in fact RPMI8226 cells expressed ACA11 at readily detectable levels, and ASO knockdown significantly reduced ACA11 levels in these cells. The consistent functional effects we observed using both ACA11 overexpression and well-controlled ASO knockdowns make the possibility of off-target ASO effects unlikely. Mateescu et al. (32) recently demonstrated that miR-200 family members miR-141 and miR-200a increase ROS and sensitivity to chemotherapy via p38a in ovarian cancer. ACA11 provides essentially the opposite effect, i.e., suppression of ROS and protection of cells from chemotherapy (Figure 8, B, E, H, and K).
We believe that ACA11 is a novel element of t(4;14) biology. Does ACA11 by itself cause MM? We doubt that ACA11 overexpression alone will be sufficient to induce disease. The t(4;14) is found in patients with premalignant monoclonal gammopathy of undetermined significance at rates comparable to those seen in patients with MM, suggesting that the t(4;14) itself is likely an early event in MM pathogenesis that alone is insufficient to cause MM. Furthermore, 85% percent of t(4;14)-positive MM cases also harbor chromosome deletions that affect an unidentified tumor suppressor gene on chromosome 13, suggesting that additional mutations are required for disease development. Conclusive demonstration of the role of ACA11 in MM pathogenesis will likely require the development of mouse models with complex genetics. An intriguing possibility is that WHSC1 proteins and the ACA11 snoRNA cooperate in MM pathogenesis. Taken together, our findings demonstrate that ACA11 is a functionally important component of the t(4;14) translocation. Detection and/or pharmaceutical targeting of ACA11 may be useful in cancer patient care.
Methods
Patient samples.
RNAs from CD138-positive bone marrow cells of patients with MM were used for analysis. The t(4;14)-positive samples were assessed by FISH assay on whole bone marrow or CD138-enriched cells. Seven bladder, eight colon, and eight esophagus cancer and normal tissue control RNA samples were obtained anonymously from the Tissue Procurement Core Facility and Tumor Bank of Washington University in St. Louis, St. Louis, Missouri, USA.
Gene expression analysis.
We analyzed the Multiple Myeloma Research Consortium data set (GSE26760) of gene expression profiles of 239 patients with Affymetrix U133Plus2 platform, including 53 cases of 11q13, 25 cases of 4p16, 4 cases of 6p21, 77 cases of cyclin D1, 39 cases of cyclin D2, 13 cases of D1+D2, 15 cases of MAF, and 13 cases defined as “None” (which refers to cases that did not fall into the 7 defined expression groups). The raw data were preprocessed by robust multichip average normalization, and the analysis was conducted using Bioconductor 2.8 under R 2.11. Using significance analysis of microarrays, we performed a one-to-one comparison between 4p16 (WHSC1) and the other 5 major subtypes (D1, D1+D2, D2, 11q13, and MAF [6p21 and None were excluded due to the small sample sizes]), with a cutoff false discovery rate q value of less than 0.1. The resulting 5 lists (see Supplemental Table 4) were further intersected to find the genes consistently upregulated (or downregulated) specifically to WHSC1 subtype. Hypergeometric tests were performed using the Kyoto Encyclopedia of Genes and Genomes database. The data set was updated to 304 samples on May 23, 2011.
Tiling array design and hybridization.
Custom arrays with 12 identical sections were manufactured by NimbleGen. Each section contained 60-bp probes spanning the entire region of chromosome 4, from 1.642 Mb to 2.072 Mb, including both forward and reverse strands. Ten housekeeping genes covered by ten probes each served as controls. Every experimental and housekeeping probe was used in quadruplicate as an additional control. Five μg of total cellular RNAs were polyadenylated using Plus Module 10 Assay (Genisphere) according to the manufacturer’s protocol. Double-stranded cDNA was created using the SuperScript Double-Stranded cDNA Synthesis Kit (Invitrogen). cDNA was then labeled with a DNA Labeling Kit (NimbleGen) and subsequently hybridized to a NimbleGen array using the NimbleGen Hybridization System. Data were analyzed using Partek Genomics Suite software. The overall expression profile of the region of interest was generated from the median values of the raw expression values of the quadruplicate tiling probes. Tiling array data have been deposited into NCBI GEO (GSE36685; http://www.ncbi.nlm.nih.gov/geo/query/acc.cgi?token=lhmpnoycusyqytq&acc=GSE36685).
RNA secondary structure prediction.
RNA secondary structure was predicted using the Vienna RNA package (version 2.0.0, Theoretical Biochemistry Group), based on the minimum free energy algorithm of Zuker and Stiegler (33).
Plasmid constructs and virus production.
The coding region of ACA11 was amplified from human genomic DNA and subcloned to pBluescript II KS (+) vector (Stratagene) (pBS-ACA11) or lentiviral vector FCY-si. Lentivirus (FCY-ACA11-YFP) was generated by recombination as described in the Supplemental Methods.
RT-PCR and qRT-PCR.
Total RNAs were extracted using TRIzol (Invitrogen) reagent, and small RNAs were isolated using a mirVana miRNA Isolation Kit (Ambion) and treated with RNase-free DNase I (Invitrogen) according to the manufacturer’s protocol. RT-PCR was performed according to the protocol of the SuperScript One-Step RT-PCR with Platinum Taq Kit (Invitrogen). qRT-PCR was performed using the iScript One-Step RT-PCR Kit with SYBR Green (Bio-Rad) or custom TaqMan small RNA assays (Applied Biosystems) for quantification of snoRNAs on the Miniopticon system (Bio-Rad) following the manufacturer’s protocol. GAPDH, UBC, YWHAZ, U6, U44, and U48 were used as reference genes. Quantitative data were analyzed using Qbaseplus software (Biogazelle). Each assay was performed in triplicate. Primer sequences are provided in Supplemental Table 6.
Northern blot.
Total RNA was denatured, fractionated by electrophoresis, transferred to a nylon membrane (Amersham), and fixed by UV cross-linking. The RNA blots were hybridized to 32P-labeled probes specific for ACA11 as previously described (34) or the biotin-labeled probes using the BrightStar BioDetect Kit (Ambion) according to the manufacturer’s protocol. The antisense biotin-labeled RNA probe was synthesized by in vitro transcription with T7 RNA polymerase (MAXIscript Kit, Ambion).
FISH and immunofluorescence.
FISH assay was performed according to the protocol of R. Singer ( http://singerlab.org/protocols). Fluorescein-labeled (Roche) or cyanine-labeled (PerkinElmer) RNA probes were used. p80-coilin was detected with monoclonal mouse anti-coilin and rhodamine-conjugated anti-mouse antibody (Abcam). Cell nuclei were visualized with DAPI. Images were acquired on a confocal microscope (Olympus, FV1000).
RNA EMSA and RNA affinity chromatography.
We performed RNA EMSA and RNA affinity chromatography as described in the Supplemental Methods. Briefly, the 3′ end biotinylated sense RNA was incubated with native nuclear protein extracts and the EMSA binding buffer. The RNA-protein complexes were subjected to a nondenaturing polyacrylamide gel for EMSA analysis or purified using the high-capacity streptavidin agarose resin (Pierce), followed by resolving on a SDS-PAGE gel for further MS analysis.
MS.
Electrospray-linear ion trap and Fourier transform ion cyclotron MS (LTQ FT, Thermo-Finnigan) was performed as described previously (35). Database searching was performed using a UniProt database selected for Homo sapiens (downloaded on 12/6/2010, 97,048 entries). Scaffold (Proteome Software Inc.) was used to validate MS/MS-based peptide and protein identifications. Peptide and protein identifications were accepted if they could be established at greater than 95.0% probability as specified by the Peptide Prophet algorithm (36, 37). Molecular network analysis was performed using the IPA software (Ingenuity Systems).
Immunoprecipitation and Western blot.
Immunoprecipitation and Western blot were performed as described previously (38). Antibodies are described in the Supplemental Methods.
Cross-linking ribonucleoprotein immunoprecipitation and RNA sequencing.
CLIP was performed as described previously (39). The isolated RNA fragments were ligated to Illumina adaptors, followed by RT and PCR amplification. The prepared libraries were sequenced on the Illumina HiSeq 2000 platform. The model-based analysis for ChIP-Seq (MACS) algorithm was used for analysis. Detailed procedures are described in the Supplemental Methods.
ROS detection.
2′,7′-dichlorofluorescein diacetate (DCFH-DA, Sigma-Aldrich) was used to measure ROS generation. Fluorescence intensity was quantified using a microplate fluorometer (BioTek) or flow cytometry (BD) as described previously (28).
snoRNA knockdown.
Chemically modified ASOs were used for knockdown experiments, as described in the Supplemental Methods. ASOs targeting GFP served as a control.
Cell growth, cell volume, cell mass, and proliferation assays.
Cell growth curves were performed during 6 days of culture. Cell mass was measured by Bradford assay (Bio-Rad), and cell volume was measured as described previously (25). Cell proliferation was detected using the Cell Proliferation ELISA BrdU (colorimetric) Kit (Roche) according to the manufacturer’s instructions or the MTT assay (Sigma-Aldrich).
Chemotherapy resistance assays.
Cells were incubated with different doses of doxorubicin (Sigma-Aldrich) at the indicated concentrations (see Figure 8, E and K) or 50 μg/ml 5-fluorouracil (Sigma-Aldrich). Cellular viability was assessed by MTT assay after 44 hours of incubation or trypan blue exclusion assay. Experiments were repeated 3 times.
Statistics.
Data are shown as mean ± SD unless noted otherwise. Two-tailed unpaired Student’s t test and 1-way ANOVA with a Bonferroni post-hoc test were carried out using Prism (GraphPad Software). P < 0.05 was considered significant.
Study approval.
Studies with human samples were approved by the human research protection office at Washington University in St. Louis, and informed consent from the patients was obtained in accordance with the Declaration of Helsinki. Animal studies were approved by the Animal Study Committee at Washington University in St. Louis.
Supplementary Material
Acknowledgments
We thank Michael Heinz, Paul Cliften, and the Genome Technology Access Center (GTAC) in the Department of Genetics for help with genomic analysis and Shashi Kulkarni and members of his laboratory for assistance with RNA FISH. We thank Michael Kuchenreuther for technical assistance. Mark Fiala coordinated the myeloma tissue sample bank at Washington University. The authors wish to thank Kathy Weilbaecher, John Dipersio, and Jason Weber for helpful discussions. This work was funded by the Multiple Myeloma Research Foundation (to M.H. Tomasson), the Barnes-Jewish Hospital Foundation (to M.H. Tomasson), and a NMRC Clinician Scientist Award (to W.J. Chng). GTAC is partially supported by NCI Cancer Center support grant P30 CA91842 to the Siteman Cancer Center and by ICTS/CTSA grant UL1RR024992 from the National Center for Research Resources, a component of the NIH. We would especially like to thank our patients.
Footnotes
Conflict of interest: The authors have declared that no conflict of interest exists.
Citation for this article: J Clin Invest. 2012;122(8):2793–2806. doi:10.1172/JCI63051.
See the related Commentary beginning on page 2765.
References
- 1.Palumbo A, Anderson K. Multiple myeloma. N Engl J Med. 2011;364(11):1046–1060. doi: 10.1056/NEJMra1011442. [DOI] [PubMed] [Google Scholar]
- 2.Richelda R, et al. A novel chromosomal translocation t(4; 14)(p16.3; q32) in multiple myeloma involves the fibroblast growth-factor receptor 3 gene. Blood. 1997;90(10):4062–4070. [PubMed] [Google Scholar]
- 3.Chesi M, et al. Frequent translocation t(4;14)(p16.3;q32.3) in multiple myeloma is associated with increased expression and activating mutations of fibroblast growth factor receptor 3. Nat Genet. 1997;16(3):260–264. doi: 10.1038/ng0797-260. [DOI] [PMC free article] [PubMed] [Google Scholar]
- 4.Winkler JM, Greipp P, Fonseca R. t(4;14)(p16.3;q32) is strongly associated with a shorter survival in myeloma patients. Br J Haematol. 2003;120(1):170–171. doi: 10.1046/j.1365-2141.2003.03983_5.x. [DOI] [PubMed] [Google Scholar]
- 5.Karlin L, et al. Clinical and biological features of t(4;14) multiple myeloma: a prospective study. Leuk Lymphoma. 2011;52(2):238–246. doi: 10.3109/10428194.2010.537795. [DOI] [PubMed] [Google Scholar]
- 6.Chesi M, Nardini E, Lim RS, Smith KD, Kuehl WM, Bergsagel PL. The t(4;14) translocation in myeloma dysregulates both FGFR3 and a novel gene, MMSET, resulting in IgH/MMSET hybrid transcripts. Blood. 1998;92(9):3025–3034. [PubMed] [Google Scholar]
- 7.Garlisi CG, et al. A unique mRNA initiated within a middle intron of WHSC1/MMSET encodes a DNA binding protein that suppresses human IL-5 transcription. Am J Respir Cell Mol Biol. 2001;24(1):90–98. doi: 10.1165/ajrcmb.24.1.4224. [DOI] [PubMed] [Google Scholar]
- 8.Marango J, et al. The MMSET protein is a histone methyltransferase with characteristics of a transcriptional corepressor. Blood. 2008;111(6):3145–3154. doi: 10.1182/blood-2007-06-092122. [DOI] [PMC free article] [PubMed] [Google Scholar]
- 9.Pei H, et al. MMSET regulates histone H4K20 methylation and 53BP1 accumulation at DNA damage sites. Nature. 2011;470(7332):124–128. doi: 10.1038/nature09658. [DOI] [PMC free article] [PubMed] [Google Scholar]
- 10.Martinez-Garcia E, et al. The MMSET histone methyl transferase switches global histone methylation and alters gene expression in t(4;14) multiple myeloma cells. Blood. 2011;117(1):211–220. doi: 10.1182/blood-2010-07-298349. [DOI] [PMC free article] [PubMed] [Google Scholar]
- 11.Nimura K, et al. A histone H3 lysine 36 trimethyltransferase links Nkx2-5 to Wolf-Hirschhorn syndrome. Nature. 2009;460(7252):287–291. doi: 10.1038/nature08086. [DOI] [PubMed] [Google Scholar]
- 12.Kim JY, et al. Multiple-myeloma-related WHSC1/MMSET isoform RE-IIBP is a histone methyltransferase with transcriptional repression activity. Mol Cell Biol. 2008;28(6):2023–2034. doi: 10.1128/MCB.02130-07. [DOI] [PMC free article] [PubMed] [Google Scholar]
- 13.Hajdu I, Ciccia A, Lewis SM, Elledge SJ. Wolf-Hirschhorn syndrome candidate 1 is involved in the cellular response to DNA damage. Proc Natl Acad Sci U S A. 2011;108(32):13130–13134. doi: 10.1073/pnas.1110081108. [DOI] [PMC free article] [PubMed] [Google Scholar]
- 14.Hudlebusch HR, et al. The histone methyltransferase and putative oncoprotein MMSET is overexpressed in a large variety of human tumors. Clin Cancer Res. 2011;17(9):2919–2933. doi: 10.1158/1078-0432.CCR-10-1302. [DOI] [PubMed] [Google Scholar]
- 15.Hudlebusch HR, et al. MMSET is highly expressed and associated with aggressiveness in neuroblastoma. Cancer Res. 2011;71(12):4226–4235. doi: 10.1158/0008-5472.CAN-10-3810. [DOI] [PubMed] [Google Scholar]
- 16.Kassambara A, Klein B, Moreaux J. MMSET is overexpressed in cancers: link with tumor aggressiveness. Biochem Biophys Res Commun. 2009;379(4):840–845. doi: 10.1016/j.bbrc.2008.12.093. [DOI] [PubMed] [Google Scholar]
- 17.Wang GG, Cai L, Pasillas MP, Kamps MP. NUP98-NSD1 links H3K36 methylation to Hox-A gene activation and leukaemogenesis. Nat Cell Biol. 2007;9(7):804–812. doi: 10.1038/ncb1608. [DOI] [PubMed] [Google Scholar]
- 18.Kuo AJ, et al. NSD2 links dimethylation of histone H3 at lysine 36 to oncogenic programming. Mol Cell. 2011;44(4):609–620. doi: 10.1016/j.molcel.2011.08.042. [DOI] [PMC free article] [PubMed] [Google Scholar]
- 19.Toyokawa G, et al. Histone lysine methyltransferase Wolf-Hirschhorn syndrome candidate 1 is involved in human carcinogenesis through regulation of the Wnt pathway. Neoplasia. 2011;13(10):887–898. doi: 10.1593/neo.11048. [DOI] [PMC free article] [PubMed] [Google Scholar]
- 20.Lauring J, et al. The multiple myeloma associated MMSET gene contributes to cellular adhesion, clonogenic growth, and tumorigenicity. Blood. 2008;111(2):856–864. doi: 10.1182/blood-2007-05-088674. [DOI] [PMC free article] [PubMed] [Google Scholar]
- 21.Keats JJ, et al. Overexpression of transcripts originating from the MMSET locus characterizes all t(4;14)(p16;q32)-positive multiple myeloma patients. Blood. 2005;105(10):4060–4069. doi: 10.1182/blood-2004-09-3704. [DOI] [PMC free article] [PubMed] [Google Scholar]
- 22.Serrano M, Lee H, Chin L, Cordon-Cardo C, Beach D, DePinho RA. Role of the INK4a locus in tumor suppression and cell mortality. Cell. 1996;85(1):27–37. doi: 10.1016/S0092-8674(00)81079-X. [DOI] [PubMed] [Google Scholar]
- 23.Weber MJ. Mammalian small nucleolar RNAs are mobile genetic elements. PLoS Genet. 2006;2(12):e205. doi: 10.1371/journal.pgen.0020205. [DOI] [PMC free article] [PubMed] [Google Scholar]
- 24.Kiss T, Fayet E, Jady BE, Richard P, Weber M. Biogenesis and intranuclear trafficking of human box C/D and H/ACA RNPs. Cold Spring Harb Symp Quant Biol. 2006;71:407–417. doi: 10.1101/sqb.2006.71.025. [DOI] [PubMed] [Google Scholar]
- 25.Maggi LB, Jr, et al. Nucleophosmin serves as a rate-limiting nuclear export chaperone for the Mammalian ribosome. Mol Cell Biol. 2008;28(23):7050–7065. doi: 10.1128/MCB.01548-07. [DOI] [PMC free article] [PubMed] [Google Scholar]
- 26.Kiss T, Fayet-Lebaron E, Jady BE. Box H/ACA small ribonucleoproteins. Mol Cell. 2010;37(5):597–606. doi: 10.1016/j.molcel.2010.01.032. [DOI] [PubMed] [Google Scholar]
- 27.Kiss AM, Jady BE, Bertrand E, Kiss T. Human box H/ACA pseudouridylation guide RNA machinery. Mol Cell Biol. 2004;24(13):5797–5807. doi: 10.1128/MCB.24.13.5797-5807.2004. [DOI] [PMC free article] [PubMed] [Google Scholar]
- 28.Michel CI, et al. Small nucleolar RNAs U32a, U33, and U35a are critical mediators of metabolic stress. Cell Metab. 2011;14(1):33–44. doi: 10.1016/j.cmet.2011.04.009. [DOI] [PMC free article] [PubMed] [Google Scholar]
- 29.Dring AM, et al. A global expression-based analysis of the consequences of the t(4;14) translocation in myeloma. Clin Cancer Res. 2004;10(17):5692–5701. doi: 10.1158/1078-0432.CCR-04-0467. [DOI] [PubMed] [Google Scholar]
- 30.Chapman MA, et al. Initial genome sequencing and analysis of multiple myeloma. Nature. 2011;471(7339):467–472. doi: 10.1038/nature09837. [DOI] [PMC free article] [PubMed] [Google Scholar]
- 31.Chng WJ, et al. Molecular dissection of hyperdiploid multiple myeloma by gene expression profiling. Cancer Res. 2007;67(7):2982–2989. doi: 10.1158/0008-5472.CAN-06-4046. [DOI] [PubMed] [Google Scholar]
- 32.Mateescu B, et al. miR-141 and miR-200a act on ovarian tumorigenesis by controlling oxidative stress response. Nat Med. 2011;17(12):1627–1635. doi: 10.1038/nm.2512. [DOI] [PubMed] [Google Scholar]
- 33.Zuker M, Stiegler P. Optimal computer folding of large RNA sequences using thermodynamics and auxiliary information. Nucleic Acids Res. 1981;9(1):133–148. doi: 10.1093/nar/9.1.133. [DOI] [PMC free article] [PubMed] [Google Scholar]
- 34.Yu Y, et al. Nucleophosmin is essential for ribosomal protein L5 nuclear export. Mol Cell Biol. 2006;26(10):3798–3809. doi: 10.1128/MCB.26.10.3798-3809.2006. [DOI] [PMC free article] [PubMed] [Google Scholar]
- 35.Mendelsohn BA, Malone JP, Townsend RR, Gitlin JD. Proteomic analysis of anoxia tolerance in the developing zebrafish embryo. Comp Biochem Physiol Part D Genomics Proteomics. 2009;4(1):21–31. doi: 10.1016/j.cbd.2008.09.003. [DOI] [PMC free article] [PubMed] [Google Scholar]
- 36.Keller A, Nesvizhskii AI, Kolker E, Aebersold R. Empirical statistical model to estimate the accuracy of peptide identifications made by MS/MS and database search. Anal Chem. 2002;74(20):5383–5392. doi: 10.1021/ac025747h. [DOI] [PubMed] [Google Scholar]
- 37.Nesvizhskii AI, Keller A, Kolker E, Aebersold R. A statistical model for identifying proteins by tandem mass spectrometry. Anal Chem. 2003;75(17):4646–4658. doi: 10.1021/ac0341261. [DOI] [PubMed] [Google Scholar]
- 38.Xiang Z, Kreisel F, Cain J, Colson A, Tomasson MH. Neoplasia driven by mutant c-KIT is mediated by intracellular, not plasma membrane, receptor signaling. Mol Cell Biol. 2007;27(1):267–282. doi: 10.1128/MCB.01153-06. [DOI] [PMC free article] [PubMed] [Google Scholar]
- 39.Niranjanakumari S, Lasda E, Brazas R, Garcia-Blanco MA. Reversible cross-linking combined with immunoprecipitation to study RNA-protein interactions in vivo. Methods. 2002;26(2):182–190. doi: 10.1016/S1046-2023(02)00021-X. [DOI] [PubMed] [Google Scholar]
Associated Data
This section collects any data citations, data availability statements, or supplementary materials included in this article.


