

Abstract
MicroRNA-122 (miR-122), which accounts for 70% of the liver’s total miRNAs, plays a pivotal role in the liver. However, its intrinsic physiological roles remain largely undetermined. We demonstrated that mice lacking the gene encoding miR-122a (Mir122a) are viable but develop temporally controlled steatohepatitis, fibrosis, and hepatocellular carcinoma (HCC). These mice exhibited a striking disparity in HCC incidence based on sex, with a male-to-female ratio of 3.9:1, which recapitulates the disease incidence in humans. Impaired expression of microsomal triglyceride transfer protein (MTTP) contributed to steatosis, which was reversed by in vivo restoration of Mttp expression. We found that hepatic fibrosis onset can be partially attributed to the action of a miR-122a target, the Klf6 transcript. In addition, Mir122a–/– livers exhibited disruptions in a range of pathways, many of which closely resemble the disruptions found in human HCC. Importantly, the reexpression of miR-122a reduced disease manifestation and tumor incidence in Mir122a–/– mice. This study demonstrates that mice with a targeted deletion of the Mir122a gene possess several key phenotypes of human liver diseases, which provides a rationale for the development of a unique therapy for the treatment of chronic liver disease and HCC.
Introduction
A growing body of evidence suggests that the spatial and temporal specificities of microRNAs (miRNAs) are important for tissue specification and cell lineage decisions (1–3). MicroRNA 122 (miR-122) is a dominant hepatocyte-specific miRNA (1, 4). There is a plethora of studies using in vivo gene silencing, in vitro experimentation, and transcriptome profiling that demonstrate how miR-122 regulates networks of genes that control lipid metabolism (5, 6), cell differentiation (7), hepatic circadian regulation (8), HCV replication (9), and systemic iron homeostasis (10). Moreover, pathogenic repression of miR-122 has been observed in nonalcoholic steatohepatitis (11), liver cirrhosis (12), and hepatocellular carcinoma (HCC) (12–16). While much is known about the broad effects of miR-122 in the adult liver, the intrinsic roles of miR-122 in liver physiology have not been formally addressed.
The consequences of miRNA loss in adult livers was recently investigated using a conditional knockout mouse model that has specific disruption of Dicer1 in hepatocytes (Albumin-Cre;Dicer1loxp/loxp mice; Dicer1-KO mice) (17, 18). These mice display a phenotype different from that of mice that are administered antisense miR-122a oligomers. Specifically, mice with Dicer1-deficient livers have steatosis, inflammation, and hepatocyte apoptosis. Importantly, hepatocarcinogenesis following hepatocyte apoptosis and regeneration was observed in one study (18). Taken together, these studies demonstrate pivotal roles for the endogenous miRNAs found in the liver and support the importance of miR-122 in hepatocyte survival and tumor suppression. However, because multiple miRNAs were affected, it is difficult to confirm the specific roles that each individual miRNA plays in the Dicer1-deficient liver. Therefore, the unique impact of miR-122a repression in the Dicer1-deficient liver remains undetermined.
To elucidate the physiological roles of miR-122a in the liver, we generated a mutant mouse that has a germline deletion of Mir122a. Our findings demonstrate that miR-122a is critical for the regulation of liver metabolism and hepatocyte differentiation. Spontaneous HCC developed in these mutant mice at a high frequency. Previously, we have explored the tumor suppressor functions of miR-122 in two xenograft models (15). Our current findings unequivocally confirm that Mir122a is an intrinsic tumor suppressor gene within the liver.
Results
A Mir122a homozygous mutant mouse strain displays features of steatohepatitis and fibrosis.
To explore the intrinsic roles of miR-122 in the liver, we generated a mutant mouse strain with a germline deletion of Mir122a using homologous recombination (ref. 19 and Supplemental Figure 1; supplemental material available online with this article; doi: 10.1172/JCI63455DS1). Mice carrying this Mir122a homozygous deletion (hereafter referred to as Mir122a–/– mice) were born at the expected Mendelian frequency. All Mir122a–/– mice were fertile and otherwise indistinguishable from their WT and heterozygous littermates. The presence of a somatic deletion of Mir122a led to significant reductions in serum cholesterol and triglyceride (TG) levels, but the levels of alkaline phosphatase (ALP) and alanine transaminase (ALT) were higher than those of WT mice (Figure 1A). The fact that Mir122a–/– mice showed reduced serum cholesterol and TG levels is in agreement with previous reports studying mice that were administered miR-122a antisense oligomers (5, 6). However, the reduction in serum cholesterol and TG levels was much greater in the Mir122a–/– mice than in the mice administered antisense oligomers. Histological examination of the livers of Mir122a–/– mice revealed extensive lipid accumulation and reduced glycogen storage (Figure 1B), as well as inflammation and fibrosis, compared with WT controls. A strong positive reaction to the anti-F4/80 antibody, which is specific for mouse macrophages and monocytes, was detected in the Mir122a–/– livers (Figure 1, C and D). Portal fibrosis that was due to the activation of hepatic stellate cells (HSCs) was also detected in the Mir122a–/– livers by staining with Sirius red and an anti-desmin antibody (Figure 1, C and F). Portal fibrosis was accompanied by elevated expression of two important fibrogenic factors, Tgfb1 (20) and Ctgf (ref. 21 and Figure 1E).
Figure 1. Pathophysiological features of Mir122a–/– mice.

(A) Total serum cholesterol, fasting TG, ALP, and ALT levels were measured enzymatically on a DRI-CHEM 3500S autoanalyzer (Fujifilm). n = 20 mice per group. White bars, Mir122a+/+; gray bars, Mir122a–/–. (B) Mir122a–/– livers exhibited progressive accumulation of lipid (oil red O) and reduced glycogen storage (PAS). n = 6. (C) The progressive increase in the number of Kupffer cells (F4/80 antibody) and the activation of HSCs near the portal regions (Sirius red staining and anti-desmin antibody) in Mir122a–/– livers. Scale bars: 100 μm, 50 μm (insets), and 20 μm (insets, desmin). n = 6. (D) The number of Kupffer cells (anti-F4/80) per high-power field (×200). n = 10. (E) RT-qPCR results for 2 markers of fibrosis (Ctgf and Tgfb1). n = 8 per group. (F) Western blot analysis of desmin expression. The results shown are representative of 5 independent experiments. *P < 0.05, †P < 0.01, §P < 0.001.
Liver steatosis in Mir122a–/– mice is typified by a downregulation of lipid metabolism and VLDL secretion.
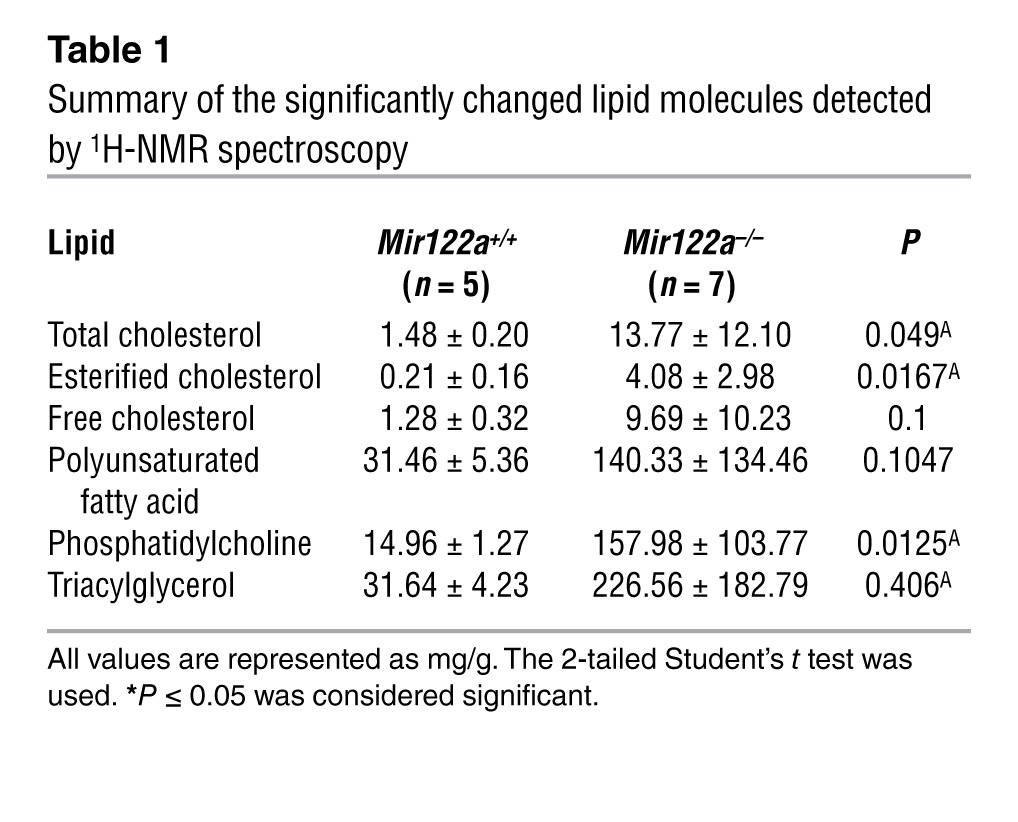
The coincidence of liver steatosis and low serum TG and cholesterol levels in the Mir122a–/– mice warranted an in-depth analysis of hepatic lipid metabolism in these mice. The levels of serum HDL and VLDL were significantly reduced in the Mir122a–/– mice (Figure 2A), and these events were accompanied by lower levels of serum apoB-100 and apoE (Figure 2B). We analyzed the expression of various genes involved in lipid metabolism using reverse transcription quantitative PCR (RT-qPCR), and we also used lipid profiling to measure the levels of various lipid metabolites. Consistent with previous findings (5, 6), we observed a general downward trend in the expression of genes involved in lipogenesis, fatty acid oxidation, bile acid metabolism, lipid transport, and transcriptional regulation of lipid homeostasis in the Mir122a–/– mice, compared with WT mice (Figure 2C). Notably, the expression of MTTP (microsomal TG transfer protein) was significantly reduced at both the mRNA and protein levels (Figure 2, C and D). Lipid profiling by 1H-NMR spectroscopy (22) was performed to determine whether there were any differences in the lipid metabolite profile of the Mir122a–/– mice. We confirmed the presence of liver steatosis in the Mir122a–/– livers based on the significantly increased amount of cholesterol (identified by the signal intensity of H-18 at 0.68 ppm), TG (identified by the signal intensities of the C-1 and C-3 protons of the TG glycerol skeleton), and phosphatidylcholine (Figure 2E, Table 1, and Supplemental Table 1). Hepatic VLDL assembly and secretion are dependent on the presence of sufficient amounts of apoB-100, MTTP, and various lipids (23, 24). We speculate that repressed expression of MTTP could contribute to the disturbances in the lipid profile that we detected in the Mir122a–/– mice.
Figure 2. Analysis of lipid metabolism.

(A) Serum levels of lipoproteins. C, control: normal human serum; KO, Mir122a–/– mice. (B) Western blot analysis of the serum apoproteins. (C) RT-qPCR analysis of the genes involved in lipid metabolism. n = 5. *P < 0.05, †P < 0.01, §P < 0.001. (D) Western blot analysis of hepatic proteins. This blot is representative of 3 independent experiments. Values represent the relative levels of protein expression between Mir122a–/– and WT. (E) 1H-NMR spectra of hepatic lipid contents. 1H-NMR spectra of lipid extracts from liver of WT and Mir122a–/– mice (Mir122a-KO). Identified peaks: 1: total cholesterol C-18, CH3; 2: total cholesterol C-26, CH3/C-27, CH3; 3: fatty acyl chain CH3(CH2)n; 4: total cholesterol C-21, CH3; 5: free cholesterol C-19, CH3; 6: esterified cholesterol C-19, CH3; 7: multiple cholesterol protons; 8: fatty acyl chain (CH2)n; 9: multiple cholesterol protons; 10: fatty acyl chain -CH2CH2CO; 11: multiple cholesterol protons; 12: fatty acyl chain -CH2CH=; 13: fatty acyl chain -CH2CO; 14: fatty acyl chain =CHCH2CH=; 15: sphingomyelin and choline N(CH3)3; 16: free cholesterol C-3, CH; 17: phosphatidylcholine N-CH2; 18: glycerophospholipid backbone C-3, CH2; 19: glycerol backbone C-1, CH2; 20: glycerol backbone C-3, CH2; 21: phosphatidylcholine PO-CH2; 22: esterified cholesterol C-3, CH; 23: glycerolphospholipid backbone C-2, CH; 24: fatty acyl chain -HC=CH-.
Table 1.
Summary of the significantly changed lipid molecules detected by 1H-NMR spectroscopy
The progression of liver diseases in the Mir122a–/– mice is reversible.
We next investigated whether restoration of Mttp or reexpression of miR-122a could reverse liver pathology. A month-long regimen of hydrodynamic injection (25) was used to achieve a sustained level of MTTP or miR-122a expression in the Mir122a–/– mice. The injection of Mttp in Mir122a–/– mice resulted in an increase in MTTP expression at both the mRNA and the protein levels (Figure 3, A and D). Mttp injection also resulted in an increase in serum VLDL levels (Figure 3B), as well as in the normalization of the cholesterol and fasting TG serum levels (Figure 3C). The MTTP-restored livers displayed reduced hepatic steatosis, inflammation, and fibrosis (Figure 3D). In contrast to the specific changes induced by Mttp restoration, the restoration of miR-122a (Supplemental Figure 2B) changed a broader spectrum of biological activities, including all of the improvements in liver function achieved by Mttp restoration (Figure 3, E and F), as well as an elevation of glycogen storage (Figure 3F) and increased expression of a range of genes involved in lipid metabolism (Acyl, Fasn, Pklr, and Mttp) (Figure 3G). The restoration of miR-122a also conferred antifibrotic potential, because significantly fewer HSCs were activated, and the expression of 3 fibrogenic factors (Ctgf, Klf6, ref. 26; and Tgfb) was reduced (Figure 3, F and G). The pattern of low serum TG and high hepatic TG levels found in Mir122a–/– mice seems to indicate impaired MTTP expression and VLDL assembly (23, 24). This pattern is commonly found in patients infected with HCV genotype 3 (27) and in fatty liver Shionogi (FLS) mice (28). Similar to FLS mice, Mir122a–/– mice also have a slight impairment of glucose tolerance, although serum glucose levels were not significantly affected (Supplemental Figure 3B). We also observed a reduction in the expression of hepatic glycogen synthase (GYS2), which partially explains the inadequate glycogen accumulation (Supplemental Figure 3, A and C). Although short-term inhibition of miR-122a using an antisense approach has been shown to improve liver steatosis in mice fed a high-fat diet (6), our results reveal a close association between a long-term deficiency in miR-122a and certain metabolic diseases.
Figure 3. Liver damage in Mir122a–/– mice is reversible.

(A) In vivo delivery of Mttp increased expression at both the mRNA and protein levels as shown by Western blotting (left) and RT-qPCR (right), respectively. Restoration of Mttp results in the return of the serum levels of lipoproteins (B), cholesterol, and TG (C) to WT levels and in the reduction of fatty accumulation, inflammation (F4/80 IHC), and collagen deposition (D). White bars, WT-pCMV6-Neo; black bars, KO-pCMV6-Neo; gray bars, KO-Mttp (pCMV6-Mttp). n = 5. Scale bars: 100 μm and 50 μm (insets). (E) Restoration of miR-122a at day 14 leads to the return of serum cholesterol, TG, and ALP to WT levels. White bars, WT-HA; black bars, KO-HA; gray bars, KO-122. n = 5. (F) Restoration of miR-122a at 1 month leads to a drastic reduction in fatty accumulation, collagen deposition, activation of HSCs (anti-desmin), and a moderate increase in glycogen storage. Scale bars: 100 μm and 20 μm (insets). n = 5. (G) Left: RT-qPCR assay of lipid metabolism genes. n = 3. Right: RT-qPCR assay of markers of fibrosis. White bars, WT-HA; black bars, KO-HA; gray bars, KO-122. n = 6. *P < 0.05, †P < 0.01, §P < 0.001 for KO-vehicle versus WT-vehicle mice; #P < 0.05, ‡P < 0.01, ¶P < 0.001 for KO-gene versus KO-vehicle mice.
Mir122a deletion promotes the epithelial-mesenchymal transition and spontaneous HCC formation.
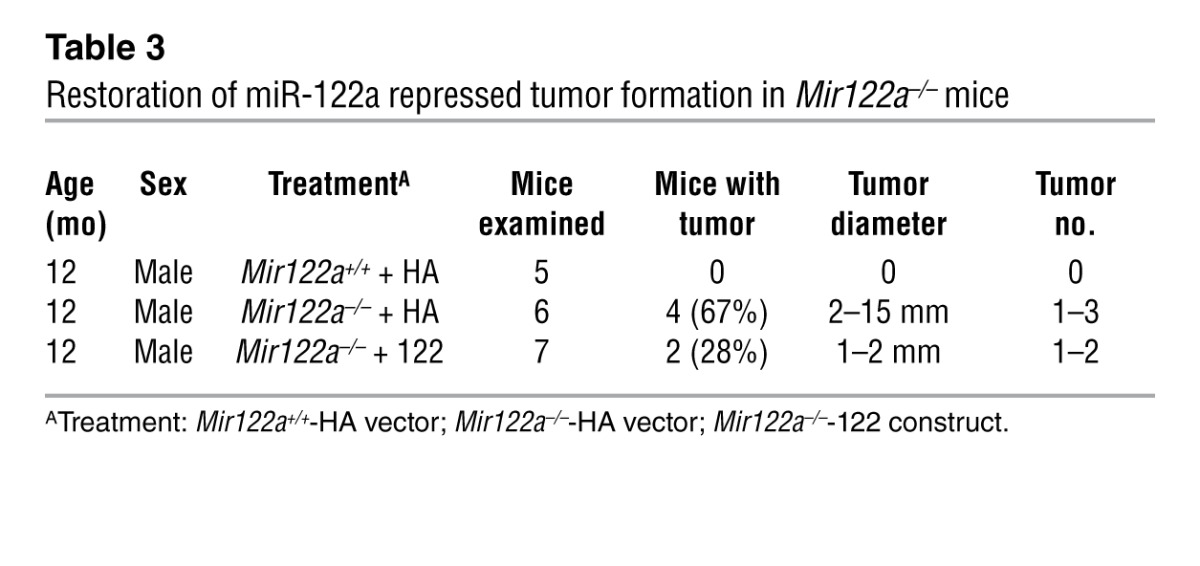
Recent data have suggested that the repression of miR-122 correlates with clinically relevant parameters of HCC, and this miRNA could potentially play a crucial role in hepatocarcinogenesis (12–16). Therefore, we investigated whether Mir122a deletion can lead to spontaneous liver tumors. Indeed, liver lesions and spontaneous HCC developed in Mir122a–/– mice. Interestingly, a striking sex disparity in HCC occurrence was observed in the Mir122a–/– mice. The male-to-female incidence ratio was 3.9:1 (Table 2), which recapitulates the observed HCC incidence in humans (29). An increased serum IL-6 level was detected in tumor-bearing mice of both sexes (Supplemental Figure 4, C and D), which prevented us from testing the hypothesis that higher serum IL-6 is as an independent risk factor for HCC development in females (30, 31). Other sex-dependent mechanisms may account for the sex disparity of HCC observed in Mir122a–/– mice. Spontaneous tumors in the early stages of growth appeared as solitary events. The tumors were round-shaped, with smoothly demarcated edges and a uniform cellular morphology that resembled a well-differentiated liver tumor (Figure 4A, 11 months). However, older mice presented with multiple large tumors with edges that displayed an invasive appearance (Figure 4A, 14 months). Advanced tumors displayed marked cell pleomorphisms, including occasional giant cells and fatty droplets, a phenotype resembling that of poorly differentiated HCC tumors in humans (Figure 4A, insets). These tumors also exhibited rapid proliferation (Figure 4A, anti-PCNA) and expressed elevated levels of various oncofetal genes, including Afp, Igf2 (32), and Src, as well as tumor-initiating cell markers such as Prom1 (33), Thy1 (34), and Epcam (ref. 35 and Figure 4B). Similar to human HCC cells (36), the Mir122a–/– tumor cells had molecular alterations that were consistent with epithelial-mesenchymal transition (EMT), including loss of E-cadherin and upregulation of vimentin (Figure 5, A–C). To establish the timing of hepatocarcinogenesis in the Mir122a–/– mice, we restored miR-122a levels by hydrodynamic injection of miR-122a in 3-month-old Mir122a–/– mice. The continuous reexpression of miR-122a effectively impaired hepatocarcinogenesis and tumor progression, and this was reflected by a reduction in tumor occurrence and size (Table 3), the presence of well-differentiated features, including smoothly demarcated edges and reduced nuclear pleomorphism (Figure 5D) and a reduction in angiogenesis (Supplemental Figure 5).
Table 2.
Summary of tumor incidence in Mir122a–/– mice
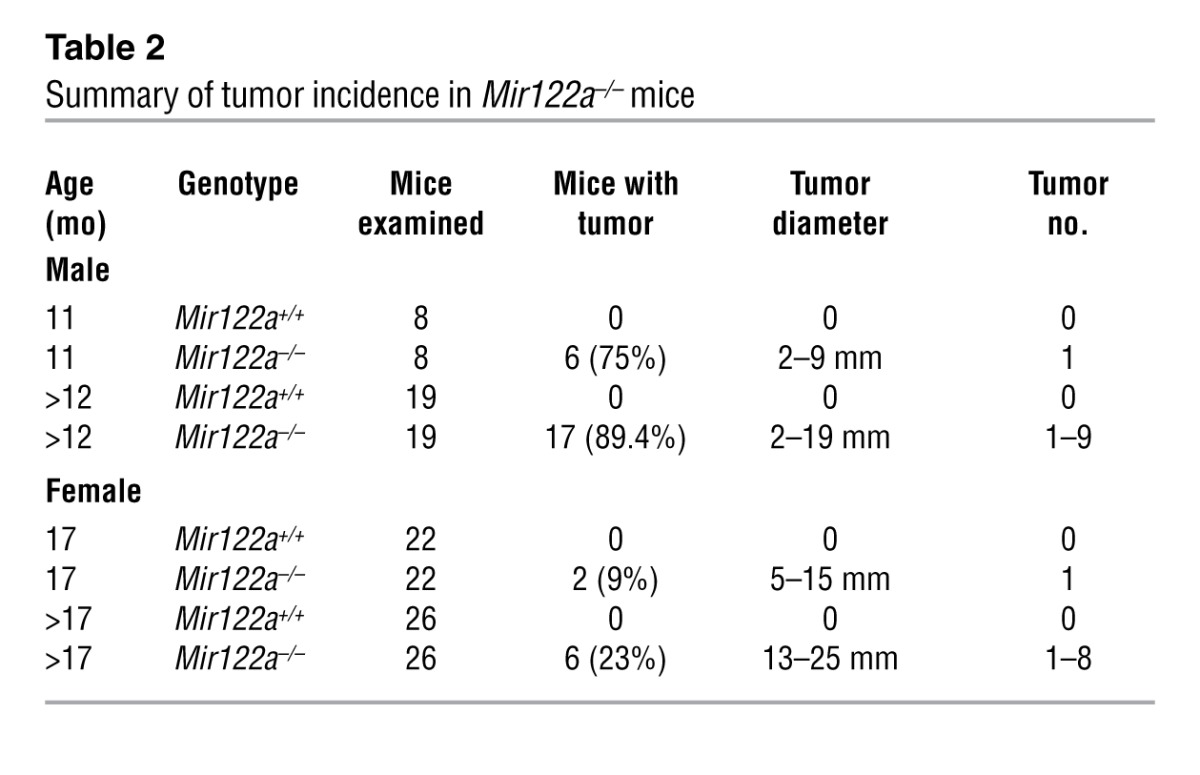
Figure 4. Spontaneous liver tumors developed in Mir122a–/– mice.

(A) A small, round-shaped, solid tumor from an 11-month-old male Mir122a–/– mouse and multiple larger tumors from 3 14-month-old male Mir122a–/– mice. Scale bars: 3 mm (front), 2 mm (H&E, original magnification, ×0.5), 100 μm (H&E, ×10; and anti-PCNA) and 50 μm (insets). The dotted lines show the edges of the normal liver area (N) and tumor area (T). The tumors display invasive edges. (B) RT-qPCR assays of 3 oncofetal genes (Afp, Igf2, Src) and 3 tumor-initiating cell markers (Prom1, Thy1, Epcam). White bars, WT; black bars, tumor-adjacent tissues; gray bars, tumor. n = 3. *P < 0.05, †P < 0.01, §P < 0.001 versus WT.
Figure 5. Deficiency of miR-122a triggers EMT.

Expression of E-cadherin is downregulated and expression of vimentin is upregulated in Mir122a–/– tumor tissue as shown by immunohistochemistry (A; n = 5; scale bars: 100 μm); by RT-qPCR assay (B; white bars, WT; black bars, tumor-adjacent tissues; gray bars, tumor; n = 3); and by Western blotting (C). A representative of 4 independent Western blotting experiments is shown. (D) Long-term reexpression of miR-122a over an 8-month duration. Left: Mir122a+/+ mice expressing HA vector; center: Mir122a–/– mice expressing HA vector; right: Mir122a–/– mice expressing miR-122 construct. Scale bars: 2 mm (H&E, ×0.5), 100 μm (H&E, ×10), and 50 μm (insets). †P < 0.01, §P < 0.001 versus WT.
Table 3.
Restoration of miR-122a repressed tumor formation in Mir122a–/– mice
The expression profile of Mir122a–/– mice accurately mimics human HCC.
We suspected that the pathogenic association between miR-122 deficiency and hepatic disease is likely multifactorial in nature. We first profiled liver tissues from 2-month-old male Mir122a–/– mice and found upregulation of 606 genes and downregulation of 280 genes (Supplemental Table 3). Gene set enrichment analysis (GSEA) (37) revealed that multiple pathways in the Kyoto Encyclopedia of Genes and Genomes (KEGG) database ( http://www.genome.jp/kegg/pathway.html) were significantly affected (Supplemental Figure 6 and Supplemental Table 4). To identify general pathway disturbances that might drive cancer initiation and progression, we performed a comprehensive gene expression analysis of livers from 2-month-old Mir122a–/– mice and tumors from Mir122a–/– mice. Notably, pathways involved in steroid biosynthesis, bile acid biosynthesis, and peroxisomes were suppressed in Mir122a–/– livers (Table 4 and Supplemental Figure 7), which substantiates the findings of earlier studies on mice that were administered miR-122 antisense oligomers (5, 6, 8, 38). Several pathways were significantly enriched, including those involved in the immune response, fibrogenesis, EMT, signal transduction, cell survival, cell death, and cancer phenotypes (Table 4 and Figure 6A). The expression array results provide a clear molecular explanation for the fibrotic phenotype observed in the Mir122a–/– mice, because liver fibrosis is associated with both TGF-β signaling and the disruption of cell-cell interactions (21, 39). In addition, the enrichment patterns observed in the curated gene sets from hepatoma patients with high versus low miR-122 levels (16) support the hypothesis that the pathway disturbances observed in the Mir122a–/– mice accurately mimic human HCC. We demonstrated a strong activation of MAPK signaling (Figure 6B), which is also present in the expression profile of KEGG Pathways in Cancer (Figure 6A and Supplemental Table 5). Moreover, we detected low PTEN expression and activation of Akt signaling (Figure 6B), also similar to levels in human HCC (40). Although there were no histological signs of precancerous lesions in samples from younger mice, the enriched pathways clearly indicate that pathway dysregulation in the liver began in young Mir122a–/– mice.
Table 4.
GSEA of liver tissues from 2-month-old male mice and the tumor tissues from 11-month- and 14-month-old male Mir122a–/– mice

Figure 6. Expression profiling of the genes in the KEGG Pathways in Cancer set.

(A) The heat map shows the 91 genes in the KEGG Pathways in Cancer that are differentially expressed in the livers of 2-month-old mice and tumor tissues from 11-month- and 14-month-old male Mir122a–/– mice (cutoff, 1.5). The heat scale of the map represents changes on a linear scale. Red and blue denote upregulated and downregulated gene expression, respectively. Relative expression levels of the genes in the KEGG Pathway in Cancer gene set are listed in Supplemental Table 5. (B) Activation of the Akt and MAPK pathways in Mir122a–/– mice. WT, normal livers from 14-month-old mice; N, tumor-adjacent tissues; T, tumor. A representative of 3 independent experiments is shown. Values represent the relative levels of PTEN protein expression between WT and the tumor-adjacent tissues (N) or the tumor tissues (T) of Mir122a–/– livers.
Klf6 is a critical miR-122a target that regulates hepatic fibrogenesis.
Next, we investigated how the large repertoire of miR-122a target genes might contribute to the control of miR-122a in the liver. We predicted that 252 human-mouse orthologs were potential miR-122a target genes (Supplemental Table 6). Five genes that we believe to be novel miR-122a targets were experimentally verified, and these might be relevant to the control of liver disease, namely Alpl, Cs, Klf6, Prom1, and Sox4 (ref. 41, Figure 7A, and Supplemental Table 7). The identification of Prom1 as a miR-122a target corroborates the link between miR-122a deficiency and altered hepatocyte differentiation. In the absence of cholestasis (Supplemental Figure 8), elevated expression of Alpl offers a reasonable explanation for the higher serum ALP levels in the mutant mice. We also performed binding site mutation analysis and confirmed the function of the predicted sites in the 3′ UTR of the Klf6 transcript (Figure 7, B–D). While low expression of Krüppel-like factor 6 (KLF6) was found primarily in the hepatocytes of WT livers (Figure 7, F and I), stronger KLF6 protein expression was observed in the Mir122a–/– hepatocytes and in some HSCs (Figure 7I, blue arrows). The HSCs were highly activated in Mir122a–/– livers (Figure 7, F and I). In a 14-day treatment protocol, shKlf6 (Figure 7E) effectively reduced the severity of liver fibrosis (Figure 7F), the elevated serum levels of TGF-β1 (Figure 7H), and the hallmarks of HSC activation (Figure 7, G and I). KLF6 is a pro-fibrogenic transcription factor that is known to transactivate the gene expression of COL1A1 (26), TGFB1, TGFBR1, and TGFBR2 (42), and higher expression of KLF6 is associated with fibrosis in nonalcoholic fatty liver disease (NAFLD) (43). These results provide strong initial evidence that will help to elucidate the mechanisms behind the increase in liver fibrosis observed with the loss of miR-122a.
Figure 7. Klf6 is a miR-122a target gene and contributes to hepatic fibrogenesis.

(A) A 3′ UTR reporter assay was used to verify the targets. Luciferase reporter activity of 8 3′ UTR constructs in HEK293T cells overexpressing miR-122 (293T-122) or mutant MIR122 (293T-122M). Aldoa and B2m are the positive and the negative controls, respectively. (B) Diagram depicting the seed region of MIR122, the mutated seed region of MIR122 (MIR122M), and the two binding site mutations (mu1 and mu2) within the 3′ UTR of Klf6. (C) Luciferase reporter activity of the Klf6–3′ UTR construct in 293T-GFP, 293T-122, or 293T-122M. (D) Luciferase reporter activity of the Klf6–3′ UTR constructs containing WT, mu1, or mu2 in 293T-GFP or 293T-122. The data are representative of 3 experiments. §P < 0.001. The hydrodynamic injection of shKlf6 reduced the expression of KLF6 (E and F) and reduced HSC cell activation and collagen deposition (F) in Mir122a–/– livers. Values in E represent the levels of KLF6 protein expression of mice with different treatments relative to the level in KO-shLacZ livers. Scale bars: 50 μm and 20 μm (insets). shLacZ is a control for RNA interference. (G) Quantitation of Sirius red staining. Ten different microscopic fields for each sample were evaluated with the MetaMorph software (Molecular Devices). (H) The serum level of TGF-β1 was reduced. n = 3 mice per group. †P < 0.01, §P < 0.001 for KO-shLacZ versus WT-shLacZ mice; ‡P < 0.01 for KO-shKlf6 versus KO-shLacZ mice. (I) Enlarged images of the insets of F. Scale bars: 10 μm. Expression of KLF6 is found in both the hepatocytes and HSCs (with ellipsoidal nucleus). Blue arrows, KLF6hi HSCs; yellow arrowhead, KLF6lo HSC.
Discussion
In this study, we have shown that the deletion of Mir122a exerts wide-ranging effects on liver homeostasis. Earlier studies involving mice and a knockdown approach provided an initial understanding of how miR-122a might regulate lipid metabolism. Despite these studies, a distinct miR-122–mediated regulatory mechanism was lacking (44). However, reduced levels of serum cholesterol have become a reliable biomarker for the in vivo antagonism of miR-122 in rodents (5, 6) and in primates (45) ( http://clinicaltrials.gov/ct2/show/NCT00979927). In contrast to this benign phenotype, our study shows that liver toxicity due to long-term suppression of miR-122a in Mir122a–/– mice is characterized by phenotypes similar to human liver pathology, including persistent steatohepatitis, fibrosis, and HCC (Figures 1 and 4). One explanation for this apparent discrepancy is that there are differences in the timing and duration of the two types of impaired miR-122a expression, because the mice experiencing transient miR-122a silencing only exhibit the early phenotypes caused by miR-122a deficiency that are seemingly beneficial.
Hepatic steatosis during miR-122a deficiency is attributable to a global impairment of lipid metabolism and lipoprotein assembly and secretion.
Although there is a marked reduction in the expression of genes involved in lipid biogenesis (Figure 2C), an accumulation of both cholesterol and TG in the liver was present in the Mir122a–/– mice. The hypothesis that miR-122a plays a critical role in proper lipoprotein secretion via MTTP regulation is supported by the data demonstrating the successful reversal of hepatic steatosis after the in vivo restoration of Mttp or the reexpression of miR-122a (Figure 3). Our results further suggest that the hepatic steatosis observed in miR-122a–deficient mice is the consequence of the global impairment of lipid metabolism and lipoprotein assembly and secretion as demonstrated by the repression of multiple genes involved in lipid metabolism (Figure 2C and ref. 12), by the complex hepatic lipid contents determined by 1H-NMR (Figure 2E), and by the abnormal levels of both VLDL and HDL (Figure 2, A–C). Lower apoE represents a risk for fatty liver development, as seen in the apoE-knockout mouse model (46). MTTP is important in the prevention of degradation and lipidation of the nascent apoB during the generation of VLDL in the liver (23, 24). Like other repressed genes in lipid metabolism, Mttp is not a bona fide target gene of miR-122a. Nevertheless, it is well documented that most miRNAs modulate the expression of multiple genes at the post-transcriptional level (47, 48). However, miRNA regulation can also be transmitted by transcription factors via an integrated regulatory loop (49). It is plausible that a negative regulator(s) of Mttp is directly targeted and inhibited by miR-122a. By the same token, the mechanism of repression of the lipogenic genes is not self-evident. We reasoned that there might be multiple unidentified miR-122a target genes mediating the regulation of lipid and lipoprotein metabolism. The detailed molecular mechanisms involved in how miR-122a regulates Mttp and other lipid metabolism genes have yet to be determined and are currently under rigorous investigation.
In Mir122a–/– mice, hepatic steatosis developed at birth and was followed by the appearance of liver inflammation and HSC activation by 1 month after birth (Supplemental Figure 9, B and C). Reduced expression of Mttp in fetal livers (data not shown) may contribute to the early emergence of steatosis in Mir122a–/– mice. The fact that overexpression of MTTP in Mir122a–/– mice leads to a reduction in inflammation implies that correcting the metabolic defects prevents the inflammatory response (Figure 3). However, this effect on tumorigenesis should be evaluated in a long-term follow-up study.
The present results suggest that hepatic fibrosis is promoted via the miR-122a/KLF6 axis.
Although the pathophysiology of the Mir122a–/– mouse model bears some resemblance to that of the Dicer1-KO mouse model (17, 18), these two genetically modified mouse models are distinctively different. When compared with Mir122a–/– mice, Dicer1-KO mice exhibit different serum profiles, show severe hypoglycemia upon fasting, and do not develop fibrosis. Liver fibrogenesis is a gradual process involving the increased secretion and decreased degradation of the ECM and involves the interplay between hepatocytes and HSCs (39). There is now evidence demonstrating that the activation of HSCs requires miRNAs and that the expression of certain miRNAs is modulated by activated HSCs, which then facilitate the progression of liver fibrosis (50, 51).
One unresolved question is how Mir122a regulates liver fibrosis. We observed the concordant expression of 3 fibrogenic factors, Ctgf, Klf6, and Tgfb1, as well as increased collagen deposition, in Mir122a–/– mice (Figure 3 and Supplemental Figure 10). These data suggest that the loss of miR-122a drives hepatic fibrogenesis in part via the regulation of these fibrogenic factors. As this is the first time to our knowledge that KLF6 has been identified as a target of miR-122a (Figure 7), we wondered whether the effects of miR-122a deficiency on KLF6 were cell-autonomous. The immunohistochemistry analysis showed that there was low expression of KLF6 in the hepatocytes in the WT livers (Figure 7I), but stronger KLF6 expression was observed in Mir122a–/– hepatocytes and in some HSCs (Figure 7I, blue arrows, KLF6hi HSCs). Furthermore, the reduction of elevated serum TGF-β1 levels (Figure 7H) that was due to the presence of shKlf6 was concordant with inactivation of HSCs. Since miR-122a is specifically expressed in hepatocytes (17), we speculate that higher levels of KLF6 in Mir122–/– hepatocytes may transactivate Tgfb1 (38) and possibly other target genes to initiate an activation cascade for the downstream activation of HSCs and/or other hepatic myofibroblasts. These results suggest that the effect of miR-122a deficiency on KLF6 is cell-autonomous. The liver fibrosis due to the loss of miR-122a in hepatocytes leads to the downstream activation of HSCs and/or other cell types. Once the activation cascade is initiated, several cell types can simultaneously engage in the fibrogenesis process.
Our current study has provided an example of the interplay between hepatocytes and HSCs by highlighting the involvement of the miR-122a/KLF6 axis in hepatic fibrogenesis. KLF6 is a transcriptional regulator involved in a broad range of cellular processes. Hepatic expression of KLF6 is invariably associated with steatohepatitis and fibrotic injury of the liver in both patients and experimental rodents (43, 52, 53). The miR-122a/KLF6 axis not only reveals a mechanism that results in hepatic fibrosis but also provides clues that may help establish new modalities for the treatment of liver fibrosis.
The Mir122a–/– mouse model recapitulates the hepatocarcinogenesis of human HCC.
To better understand the molecular mechanisms underlying the spontaneous development of liver tumors in Mir122a–/– mice, we performed unbiased gene expression profiling of the liver samples. Using GSEA analysis, we identified the global gene expression patterns in the tumor-free livers of young mice in the early liver lesions and in the HCC samples. These analyses revealed that the gene expression patterns in these samples are similar but also have substantial differences (Figure 6, A and B). A detailed analysis of Pathways in Cancer (Figure 6B and Supplemental Table 5) indicated that there was an age-dependent and continuous change in the expression of both downregulated and upregulated genes between the tumor-free livers at 2 months, the early liver lesions at 11 months, and the HCC at 14 months. A group of 55 genes (Rad51 through Ikbkg listed in Supplemental Table 5) was upregulated in the tumor-free livers, which suggests that tumor signature genes are induced early in miR-122a–deficient livers. The strong activation of PI3K and MAPK signaling (Figure 6B) in these tumors further supports the findings from the expression profiling. Thus, our data suggest that the pathway disturbances associated with Mir122a deletion contribute to tumor initiation and progression. our study differs from those using either in vivo knockdown of Mir122a (5, 6, 8, 38) or Dicer1 (17, 18). First, there are sequential changes in gene expression as the stage of malignancy progresses. Furthermore, liver tumors arising in Mir122a–/– mice harbor gene expression signatures that are similar to those of human HCC samples in which miR-122 is suppressed (Table 4, miR-122-LvH up and miR-122-LvH down) (16). In addition, the significant enrichment of fibrosis and the TGF-β signaling pathways, along with the changes in gene expression at various cellular junctions, support the observation that Mir122a–/– mice livers undergo EMT.
In Mir122a–/– mice, the initial signs of EMT are loss of the portal distribution of E-cadherin and the gain of vimentin expression, which were observed in our 1-month-old mice (data not shown). This was followed by the loss of E-cadherin expression in the tumors (Figure 5, A–C). Similarly, the expression of various selected oncofetal genes, namely Afp, Igf2, and Src, together with the cancer stem cell marker genes Prom1, Thy1, and Epcam, could be first detected in the livers of young Mir122a–/– mice, and this was followed by further increases in the expression of these genes in the tumors (Figure 4B). The evidence that Prom1 is a miR-122a target gene (Figure 7A) raised the possibility that miR-122a may be involved in liver cancer stem cell self-renewal and in the balance between cell differentiation and proliferation. Recently, Prom1 has been found to be phosphorylated by Src (54), and knockdown of Prom1 or treatment with a Src inhibitor was shown to suppress the stem-like properties and the tumorigenic ability of head and neck squamous cell carcinomas (HNSCCs) (55). It will be important to determine whether Prom1/Src signaling plays a regulatory role in facilitating the cellular transformation of hepatocytes that are miR-122 deficient. Last, miR-122a restoration effectively reduced disease manifestation and tumor incidence, which suggests that the reexpression of Mir122a is very effective in restoring hepatocyte differentiation (Table 3 and Figure 5D).
Despite the fact that significant miR-122a expression was detected in E12.5 mouse fetal livers, the role of miR-122a in liver development has not been formally addressed. Because cancer formation recapitulates development processes, it is imperative to recognize the role(s) of miR-122 in hepatocyte development and differentiation. Recently, Laudadio et al. (56) reported that a positive feedback loop between miR-122a and HNF6 (Onecut 1) drives hepatocyte differentiation. While Mir122a expression is significantly repressed in the E15.5 fetal livers of H6/O2 mice (double knockout of Onecut1 and Onecut2), Hnf6 expression is increased in the fetal livers of Mir122a-transgenic mice. Similar to Mttp, Hnf6 is not a bona fide target gene of miR-122a. Hnf6 levels were slightly reduced in 2-month-old Mir122a–/– mice (data not shown), indicating that miR-122a does not play a dominant role in regulating Hnf6 at this age and that further studies will be necessary to detect effects earlier in development.
In summary, this work describes the attempt to study the mechanisms involved in miR-122a regulation of liver homeostasis using an in vivo loss-of-function model. The results from this study show that targeted deletion of Mir122a in mice is able to mimic several key features of the phenotypes of human NAFLD and HCC. Our proof-of-concept experiment also suggests that the restoration of miR-122 constitutes a novel approach that could be used in differentiation therapy for chronic liver diseases and HCCs that express low levels of miR-122.
Methods
Further information can be found in Supplemental Methods.
Construction of the targeting vector and generation of the Mir122a–/– mice.
The BAC clone bMQ-418A13 (chr18: 65269984–65437465) containing the entire pri-Mir122a locus was purchased from Geneservice. A genomic fragment of 13 kb encompassing 7.8 kb upstream and 5.1 kb downstream of pre-Mir122a was cloned into PL253 in the bacterial strain EL350 by a recombineering-based method (19). The genomic fragment of Mir122a from PL253 was used to replace the WT allele of Mir122a in 129/Sv mouse embryonic stem cells (MESCs). MESC clones containing the targeted allele were identified by Southern blot analysis. Several clones were isolated and transfected together with a vector encoding the Cre recombinase that allowed the deletion of a fragment of 1,544 bp containing the entire pre-Mir122a. Clones with the Mir122a knockout allele were identified by Southern blot analysis and were injected into C57BL/6J blastocysts. Germline transmission of the Mir122a– allele was achieved by crossing the chimeric mice produced with normal C57BL/6 mice. Finally, homozygous Mir122a–/– mice were generated by crossing heterozygous littermate offspring. The genotyping of the F1 and successive generations was performed by Southern blotting and by PCR (Supplemental Figure 1, B and C).
Serological analysis.
Serum biochemical studies, including analysis of total cholesterol, TG, ALT, and ALP, were performed monthly. Serum was collected and analyzed using a DRI-CHEM 3500S (Fujifilm).
Histology and immunohistochemistry.
Resected liver tissue was processed as either paraffin sections or cryosections. Oil red O staining was performed on frozen sections fixed with formalin. The paraffin sections were processed to allow H&E staining, periodic PAS staining, Sirius red staining, and immunohistochemical studies. The immunohistochemical analysis used antibodies against F4/80, CD31, collagen I (Abcam), PCNA, vimentin, MTTP, E-cadherin (Cell Signaling Technology), desmin (Millipore), and KLF6 (Abgent).
RNA isolation, gene expression, and high-density oligonucleotide microarray analysis.
Super RNApure (Genesis Biotech Inc.) was used to extract total RNA from the various frozen liver samples. Quantitative RT-qPCR was performed according to the manufacturer’s specifications with B2m (β-2 microglobulin) RNA as an internal control (primer sequences in Supplemental Table 2). The microarray hybridizations were performed using total RNA prepared from the liver samples of 3 WT mice and 4 Mir122a–/– mice at the age of 2 months; liver samples from 2 WT mice and tumor samples from 3 Mir122a–/– mice at the age of 11 months; and liver samples from 3 WT mice and tumor samples from 5 Mir122a–/– mice at the age of 14 months. GeneChip Mouse Genome 430 2.0 Affymetrix oligonucleotide Gene Chips (Affymetrix) were analyzed at the Microarray & Gene Expression Analysis Core Facility (VYM Genome Research Center, National Yang-Ming University) according to the Affymetrix protocols. All the data files are presented in compliance with MIAMI guidelines and can be accessed online at the Gene Expression Omnibus (GSE27713 and GSE31453). Microarray datasets were analyzed using GSEA (version 3.2) (37) from the Broad Institute. Detailed information can be found in Supplemental Methods.
Lipoprotein electrophoresis.
Blood for mouse serum lipoprotein analysis was obtained after 2 consecutive overnights (16 hours) of fasting. Serum lipoproteins were analyzed on the Hydragel K20 Electrophoresis System (Sebia) according to the manufacturer’s methodology.
Extraction of total lipids from liver.
Mice were fasted for 2 consecutive overnights (16 hours) before liver tissue sampling. A 0.2- to 0.5-g portion of the liver was frozen in lipid nitrogen and ground into a powder in a mortar. A 4-ml mixture of chloroform and methanol was added to create a suspension to allow the extraction of lipids (57). The procedure was repeated twice. A total of 12 ml of extraction solution was used. The mixtures containing the extracted lipids were pooled into a 20-ml saponification tube. After adding 3 ml distilled water to the mortar in order to resuspend the tissue material, the resulting suspension was added to the extracts. The pooled suspension was then extensively vortexed (30 seconds 4 times, followed by centrifugation at 1,250 g for 30 minutes. A 4-ml portion of the top layer and a 5-ml portion of the bottom layer were separately collected into 20-ml counting vials. The organic (bottom) layer was dried under a stream of N2 gas. The upper aqueous layer was concentrated on a centrifugal concentrator. The two residues were then stored at –80°C before NMR measurement.
1H-NMR measurement.
The lipid residues were resuspended in 400 μl deuterated chloroform (CDCl3). The solution was transferred to a 5-mm NMR tube. NMR measurements were carried out on a 400-MHz Fourier transform NMR (FT-NMR) spectrometer (Bruker) with a BDI probehead. The pulse sequence and data acquisition for the NMR measurements were similar to those reported by Beckonert et al. (22). A reference sample containing 2 mg cholesterol in CDCl3 and under the same NMR conditions was used for comparison and quantification (signal intensity of H-18, chemical shift 0.65 ppm).
Identifying miR-122 targets among the upregulated genes of Mir122a–/– livers.
Three computational tools, namely miRanda (58), TargetScanS (59), and RNAhybrid (60), which have been successfully integrated by us in miRNAMap previously (61), were used in this study. In order to achieve higher prediction accuracy, we also integrated another tool, PITA (62). The integrated tools were then used to identify the miR-122a target sites located within the accessible regions of the 3′ UTRs of the upregulated genes in the Mir122a–/– mouse liver. Upregulated orthologous genes with target sites in both the mouse and human genomes were pinpointed. The analysis strategy and the performance evaluation are presented in Supplemental Methods and Supplemental Tables 6–8.
3′ UTR reporter assay.
The 3′ UTR fragments of the candidate target genes were subcloned using XhoI and NotI downstream of the luciferase gene in the vector psi-CHECK2 (Promega). The negative controls were lenti-122M and lenti-GFP (15). HEK293T cells were infected with lenti-GFP (293T-GFP), lenti-122 (293T-122), or lenti-122M (293T-122M) for 24 hours. Cells were then seeded into 24-well plates and co-transfected with 0.5 μg of the respective psi-CHECK2-3′ UTR construct using jetPEI (Polyplus Transfection). After 48 hours, luciferase activity was measured using the Dual-Luciferase Reporter Assay System Kit (Promega). The effect of miR-122a was expressed relative to the average value from 293T-122M cells. Three mutants of the miR-122a binding sites in the 3′ UTR of KLF6 were included in this study, namely KLF6-mu1, KLF6-mu2, and KLF6-mu1+mu2. The nucleotide sequences of all of the PCR cloning primers (Supplemental Table 9) and mutagenesis primers (Supplemental Table 10) are also listed.
Western blotting.
Protein lysates (30 μg) were separated by electrophoresis on 10% SDS polyacrylamide gels and transferred onto PVDF membranes (Millipore) for immunoblotting. The membranes were incubated with primary antibodies overnight at 4°C and then with horseradish peroxidase–conjugated secondary antibody (PerkinElmer Life Sciences). Primary antibodies against apoB-100, apoB-48 (Novus), apoE, MTTP, vimentin, GAPDH, FASN, desmin, PTEN, phospho-Akt, Akt, phospho–c-Raf, c-Raf, phospho-MEK1/2, MEK1/2, phospho-Erk, Erk, phospho-GYS2, GYS2, E-cadherin (Cell Signaling Technology), and KLF6 (Santa Cruz Biotechnology Inc.) were used. Signals were detected by an enhanced chemiluminescence kit (PerkinElmer). The relative levels of protein expression were normalized against GAPDH.
Hydrodynamic injection.
A partial human pri-MIR122 gene was subcloned into the vector pcDNA3.1(B) (Invitrogen) and designated pcDNA-MIR122 (15). Plasmid DNA was injected by the hydrodynamic technique as previously described (25). Briefly, 20 μg of endotoxin-free plasmid DNA was dissolved in 2 ml of sterile pharmaceutical-grade saline at room temperature and injected into the mouse tail vein with a 26.5-gauge needle over 6 seconds. For the short-term study (1-month duration), all the mice received 2 injections, one on day 1 and one on day 15. For the long-term study (8-month duration), all the mice received one injection per month for the duration of the study. The WT mice were injected with the pcDNA3.1(B) HA vector DNA only, while the Mir122a–/– mice were injected with either the pcDNA3.1(B) HA vector DNA or HA-miR-122 DNA. Each group included 5 or 7 mice that were 3 months old. Serum biochemical studies were carried out on day 5, day 14, or at the times indicated. The mice were sacrificed after 1 month or 8 months for histological examination and gene expression analysis. To restore the expression of MTTP in Mir122a–/– mice, one dose of 20 μg endotoxin-free Mttp expression construct (Origene MC204263) or pCMV6-NEO control vector (Origene) was delivered using the same injection protocol over 1 month. Each group included 5 mice that were 3 months old.
For delivery of shRNA expression constructs in vivo, all mice received a weekly dose of 20 μg of endotoxin-free shRNA construct using the same injection protocol for 2 weeks. Mice were sacrificed 14 days later. The shKlf6 (TRCN0000218241) and shLacZ (TRCN0000072224) constructs were obtained from TRC (National RNAi Core Facility, Academia Sinica). shLacZ targeting the β-galactosidase gene was used as a control for RNA interference. Each group consisted of 5 mice that were 7 months old.
Assays for serum TGF-β1.
Serum samples were frozen at –80°C until assayed. The serum levels of TGF-β1 were measured by a commercial ELISA kit (eBioscience) according to the manufacturer’s instructions.
Statistics.
All data are expressed as mean ± SD and were compared between groups using the 1-tailed Student’s t test. A P value of 0.05 or less was considered significant.
Study approval.
The animal studies were conducted in accordance with the Guidelines for the Care and Use of Mammals in Neuroscience and Behavioral Research and were approved by the IACUC of National Yang-Ming University.
Supplementary Material
Acknowledgments
We thank the members of the Transgenic Mouse Models Core Facility (TMMC) of the National Research Program for Genomic Medicine for generating the Mir122a-knockout mice. We also thank the Microarray and Gene Expression Analysis Core Facility of the VYM Genome Research Center, National Yang-Ming University, for their technical support. This work was supported by grants from the National Science Council (NSC98-3112-B-010-002 and 99-3112-B-010-010); a grant from the Ministry of Education, Aim for the Top University Plan (98A-C-T503) to A.-P. Tsou; and grants from the Veterans General Hospital University System of the Taiwan Joint Research Program (VGHUST99-G1) and the Center of Excellence for Cancer Research at TVGH (DOH100-TD-C-111-007) to J.-C. Wu and A.-P. Tsou. H.-D. Huang was supported by National Science Council grants (NSC-100-2911-I-009-101, 98-2311-B-009-004-MY3, and 100-2627-B-009-002). M.-S. Shiao was supported by National Science Council grant NSC98-2314-B-182-009-MY3 and EMRPD1A0591 from Chang Gung University.
Footnotes
Conflict of interest: The authors have declared that no conflict of interest exists.
Citation for this article: J Clin Invest. 2012;122(8):2884–2897. doi:10.1172/JCI63455.
See the related Commentary beginning on page 2773.
References
- 1.Lagos-Quintana M, Rauhut R, Yalcin A, Meyer J, Lendeckel W, Tuschl T. Identification of tissue-specific microRNAs from mouse. Curr Biol. 2002;12(9):735–739. doi: 10.1016/S0960-9822(02)00809-6. [DOI] [PubMed] [Google Scholar]
- 2.Song L, Tuan RS. MicroRNAs and cell differentiation in mammalian development. Birth Defects Res C Embryo Today. 2006;78(2):140–149. doi: 10.1002/bdrc.20070. [DOI] [PubMed] [Google Scholar]
- 3.Fazi F, Nervi C. MicroRNA: basic mechanisms and transcriptional regulatory networks for cell fate determination. Cardiovasc Res. 2008;79(4):553–561. doi: 10.1093/cvr/cvn151. [DOI] [PubMed] [Google Scholar]
- 4.Chang J, et al. miR-122, a mammalian liver-specific microRNA, is processed from hcr mRNA and may downregulate the high affinity cationic amino acid transporter CAT-1. RNA Biol. 2004;1(2):106–113. doi: 10.4161/rna.1.2.1066. [DOI] [PubMed] [Google Scholar]
- 5.Krützfeldt J, et al. Silencing of microRNAs in vivo with ‘antagomirs’. Nature. 2005;438(7068):685–689. doi: 10.1038/nature04303. [DOI] [PubMed] [Google Scholar]
- 6.Esau C, et al. miR-122 regulation of lipid metabolism revealed by in vivo antisense targeting. Cell Metab. 2006;3(2):87–98. doi: 10.1016/j.cmet.2006.01.005. [DOI] [PubMed] [Google Scholar]
- 7.Kim N, Kim H, Jung I, Kim Y, Kim D, Han YM. Expression profiles of miRNAs in human embryonic stem cells during hepatocyte differentiation. Hepatol Res. 2011;41(2):170–183. doi: 10.1111/j.1872-034X.2010.00752.x. [DOI] [PubMed] [Google Scholar]
- 8.Gatfield D, et al. Integration of microRNA miR-122 in hepatic circadian gene expression. Genes Dev. 2009;23(11):1313–1326. doi: 10.1101/gad.1781009. [DOI] [PMC free article] [PubMed] [Google Scholar]
- 9.Jopling CL, Yi M, Lancaster AM, Lemon SM, Sarnow P. Modulation of hepatitis C virus RNA abundance by a liver-specific MicroRNA. Science. 2005;309(5740):1577–1581. doi: 10.1126/science.1113329. [DOI] [PubMed] [Google Scholar]
- 10.Castoldi M, et al. The liver-specific microRNA miR-122 controls systemic iron homeostasis in mice. J Clin Invest. 2011;121(4):1386–1396. doi: 10.1172/JCI44883. [DOI] [PMC free article] [PubMed] [Google Scholar]
- 11.Cheung O, et al. Nonalcoholic steatohepatitis is associated with altered hepatic MicroRNA expression. Hepatology. 2008;48(6):1810–1820. doi: 10.1002/hep.22569. [DOI] [PMC free article] [PubMed] [Google Scholar]
- 12.Burchard J, et al. microRNA-122 as a regulator of mitochondrial metabolic gene network in hepatocellular carcinoma. Mol Syst Biol. 2010;6:402. doi: 10.1038/msb.2010.58. [DOI] [PMC free article] [PubMed] [Google Scholar]
- 13.Kutay H, et al. Downregulation of miR-122 in the rodent and human hepatocellular carcinomas. J Cell Biochem. 2006;99(3):671–678. doi: 10.1002/jcb.20982. [DOI] [PMC free article] [PubMed] [Google Scholar] [Retracted]
- 14.Budhu A, et al. Identification of metastasis-related microRNAs in hepatocellular carcinoma. Hepatology. 2008;47(3):897–907. doi: 10.1002/hep.22160. [DOI] [PubMed] [Google Scholar]
- 15.Tsai WC, et al. MicroRNA-122, a tumor suppressor microRNA that regulates intrahepatic metastasis of hepatocellular carcinoma. Hepatology. 2009;49(5):1571–1582. doi: 10.1002/hep.22806. [DOI] [PubMed] [Google Scholar]
- 16.Coulouarn C, Factor VM, Andersen JB, Durkin ME, Thorgeirsson SS. Loss of miR-122 expression in liver cancer correlates with suppression of the hepatic phenotype and gain of metastatic properties. Oncogene. 2009;28(40):3526–3536. doi: 10.1038/onc.2009.211. [DOI] [PMC free article] [PubMed] [Google Scholar]
- 17.Hand NJ, Master ZR, Le Lay J, Friedman JR. Hepatic function is preserved in the absence of mature microRNAs. Hepatology. 2009;49(2):618–626. doi: 10.1002/hep.22656. [DOI] [PMC free article] [PubMed] [Google Scholar]
- 18.Sekine S, et al. Disruption of Dicer1 induces dysregulated fetal gene expression and promotes hepatocarcinogenesis. Gastroenterology. 2009;136(7):2304–2315. doi: 10.1053/j.gastro.2009.02.067. [DOI] [PMC free article] [PubMed] [Google Scholar]
- 19.Liu P, Jenkins NA, Copeland NG. A highly efficient recombineering-based method for generating conditional knockout mutations. Genome Res. 2003;13(3):476–484. doi: 10.1101/gr.749203. [DOI] [PMC free article] [PubMed] [Google Scholar]
- 20.Bissell DM, Roulot D, George J. Transforming growth factor beta and the liver. Hepatology. 2001;34(5):859–867. doi: 10.1053/jhep.2001.28457. [DOI] [PubMed] [Google Scholar]
- 21.Gressner OA, Gressner AM. Connective tissue growth factor: a fibrogenic master switch in fibrotic liver diseases. Liver Int. 2008;28(8):1065–1079. doi: 10.1111/j.1478-3231.2008.01826.x. [DOI] [PubMed] [Google Scholar]
- 22.Beckonert O, et al. Metabolic profiling, metabolomic and metabonomic procedures for NMR spectroscopy of urine, plasma, serum and tissue extracts. Nat Protoc. 2007;2(11):2692–2703. doi: 10.1038/nprot.2007.376. [DOI] [PubMed] [Google Scholar]
- 23.Davis RA. Cell and molecular biology of the assembly and secretion of apolipoprotein B-containing lipoproteins by the liver. Biochim Biophys Acta. 1999;1440(1):1–31. doi: 10.1016/s1388-1981(99)00083-9. [DOI] [PubMed] [Google Scholar]
- 24.Sundaram M, Yao Z. Recent progress in understanding protein and lipid factors affecting hepatic VLDL assembly and secretion. Nutr Metab (Lond). 2010;7:35. doi: 10.1186/1743-7075-7-35. [DOI] [PMC free article] [PubMed] [Google Scholar]
- 25.Wooddell CI, Reppen T, Wolff JA, Herweijer H. Sustained liver-specific transgene expression from the albumin promoter in mice following hydrodynamic plasmid DNA delivery. J Gene Med. 2008;10(5):551–563. doi: 10.1002/jgm.1179. [DOI] [PubMed] [Google Scholar]
- 26.Ratziu V, et al. Zf9, a Kruppel-like transcription factor up-regulated in vivo during early hepatic fibrosis. Proc Natl Acad Sci U S A. 1998;95(16):9500–9505. doi: 10.1073/pnas.95.16.9500. [DOI] [PMC free article] [PubMed] [Google Scholar]
- 27.Mirandola S, et al. Liver microsomal triglyceride transfer protein is involved in hepatitis C liver steatosis. Gastroenterology. 2006;130(6):1661–1669. doi: 10.1053/j.gastro.2006.02.035. [DOI] [PubMed] [Google Scholar]
- 28.Shindo N, et al. Involvement of microsomal triglyceride transfer protein in nonalcoholic steatohepatitis in novel spontaneous mouse model. J Hepatol. 2010;52(6):903–912. doi: 10.1016/j.jhep.2009.12.033. [DOI] [PubMed] [Google Scholar]
- 29.El-Serag HB, Rudolph KL. Hepatocellular carcinoma: epidemiology and molecular carcinogenesis. Gastroenterology. 2007;132(7):2557–2576. doi: 10.1053/j.gastro.2007.04.061. [DOI] [PubMed] [Google Scholar]
- 30.Nakagawa H, et al. Serum IL-6 levels and the risk for hepatocarcinogenesis in chronic hepatitis C patients: an analysis based on gender differences. Int J Cancer. 2009;125(10):2264–2269. doi: 10.1002/ijc.24720. [DOI] [PubMed] [Google Scholar]
- 31.Naugler WE, et al. Gender disparity in liver cancer due to sex differences in MyD88-dependent IL-6 production. Science. 2007;317(5834):121–124. doi: 10.1126/science.1140485. [DOI] [PubMed] [Google Scholar]
- 32.Nussbaum T, et al. Autocrine insulin-like growth factor-II stimulation of tumor cell migration is a progression step in human hepatocarcinogenesis. Hepatology. 2008;48(1):146–156. doi: 10.1002/hep.22297. [DOI] [PubMed] [Google Scholar]
- 33.Ma S, et al. Identification and characterization of tumorigenic liver cancer stem/progenitor cells. Gastroenterology. 2007;132(7):2542–2556. doi: 10.1053/j.gastro.2007.04.025. [DOI] [PubMed] [Google Scholar]
- 34.Yang ZF, et al. Significance of CD90+ cancer stem cells in human liver cancer. Cancer Cell. 2008;13(2):153–166. doi: 10.1016/j.ccr.2008.01.013. [DOI] [PubMed] [Google Scholar]
- 35.Terris B, Cavard C, Perret C. EpCAM, a new marker for cancer stem cells in hepatocellular carcinoma. J Hepatol. 2010;52(2):280–281. doi: 10.1016/j.jhep.2009.10.026. [DOI] [PubMed] [Google Scholar]
- 36.Yang MH, et al. Comprehensive analysis of the independent effect of twist and snail in promoting metastasis of hepatocellular carcinoma. Hepatology. 2009;50(5):1464–1474. doi: 10.1002/hep.23221. [DOI] [PubMed] [Google Scholar]
- 37.Subramanian A, et al. Gene set enrichment analysis: a knowledge-based approach for interpreting genome-wide expression profiles. Proc Natl Acad Sci U S A. 2005;102(43):15545–15550. doi: 10.1073/pnas.0506580102. [DOI] [PMC free article] [PubMed] [Google Scholar]
- 38.Elmen J, et al. Antagonism of microRNA-122 in mice by systemically administered LNA-antimiR leads to up-regulation of a large set of predicted target mRNAs in the liver. Nucleic Acids Res. 2008;36(4):1153–1162. doi: 10.1093/nar/gkm1113. [DOI] [PMC free article] [PubMed] [Google Scholar]
- 39.Friedman SL. Mechanisms of hepatic fibrogenesis. Gastroenterology. 2008;134(6):1655–1669. doi: 10.1053/j.gastro.2008.03.003. [DOI] [PMC free article] [PubMed] [Google Scholar]
- 40.Sze KM, Wong KL, Chu GK, Lee JM, Yau TO, Oi-Lin Ng I. Loss of phosphatase and tensin homolog enhances cell invasion and migration through AKT/Sp-1 transcription factor/matrix metalloproteinase 2 activation in hepatocellular carcinoma and has clinicopathologic significance. Hepatology. 2011;53(5):1558–1569. doi: 10.1002/hep.24232. [DOI] [PubMed] [Google Scholar]
- 41.Liao YL, et al. Identification of SOX4 target genes using phylogenetic footprinting-based prediction from expression microarrays suggests that overexpression of SOX4 potentiates metastasis in hepatocellular carcinoma. Oncogene. 2008;27(42):5578–5589. doi: 10.1038/onc.2008.168. [DOI] [PubMed] [Google Scholar]
- 42.Kim Y, et al. Transcriptional activation of transforming growth factor beta1 and its receptors by the Kruppel-like factor Zf9/core promoter-binding protein and Sp1. Potential mechanisms for autocrine fibrogenesis in response to injury. J Biol Chem. 1998;273(50):33750–33758. doi: 10.1074/jbc.273.50.33750. [DOI] [PubMed] [Google Scholar]
- 43.Miele L, et al. The Kruppel-like factor 6 genotype is associated with fibrosis in nonalcoholic fatty liver disease. Gastroenterology. 2008;135(1):282–291. doi: 10.1053/j.gastro.2008.04.004. [DOI] [PMC free article] [PubMed] [Google Scholar]
- 44.Norman KL, Sarnow P. Modulation of hepatitis C virus RNA abundance and the isoprenoid biosynthesis pathway by microRNA miR-122 involves distinct mechanisms. J Virol. 2010;84(1):666–670. doi: 10.1128/JVI.01156-09. [DOI] [PMC free article] [PubMed] [Google Scholar]
- 45.Lanford RE, et al. Therapeutic silencing of microRNA-122 in primates with chronic hepatitis C virus infection. Science. 2010;327(5962):198–201. doi: 10.1126/science.1178178. [DOI] [PMC free article] [PubMed] [Google Scholar]
- 46.Mensenkamp AR, et al. Apolipoprotein E participates in the regulation of very low density lipoprotein-triglyceride secretion by the liver. J Biol Chem. 1999;274(50):35711–35718. doi: 10.1074/jbc.274.50.35711. [DOI] [PubMed] [Google Scholar]
- 47.Bartel DP. MicroRNAs: genomics, biogenesis, mechanism, and function. Cell. 2004;116(2):281–297. doi: 10.1016/S0092-8674(04)00045-5. [DOI] [PubMed] [Google Scholar]
- 48.Guo H, Ingolia NT, Weissman JS, Bartel DP. Mammalian microRNAs predominantly act to decrease target mRNA levels. Nature. 2010;466(7308):835–840. doi: 10.1038/nature09267. [DOI] [PMC free article] [PubMed] [Google Scholar]
- 49.Park SM, Gaur AB, Lengyel E, Peter ME. The miR-200 family determines the epithelial phenotype of cancer cells by targeting the E-cadherin repressors ZEB1 and ZEB2. Genes Dev. 2008;22(7):894–907. doi: 10.1101/gad.1640608. [DOI] [PMC free article] [PubMed] [Google Scholar]
- 50.Jiang X, Tsitsiou E, Herrick SE, Lindsay MA. MicroRNAs and the regulation of fibrosis. FEBS J. 2010;277(9):2015–2021. doi: 10.1111/j.1742-4658.2010.07632.x. [DOI] [PMC free article] [PubMed] [Google Scholar]
- 51.Ogawa T, et al. MicroRNA-221/222 upregulation indicates the activation of stellate cells and the progression of liver fibrosis [published online ahead of print January 20, 2012]. Gut. doi: 10.1136/gutjnl-2011-300717. doi: 10.1136/gutjnl-2011-300717 . [DOI] [PubMed] [Google Scholar]
- 52.Bureau C, et al. Expression of the transcription factor Klf6 in cirrhosis, macronodules, and hepatocellular carcinoma. J Gastroenterol Hepatol. 2008;23(1):78–86. doi: 10.1111/j.1440-1746.2007.05234.x. [DOI] [PubMed] [Google Scholar]
- 53.Starkel P, et al. Oxidative stress, KLF6 and transforming growth factor-beta up-regulation differentiate non-alcoholic steatohepatitis progressing to fibrosis from uncomplicated steatosis in rats. J Hepatol. 2003;39(4):538–546. doi: 10.1016/S0168-8278(03)00360-X. [DOI] [PubMed] [Google Scholar]
- 54.Boivin D, et al. The stem cell marker CD133 (prominin-1) is phosphorylated on cytoplasmic tyrosine-828 and tyrosine-852 by Src and Fyn tyrosine kinases. Biochemistry. 2009;48(18):3998–4007. doi: 10.1021/bi900159d. [DOI] [PubMed] [Google Scholar]
- 55.Chen YS, et al. CD133/Src axis mediates tumor initiating property and epithelial-mesenchymal transition of head and neck cancer. PLoS One. 2011;6(11):e28053. doi: 10.1371/journal.pone.0028053. [DOI] [PMC free article] [PubMed] [Google Scholar]
- 56.Laudadio I, et al. A feedback loop between the liver-enriched transcription factor network and miR-122 controls hepatocyte differentiation. Gastroenterology. 2012;142(1):119–129. doi: 10.1053/j.gastro.2011.09.001. [DOI] [PubMed] [Google Scholar]
- 57.Folch J, Lees M, Sloane Stanley GH. A simple method for the isolation and purification of total lipides from animal tissues. J Biol Chem. 1957;226(1):497–509. [PubMed] [Google Scholar]
- 58.Enright AJ, John B, Gaul U, Tuschl T, Sander C, Marks DS. MicroRNA targets in Drosophila. Genome Biol. 2003;5(1):R1. doi: 10.1186/gb-2003-5-1-r1. [DOI] [PMC free article] [PubMed] [Google Scholar]
- 59.Lewis BP, Burge CB, Bartel DP. Conserved seed pairing, often flanked by adenosines, indicates that thousands of human genes are microRNA targets. Cell. 2005;120(1):15–20. doi: 10.1016/j.cell.2004.12.035. [DOI] [PubMed] [Google Scholar]
- 60.Rehmsmeier M, Steffen P, Hochsmann M, Giegerich R. Fast and effective prediction of microRNA/target duplexes. RNA. 2004;10(10):1507–1517. doi: 10.1261/rna.5248604. [DOI] [PMC free article] [PubMed] [Google Scholar]
- 61.Hsu SD, et al. miRNAMap 2.0: genomic maps of microRNAs in metazoan genomes. Nucleic Acids Res. 2008;36(Database issue):D165–D169. doi: 10.1093/nar/gkm1012. [DOI] [PMC free article] [PubMed] [Google Scholar]
- 62.Kertesz M, Iovino N, Unnerstall U, Gaul U, Segal E. The role of site accessibility in microRNA target recognition. Nat Genet. 2007;39(10):1278–1284. doi: 10.1038/ng2135. [DOI] [PubMed] [Google Scholar]
Associated Data
This section collects any data citations, data availability statements, or supplementary materials included in this article.