

Summary
Oligodendroglia support axon survival and function through mechanisms independent of myelination and their dysfunction leads to axon degeneration in several diseases. The cause of this degeneration has not been determined, but lack of energy metabolites such as glucose or lactate has been hypothesized. Lactate is transported exclusively by monocarboxylate transporters, and changes to these transporters alter lactate production and utilization. We show the most abundant lactate transporter in the CNS, monocarboxylate transporter 1 (MCT1), is highly enriched within oligodendroglia and that disruption of this transporter produces axon damage and neuron loss in animal and cell culture models. In addition, this same transporter is reduced in patients with, and mouse models of, amyotrophic lateral sclerosis (ALS), suggesting a role for oligodendroglial MCT1 in pathogenesis. The role of oligodendroglia in axon function and neuron survival has been elusive; this study defines a new fundamental mechanism by which oligodendroglia support neurons and axons.
Introduction
Oligodendroglia promote rapid conduction of action potentials by ensheathing central nervous system (CNS) axons with myelin. Oligodendrocyte diseases, such as multiple sclerosis and leukodystrophies, have demonstrated demyelination and axon degeneration at autopsy.1,2 Mouse models of oligodendrocyte injury, including proteolipid protein (plp1)-null mice3 and Cnp1 mutant mice4, demonstrate axon loss without significant demyelination, suggesting that oligodendroglia support axon survival through a myelin-independent mechanism, possibly as a result of insufficient axonal energy support.5 Myelinated axons are only exposed to extracellular energy substrates at the nodes of Ranvier, and therefore may require specialized transport of energy metabolites from myelinating oligodendroglia to meet their high metabolic needs. The identity of these metabolites is unclear, but our study suggests that lactate may be essential and its transport dependent on monocarboxylate transporter 1 (MCT1 or SLC16a1; Supplemental Fig. 1).
MCT1, along with MCT2 and MCT4, transport monocarboxylic acids (i.e., lactate, pyruvate, and ketone bodies) and localize to the CNS.6 Neurons express MCT2, and glia express both MCT1 and MCT4,7,8 though MCT1 is the dominant glial transporter in the brain.9 Recently, MCT1 was localized to oligodendroglia and MCT2 to axons of the corpus callosum and cerebellar white matter by immunohistochemistry.10 In vitro astrocytes produce lactate through aerobic glycolysis,11,12 and lactate alone can support neurons in the absence of glucose, presumably through MCT2 localized to neurons. This hypothetical energy transfer was termed the astrocyte-neuron lactate shuttle.13 Support for lactate-based neuronal support have come from both in vitro and in vivo paradigms;14,15 however, the physiologic role for lactate in the non-stressed, uninjured CNS is largely unknown. We now report that oligodendroglia are a significant site of MCT1 expression in the brain and spinal cord and are the principal metabolic supplier of lactate to axons and neurons.
Oligodendroglia injury is well established in demyelinating diseases,16 but the supply of energy metabolites to axons could be critical in other neurologic diseases, as well. In this study, we investigated ALS, a fatal neurologic disease characterized clinically by progressive weakness and pathologically by cortical and spinal motoneuron degeneration. Although the pathogenesis of motoneuron degeneration is unknown, it is mediated partly by surrounding astroglia and microglia.17 A recent study suggests that grey matter oligodendroglia may be injured in ALS,18 and we propose that reduced expression of MCTs is one mechanism by which oligodendroglia produce neurotoxicity in ALS.
MCT1 mRNA localized to oligodendroglia in vivo
Astrocytes,8,19,20 ependymocytes, endothelial cells,19,21 and recently oligodendroglia10 have inconsistently been demonstrated to express MCT1. This variability is due to limitations in antibody specificity and/or affinity, along with differences in age and species analysed. To overcome this technical challenge, we produced two lines of BAC-MCT1 td-Tomato reporter mice (BAC-MCT1) for cellular localization and in vivo expression level of MCT1 mRNA in the CNS and peripheral organs (Fig. 1 and Supplementary Figs. 2–4). Results are shown for the highest expressing line, though cellular localization was identical for the second line (data not shown). Enrichment of MCT1 mRNA was found within fluorescence-activated cell sorted (FACS) td-Tomato-positive cells (Group b; Fig. 1a) verifying the specificity of the reporter. Expression was similar in perinatal mice, though reporter expression around blood vessels was increased (data not shown). BAC-MCT1 were crossed with BAC-MOBP eGFP (GENSAT) and BAC-GLT1 eGFP reporter mice,22 which express eGFP driven by the oligodendrocyte-specific myelin-associated oligodendrocyte protein (MOBP) and astrocyte-specific glutamate transporter 1 (GLT1), respectively. MCT1 mRNA was almost exclusively localized to oligodendroglia in the brain and spinal cord (Fig. 1 and Supplementary Fig. 3), with greater than 70–80% co-localization in spinal cord, cortex, and corpus callosum (Fig. 1p). Rare neuronal populations expressed MCT1 (Supplementary Fig. 4), though none in retinal ganglion cells (Supplementary Fig. 2k) or spinal cord motoneurons (Supplementary Fig. 4o,p). Surprisingly, there was virtually no expression of MCT1 mRNA within adult CNS astrocytes (Fig. 1 and Supplementary Fig. 3), nor was it found in NG2 cells, endothelial cells, or microglia (Fig. 1). The majority of BAC-MCT1-positive cells co-labelled with an oligodendroglia lineage marker, oligodendrocyte transcription factor 2 (Olig2; Fig. 1l),23 while few other CNS cells expressed tdTomato (Fig. 1p).
Figure 1. MCT1 expressed primarily within oligodendroglia in the CNS.
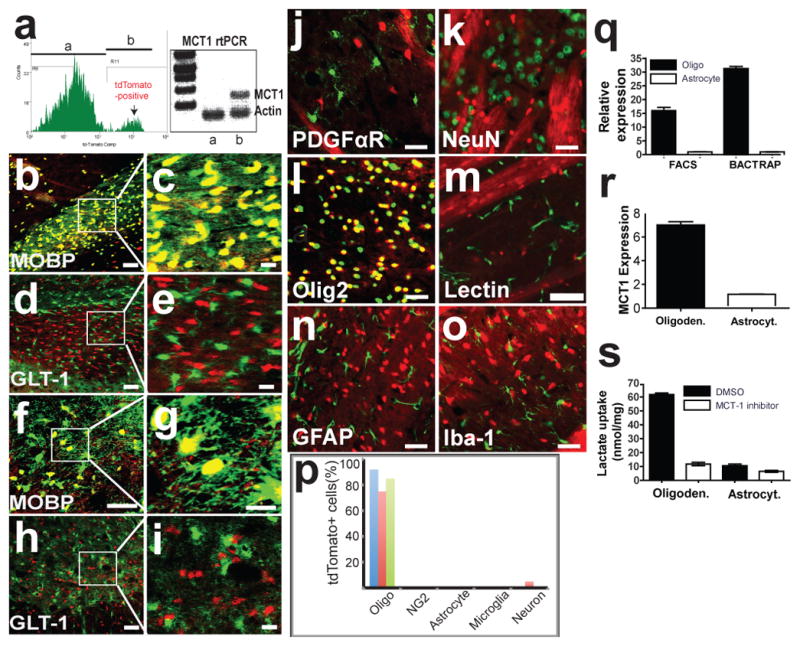
(a) Histogram and rtPCR for MCT1 mRNA from FAC sorted cells with (b) or without (a) tdTomato expression. (b–e) Corpus callosum of tdTomato MCT1 reporter mice crossed with BAC-MOBP eGFP (b,c) or BAC-GLT1 eGFP (d,e) mice. (f–i) Spinal cord of tdTomato MCT1 reporter mice crossed with BAC-MOBP eGFP (f,g) or BAC-GLT1 eGFP (h,i) mice (Scale bars = 50 and 14 μm for low and high power, respectively). (j–o) TdTomato MCT1 reporter mouse brain immunostained with cell-specific markers (scale bars = 12.5 μm, except 50 μm for lectin). (p) Percentage of tdTomato cells co-labelled with CNS cell markers in the spinal cord (blue), cortex (red), and corpus callosum (green). (q,r) Real-time rtPCR of MCT1 mRNA isolated from oligodendroglia and astroglia by FACS and BacTRAP techniques (q; means of 4 replicates) and human oligodendroglioma (M03.13) and astrocytoma (U87) cell lines (r). (s) Lactate transport and blockade by selective MCT1 inhibitor in oligodendroglioma and astrocytoma.
MCT1 protein also co-localized with myelinating oligodendroglia, as MCT1 immunoreactivity co-localized with myelin basic protein and CNPase in rodent and human brain (Supplementary Fig. 5). MCT1 protein was closely aligned with axons Supplementary Fig. 5h–j), but not astroglia, axonal nodes, or paranodes (Supplementary Fig. 5k–p). In vitro, NG2 cells and primary oligodendroglia both expressed tdTomato MCT1 reporter (Supplementary Fig. 6a–f), as do primary astrocyte cultures (Supplementary Fig. 6g–l),24 which may account for the discrepancies in MCT1 localization in the literature.
The cell specificity and enrichment of native MCT1 mRNA was further evaluated by FACS and bacterial artificial chromosome translating ribosome affinity purification (BacTRAP) techniques. MCT1 mRNA, quantified by real-time RT-PCR of acutely isolated mouse brain mRNA from FACS and BacTRAP astrocytes and oligodendroglia, was expressed at 16-fold (FACS) and 31-fold (BacTRAP) higher levels in mature oligodendroglia compared to astrocytes (Fig. 1q). MCT1 expression (Fig. 1r) and functional lactate transport (Fig. 1s) were also detected and enriched in oligodendrocyte tumor cells (i.e., oligodendroglioma) as compared to astrocyte tumor cells (i.e., astrocytoma). Although not detectable by either the BAC MCT1 td-Tomato reporter mice or immunohistochemistry, FACS and BacTRAP experiments suggest that astrocytes express very low levels of MCT1 mRNA in vivo; though it is clear that MCT1 expression and lactate transport is much greater in oligodendroglia than astrocytes. Astrocytes in vivo express the MCT4 lactate transporter (unpublished observation),25,26 suggesting this transporter may play a more important role in astrocytes than MCT1.
Neuronal survival in vitro requires MCT1
Similar to in vivo, MCT1 mRNA is primarily localized to oligodendrocyte-lineage cells, immunostained with Olig2, in postnatal organotypic spinal cord cultures (Supplementary Fig. 7). To investigate whether downregulation or inhibition of MCT1 produces neuron death, organotypic spinal cord cultures were treated with antisense oligonucleotides (ASO) or a specific MCT1 transport inhibitor (MCT1i; Supplementary Fig. 7i).27 Following three weeks of treatment, only 67% of motoneurons survived in the ASO group (± 6.7 S.E.M., P < 0.01, Fig. 2a,b) and 66% (± 5.9 S.E.M., P < 0.05, Fig. 2c) in the MCT1i group. Thus, genetic or pharmacological reduction of MCT1 led to motoneuron death.
Figure 2. MCT1 required for neuronal survival in vitro.
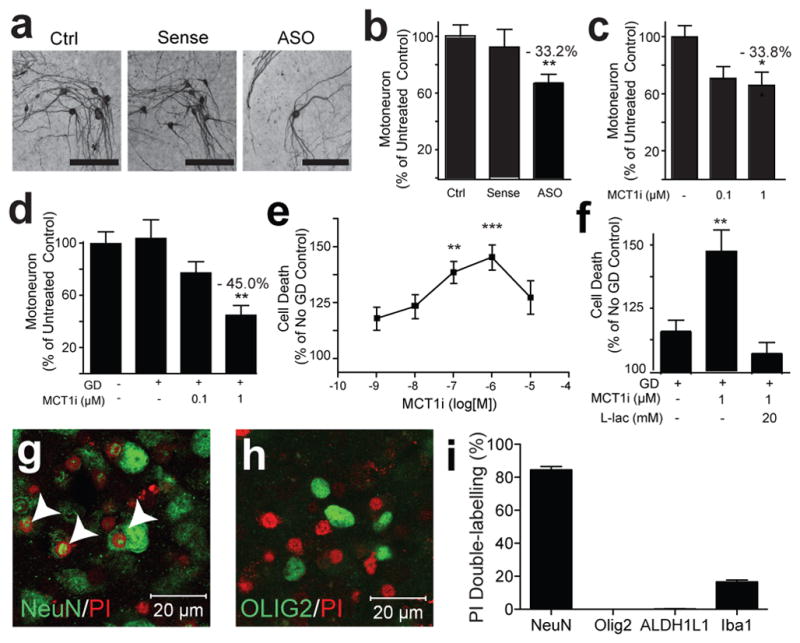
(a–d) Photomicrograph (a) and quantification of motoneurons in spinal cord slice cultures treated with media only (Ctrl), MCT1 sense oligonucleotides (Sense), or MCT1 antisense oligonucleotides (ASO) for 3 weeks (b; n ≥ 55 sections per group), following 3 weeks treatment with MCT1i (c; n ≥ 27 sections per group), or 2 hrs of glucose deprivation (GD) ± MCT1i (d; n ≥ 30 sections per group). (e,f) Propidium iodide (PI) uptake in slice cultures treated with 2 hrs GD + MCT1i (e; n ≥ 10 sections per group) or 2 hrs GD, ± MCT1i, ± 20 mM lactate (f; n = 15 for all groups). (g,h) PI uptake in slices treated with GD + MCT1i labelled with neuronal (g; co-localized cells marked with arrowheads) or oligodendroglia (h) marker. (i) Percentage of PI-labelled cells co-localizing cell-specific markers (n 10 sections per group, Error bars = ± S.E.M. *p < 0.05, **p < 0.01, ***p < 0.001).
If the function of MCT1 is to export lactate from oligodendroglia and provide energy metabolites to neurons, then neurons exposed to glucose-free media or stimuli that increase neuronal activity should be particularly vulnerable. Motoneurons in organotypic spinal cord slice cultures were resistant to short periods (i.e., 2 hours) of glucose deprivation (GD), presumably due to the presence of glycogen stores in astrocytes.28 Simultaneous exposure to GD and MCT1i led to concentration-dependent motoneuron loss, as measured by counts of neurofilament-containing neurons in the ventral horn (Fig. 2d, P < 0.01), and overall cell death, as measured by propidium iodide (PI) uptake (Fig. 2e, P < 0.001). PI uptake occurred primarily within neurons (Fig. 2g,i, P < 0.001 and Supplementary Fig. 7) and occasionally within Iba-1-positive microglia (Fig. 2i and Supplementary Fig. 7). Much of the PI uptake in microglia is likely due to phagocytosing dead cells; however, limited microglia death cannot be excluded. Importantly, there was no death of oligodendrocyte-lineage cells or astrocytes following treatment with MCT1i and glucose deprivation (Figs. 2h,i and Supplementary Fig. 7). Other neurons were also vulnerable to treatment with GD and MCT1i since significant PI uptake was seen in the dorsal horn of the spinal cord and in organotypic cultures from neocortex (Supplementary Fig. 7). MCT1i-GD-induced neurodegeneration was completely prevented by supplementing media with 20 mM L-lactate (Fig. 2f, P < 0.01), confirming that the toxicity in cultures was due to reduced lactate release from oligodendroglia, not blockage of lactate uptake on neurons or oligodendroglia. Cell death was also produced by co-treatment of organotypic spinal cord cultures with MCT1i and either glutamate or the GABA antagonist, bicuculline, both of which depolarize neurons in slice cultures (Supplementary Fig. 8; p< 0.05).29,30 Since glutamate is also a substrate of metabolism, we confirmed that cell death was dependent on neuron depolarization by blocking cell death with the AMPA/kainate receptor antagonist, CNQX (Supplementary Fig. 8). In summary, neurons in vitro are vulnerable to inhibitors of MCT1 lactate transport. Toxicity is potentiated by removing glucose or increasing the metabolic activity of neurons and prevented by supplying exogenous lactate.
Downregulation of MCT1 in-vivo is motoneuron toxic
To downregulate MCT1 in vivo, we produced a lentivirus that expressed GFP and MCT1 shRNA driven by the CMV and H1 promoters, respectively (lenti-shRNA). Lenti-shRNA downregulated MCT1 protein both in cultured cells and in vivo cervical spinal cord (Fig. 3a). The amount of downregulation in vivo is underestimated by Western blot since only a fraction of oligodendroglia are transfected by virus. Controls included injection of a lentivirus expressing only GFP (lenti-GFP) and contralateral injections of virus media. Both lentiviruses (lenti-shRNA and -GFP) effectively transduced oligodendroglia and astrocytes (Fig. 3b,c). Four weeks following cervical spinal cord injection of lenti-shRNA, 56% (± 5.7 SEM, n = 10, P < 0.05) of motoneurons near the injection site survived relative to contralateral media injection, while lenti-GFP had no significant effect (Fig. 3, P >0.05). In addition, numerous pathologic axonal swellings, immunoreactive for neurofilament (SMI32), resulted from lenti-shRNA treatment (Fig. 3g). As expected, motoneuron death in lenti-shRNA injected spinal cords produced microglial activation, which was not seen with lenti-GFP control (Fig. 3h,i). Thus, subacute downregulation of MCT1 focally in the spinal cord is sufficient to produce motoneuron death.
Figure 3. Lentiviral MCT1 shRNA is toxic to motoneurons.
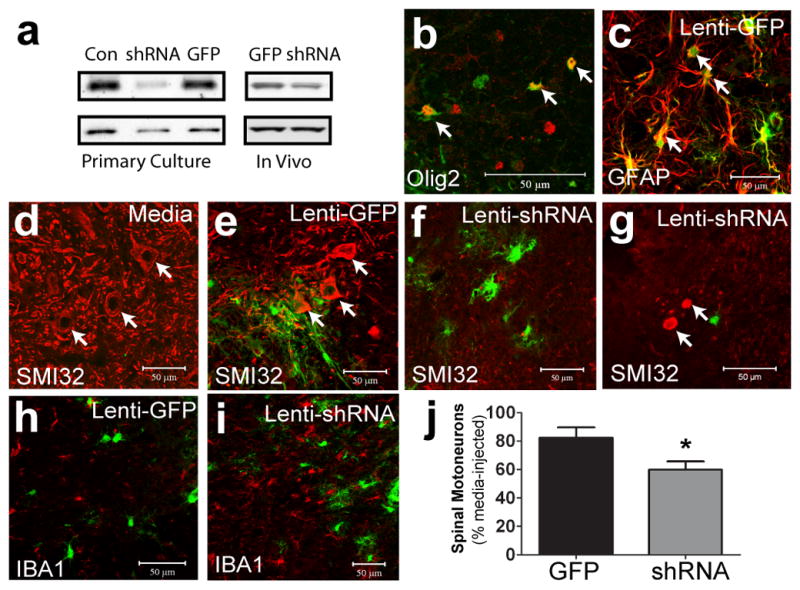
(a) Lenti-shRNA (shRNA) downregulates MCT1 in primary astrocyte cultures and in vivo compared to untreated (Con) or lenti-GFP (GFP). (b,c) Olig2 (b) and glial fibrillary acidic protein (c; GFAP) in lenti-GFP injected spinal cords. (d–f) Non-phosphorylated neurofilament (SMI-32) (red) in spinal cords injected with media (d), Lenti-GFP (e), or Lenti-MCT1 shRNA (f, arrows indicate motoneurons). (g) SMI-32 labels aberrant axonal swellings in lenti-shRNA injected spinal cords. (h,i) Iba1 positive microglia in spinal cords injected with lenti-GFP (h) and lenti-MCT1 shRNA (i). (j) Quantification of cervical spinal motoneurons injected with lenti-GFP (n = 8) or lenti-MCT1 shRNA (n = 10), relative to contralateral media injection (Scale bars = 50 μm. Error bars = ± S.E.M. *p < 0.05).
MCT heterozygote null mice develop CNS axonopathy
MCT1 shRNA treatment was neurotoxic and we postulated that reducing expression of MCT1 in a null mouse would also produce neurodegeneration. Complete absence of MCT1 is embryonically lethal, but heterozygote null mice (MCT1+/−), with ~50% reduction in MCT1, mature and breed normally with no gross phenotypic abnormalities. The mice eventually developed an axonopathy in the brain and spinal cord by 8 months of age, with axon swellings visualized by both light and electron microscopy (EM; Fig. 4 and Supplementary Fig. 9). Interestingly, axon pathology in these mice is similar to CNPase null mice,31 SOD1 transgenic model of ALS,32 and ALS patients.33 Despite the axonopathy and activation of astrocytes, microglia, and NG2-positive cells (Fig. 4 and Supplementary Fig. 9), there was no change in overall myelination in MCT1+/− mice (Supplementary Fig. 9a–f), suggesting that the pathology was not secondary to oligodendrocyte injury.
Figure 4. MCT1 heterozygote null mice develop widespread axonopathy.
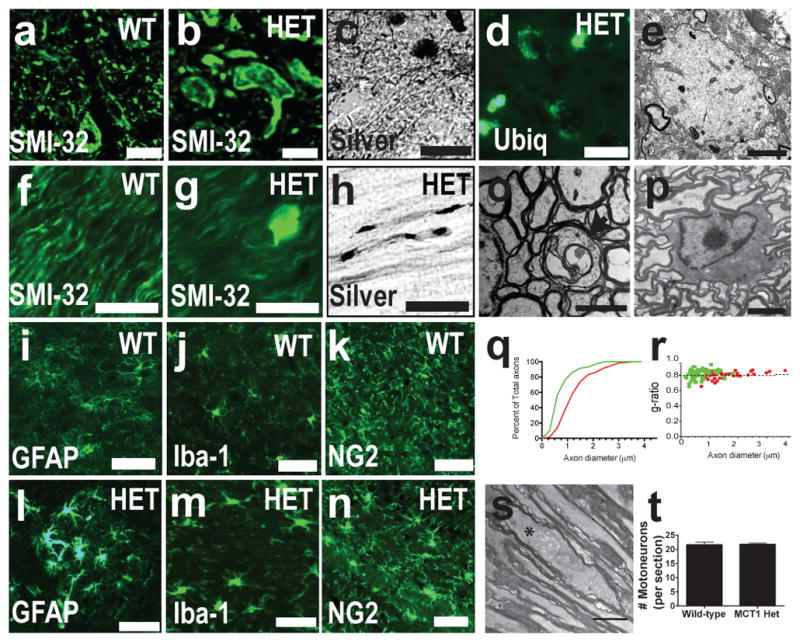
(a–d) Spinal cords of wild-type (WT) and MCT1+/− mice (HET) immunostained for non-phosporylated neurofilament (SMI-32) (a,b), silver stained (c), or immunostained for ubiquitin (d; Scale bars = 20 um). (e) Electron microscopy of axonal spheroid in spinal cord (scale bar = 2 μm). (f–h) Optic nerves of WT and HET mice immunostained for SMI-32 (f,g) or silver stained (h; scale bars = 20 um). (i–n) GFAP (i.l), Iba-1 (j,m), and NG2 (k,n) in WT (i–k) and HET mice (l–n ; Scale bars = 50 um). (o,p) Degenerating axon (o; indicated by arrow, scale bar = 2 μm) and intact oligodendrocyte (p; scale bar = 6 μm) in optic nerve. (q,r) Axon diameter (q) and g ratio (r) in HET (green line/dots ; n=158) and WT (red line/dots ; n=78) mice. (s) Distended mitochondrion (astrerisk) in HET optic nerve. (t) Number of spinal motorneurons per section from WT and HET mice.
In the optic nerve, a pure sample of CNS axons whose function is partly dependent on lactate,34 large and intermediate sized degenerating axons were observed in MCT1+/− mice (Fig. 4o). Overall, 1.74 ± .06 % of optic nerve axons from MCT1+/− mice showed morphologic features of degeneration, including swellings, enlarged mitochondria and reduced axon diameter, which were not seen in age-matched littermate control mice (Fig. 4 and Supplementary Fig. 9). Importantly, oligodendrocyte morphology (Fig. 4p) and number were not changed, nor was myelination as represented by normal g-ratios (Fig. 4r) and intact myelin in non-degenerating axons (Supplementary Fig. 9), again suggesting that axonal degeneration was not due to oligodendrocyte damage or demyelination. Thus, despite only having a partial reduction in MCT1 expression (Supplementary Fig. 9j), adult MCT1+/− mice demonstrate widespread CNS axonopathy. Given the low percentage of axons affected, it is not surprising that this axonopathy did not produce a behavioral phenotype, loss of motoneurons (Fig. 4s), or obvious injury to retinal ganglion cells (Supplementary Fig. 9t,u) in MCT1+/− mice. In summary, MCT1+/− mice develop axon degeneration in the CNS without demyelination or oligodendrocyte injury, suggesting that MCT1 is critical for the normal function of CNS axons through a myelin-independent mechanism.
Oligodendrocyte-specific MCT1 loss causes axonopathy
Though MCT1 is primarily expressed within oligodendroglia in the CNS, it is not exclusive to oligodendroglia and thus we cannot exclude that the axon degeneration seen in MCT1+/− mice is due to downregulating MCT1 in other cell types. To investigate this, we produced two lentiviral constructs that downregulate MCT1 selectively in oligodendroglia through different mechanisms. First, lentiviral constructs were produced that expressed either the same MCT1 shRNA used in Figure 3 and GFP (Lenti-MBP-shRNA) or GFP alone (Lenti-MBP-GFP) driven by the MBP promoter. Lenti-MBP-shRNA downregulated MCT1 protein in the optic nerve (Fig. 5a,b) despite transfecting only a small segment of nerve (Fig. 5c,d). Transfection was selective for oligodendrocyte-lineage cells, as seen by co-localization of all GFP-labelled cells with Olig2 (Fig. 5e,g; arrows) and not astroglia (Fig. 5c,d). At the injection site, there were a few pathologically enlarged SMI32-positive axons in Lenti-MBP-GFP injected optic nerves due to nerve trauma (Fig. 5f; arrowheads), but dramatically more in optic nerves injected with Lenti-MBP-shRNA (Fig. 5h; arrowheads). Distal to the injection, there were increased degenerating axons, both myelin ovoids (arrows) and “dark axons” (asterisks), in Lenti-MBP-shRNA injected optic nerve compared to Lenti-MBP-GFP injected (Fig. 5i–l). Restricted penetration of the lentivirus into the nerve led to some variability in axon degeneration. Nevertheless, there was a significant increase in the number of degenerating fibers in optic nerves injected with Lenti-MBP-shRNA compared to Lenti-MBP-GFP (Fig. 5p,q; n=4 nerves, p<0.05).
Figure 5. Selective downregulation of MCT1 in oligodendroglia produces axonal injury.
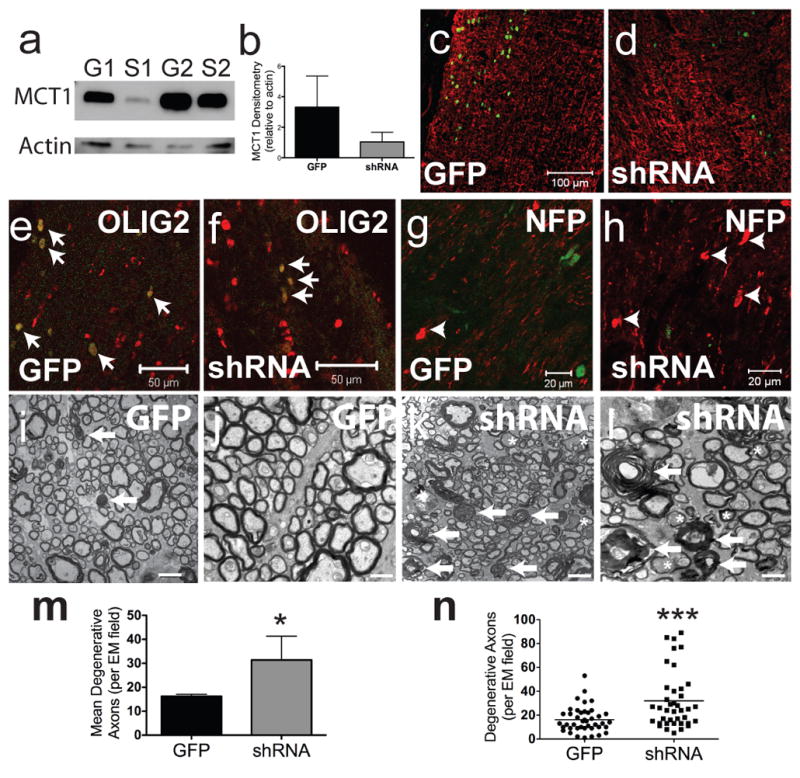
(a,b) Western blot of optic nerves injected with lentivirus expressing MBP-GFP (G) or MBP-MCT1shRNA (S). (c,d) Glial fibrillary acidic protein (GFAP) immunoreactivity in GFP-expressing (GFP) and MCT1shRNA-GFP expressing (shRNA) viruses (scale bars = 100 μm). (e,f) GFP and shRNA viruses co-localize exclusively with Olig2 (scale bars = 50 μm). (g,h) Axon swellings (arrowheads) labelled with SMI-32 following injection of GFP (g) and shRNA (h) viruses (scale bars = 20 μm). (i–l) Low (i,k ; scale bars = 1 μm) and high (j,l; scale bars = 0.5 μm) magnification EM photomicrographs following injection of GFP and shRNA viruses (arrows indicate myelin ovoids and asterisks indicate dark degenerating axons). (m,n) Mean number (m ; n=4 nerves/group) and scatterplot (n ; n=40 fields/group) of degenerative axons per EM field in GFP- and shRNA-injected optic nerves (*p<0.05, ***p<0.001).
We also developed a tamoxifen inducible cre-dependent lentivirus expressing MCT1 shRNA and produced oligodendrocyte-specific MCT1 knockdown by injecting virus into the corpus callosum of PLP-CreER transgenic mice under inducible control by tamoxifen (Supplementary Fig. 10a).35,36 Viral transfection of corpus callosum oligodendroglia was confirmed in control mice by co-localization of GFP with both CC-1 and MCT1 reporter (Supplementary Fig. 10b–g; arrowheads). In tamoxifen-treated PLP-Cre mice, the GFP reporter was excised in oligodendroglia, so specific viral localization of GFP to oligodendroglia is generally not visualized. In the PLP-Cre mice, there was clear axonal degeneration near the injection site, as demonstrated by both SMI32-immunoreactive axon swellings (Supplementary Fig. 14k–m; boxed areas) and axonal beading in GFP labelled axons (Supplementary Fig. 14n), that was not observed when the identical virus was injected into wild type mice (Supplementary Fig. 14h–j). Thus, in vivo oligodendrocyte-specific downregulation of MCT1 in both the optic nerve and corpus callosum was capable of producing axon degeneration. Overall these studies confirm that oligodendrocyte MCT1 is critical for axon survival as loss of lactate transport from oligodendroglia to axons causes axon degeneration in both viral knockdown experiments and MCT1+/− mice.
MCT1 expression reduced in ALS
Recent studies suggest oligodendroglia or their precursors may be injured in mutant SOD1 transgenic mice.18 We hypothesized that reduced ability of gray and white matter oligodendroglia to support motoneurons, by altered MCT1 expression, may contribute to ALS pathogenesis as seen in our in vitro and in vivo studies described above. We investigated the expression level of MCTs and the MCT-associated protein CD147 in affected (i.e., motor cortex) and unaffected (i.e., frontal cortex) regions from ALS and non-ALS patients. In addition, we investigated MCT1 reporter activity in the spinal cord of SOD1G93A transgenic mice, a commonly used model of ALS that had been crossed with BAC-MCT1 td-Tomato reporter mice. Motor cortex of ALS patients showed a greater than 50% decline in MCT1 and MCT4 (p<0.01 and p<0.001, respectively) compared to gender and age-matched control patients (Fig. 6 and Supplementary Table 1). This reduction was not seen in unaffected frontal cortex, nor was it seen for CD147 (also known as basigin), an accessory glycoprotein that increases localization of MCT1 and MCT4 to the plasma membrane (Full blots available in Supplementary Figs. 12 and 13).37 Oligodendroglia were still present in the cortical samples since there was no significant alteration in CNPase (Fig. 6a,b), though it is possible the oligodendroglia were immature.
Figure 6. MCT1 reduced in ALS patients and SOD1G93A mice.

(a) Immunoblots of MCT1 and myelin related proteins from sporadic ALS (sALS) and non-ALS patients. (b– c) (N ≥ 8 for ALS patients and ≥ 6 for non-ALS patients). (d–g) Immunofluorescence of MCT1 reporter alone (d,f) and double-labelled (red) with CC-1 (e,g; green) in endstage SOD1G93A transgenic mice (d,e) and littermate controls (f,g; scale bars = 100 μm). Dashed lines delineate boundary of ventral horn gray matter.
In addition to patients with ALS, downregulation of MCT1 mRNA was also seen in the spinal cords of early symptomatic (Supplementary Fig. 11) and endstage (Fig. 6) SOD1G93A transgenic mice. SOD1G93A transgenic mice were mated to MCT1-BAC mice, and MCT1 mRNA expression evaluated by tdTomato fluorescence. In SOD1G93A transgenic mice, MCT1 reporter continued to exclusively label oligodendroglia throughout the brain, though there was a dramatic reduction in MCT1 expression in the ventral horn grey matter (outlined by dashes; Fig. 6d,e) as compared to age-matched control mice (Fig. 6f,g). Reduced MCT1 reporter expression was not due to less oligodendroglia, since CC-1-positive oligodendroglia were preserved, though again CC-1 immunoreactivity may not be labelling fully mature oligodendroglia (Fig. 6e). Taken together, these results suggest that alterations in oligodendrocyte MCT1 may contribute to motoneuron degeneration in ALS, and provide a human disease in which downregulation of MCT1 is associated with neurodegeneration.
Discussion
Our results suggest that oligodendroglia support of axons, through MCT1 based transport of lactate (or pyruvate), is critical for maintaining axon function and neuron survival and appears to be a fundamental property of oligodendroglia. Disruption of MCT1 could hypothetically cause either reduced lactate export out of, or import into, oligodendroglia since the direction of transport is determined by the relative intra- and extra-cellular concentrations of lactate and hydrogen ions.6 Our results suggest primarily disruption of lactate export. First, exogenous lactate completely prevents cell loss in organotypic cultures by compensating for reduced lactate export. Second, oligodendroglia do not degenerate in MCT1+/− mice or when exposed to MCT1 inhibitor and glucose deprivation in organotypic spinal cord cultures. Third, our study and others 10 demonstrate that MCT1 is predominantly localized to the myelin sheath around CNS axons, as expected for a transporter from oligodendroglia to axons. Taken together, our results suggest that MCT1-regulated lactate export from oligodendroglia is a critical component of the local energy supply to axons and the disruption of this transport leads to axon dysfunction and ultimately neuron degeneration. Oligodendrocyte support of axons was also suggested by a recent paper that found elevated brain lactate in transgenic mice with a selective deficit in oligodendroglia mitochondrial function.5 Of course, lactate may also be imported into oligodendroglia and contribute to the production of myelin, as has been shown in dissociated38 and cortical slice cultures,39 but attenuation of MCT1 does not appear to cause neuron or axon degeneration through this mechanism.
Our results contribute to the emerging data that oligodendroglia are implicated in ALS. Spinal cord ventral grey matter oligodendrocyte precursor cells dramatically replicate in ALS mouse models,18 possibly in response to oligodendroglial injury (unpublished data), and cytoplasmic inclusion are found in human ALS oligodendroglia.40 We found that MCT1 is reduced in affected brain regions from ALS patients and the ventral horn of the spinal cord in mutant SOD1 transgenic mice. These changes could reflect downregulation of the transporter within intact oligodendroglia, or perhaps death of oligodendroglia and replacement with immature oligodendroglia. Newly generated oligodendroglia, labelled with CC-1, do not contain MCT1 (Fig. 6) and therefore would be unable to supply energy metabolites to axons, leading to axon injury and neuron loss. We hypothesize that this mechanism contributes to motoneuron degeneration in ALS. Future experiments will investigate this specifically by determining if MCT1 downregulation is specific for ALS and whether MCT1 upregulation or transplantation of oligodendroglia can prolong survival in ALS mouse models.
Methods Summary
BAC-MCT1 mice were developed and MCT1 expression localized to specific cells by crossing with cell specific reporter lines, immunostaining for cell-specific markers, or isolating mRNA by FACS and BacTRAP. Critical function of oligodendrocyte MCT1 was evaluated in vitro in organotypic spinal cord cultures, in vivo in MCT1+/− mice or wild-type mice injected with lentiviral vectors. Neuronal toxicity, measured by loss of neurofilament-containing neurons and incorporation of PI, was provoked in organotypic cultures by treating with ASO or MCT1i. MCT1+/− mice were evaluated by histology, immunohistochemistry, and EM, and compared to littermate controls. For lentiviral experiments, MCT1shRNA was subcloned into lentivirus plasmid along with 3 different promoters (i.e., H1, myelin basic protein (MBP), and Cre-dependent H1). H1-MCT1shRNA lentivirus was injected into the spinal cord of C57Bl6 wild-type mice and motoneurons in the vicinity of virus were counted and compared to control virus injections. MBP-MCT1shRNA was injected into the optic nerve of Sprague –Dawley rats and degenerating axons quantified by EM and compared to the contralateral optic nerve injected with control virus. Cre-dependent H1-MCT1shRNA lentivirus was injected into the corpus callosum of PLP-Cre mice and axon pathology by non-phosphorylated neurofilament immunostaining. Finally, MCT1 expression was evaluated by Western blots of cortex from ALS patients and non-ALS controls; and MCT1 expression in SOD1G93A transgenic mice, obtained from Jackson laboratories, was evaluating by crossing these mice to MCT1 BAC reporter mice.
METHODS
Development of MCT1 BAC Reporter and MCT1 overexpressor mice
BAC MCT1 tdTomato reporter mice were produced as described previously.22 The BAC construct was modified to include the entire 19.8kb MCT1 gene plus 50kb upstream of the first exon and 132.2kb downstream of the last exon (Supplementary Fig. 2a). Founder lines were identified by PCR (primer pair was 5′-CGAGGAGGTCATCAAAGAGT-3′ and 5′-AGAACTTGAGGTGGTCCATC-3′) and also by tdTomato fluorescence within red blood cells. Two expression lines were produced and backcrossed with B6 or C57BL/6 wild-type mice. To produce MCT1 overexpressor mice, the promoter for the astrocyte-specific gene, glial fibrillary acidic protein (GFAP), was used to drive MCT-1 overexpression specifically in astrocytes,41 was inserted between the GFAP promoter sequence and an internal ribosomal entry site (IRES)-eGFP sequence, resulting in expression of MCT-1 and eGFP together in astrocytes. Six founder lines were generated, of which five expressed MCT-1 and eGFP within CNS astrocytes.
Generation of lines coexpressing MCT1 BAC reporter and other transgenes
BAC GLT1 eGFP,22 BAC MOBP eGFP (GENSAT), PLP-eGFP (Jackson laboratory), PLP-CreER (Jackson laboratory), CNP-EGFP/Rpl10a (Jackson Laboratory), Aldh1L1 (GENSAT), Thy-I YFP (Jackson laboratory), and SOD1 G93A transgenic mice (Jackson laboratory) were crossed with BAC MCT1 reporter mice to establish double transgenic mice.
Fluorescent activated cell sorting (FACS), real-time RT PCR, RT-PCR, and BacTRAP
Brains from 1 month old BAC MCT1 tdTomato reporter mice were prepared as described previously.42 Cells were sorted into three groups with a MoFlo MLS high speed cell sorter (Beckman coulter) running Summit version 4.3 software in the FACS core at The Johns Hopkins University. Total RNA prepared from sorted cells and tissue using Absolutely RNA Miniprep Kit (Stratagene, La Jolla, CA) was converted to cDNA using cDNA synthesis kit (Applied Biosystems, Foster city, CA). PCR for MCT1 or GAPDH (control) was completed using the following primer pairs, respectively: (5′-AAAATGCCACCTGCGATTG GA-3′ and 5′-GCCTGATTAAGTGGAGCCAGG-3′), or (5′-TTGCCATCAATGACCCCTTCA -3′ and 5′-CGCCCCACTTGATTTTGGA -3′). TaqMan premade gene-specific probes and 18srRNA (as a control) were used for real time RT-PCR. For the FACS isolation of oligodendroglia and astrocytes in the brains, young adult BAC MOBP eGFP- and BAC GLT1 eGFP- mice (1–2 month) were used as described previously.42 For affinity purification of polysomal mRNAs from oligodendroglia and astrocytes in the brain, adult CNP BacTRAP (translating ribosome affinity purification)- and ALDH BacTRAP- mice were used, respectively, as described previously.43
Primary antibodies for Western blots and immunohistochemistry
Detailed protocols for Western blots and immunohistochemistry are described below. The following primary antibodies were used for Western blots: MCT1-human (AbGent; 1:75), MCT1-mouse (Santa Cruz; 1:50), MCT4 (Millipore; 1:400), CD147 (Novus Biologicals; 1:500), CNPase (Millipore; 1:1000), Connexin 43 (Millipore; 1: 500), and β-actin (Millipore; 1:1000). The following primary antibodies were used for immunofluorescence: mouse MCT-1 (Santa Cruz; 1:50), human MCT-1 (Santa Cruz; 1:50), Olig2 (Millipore; 1:500), CC-1 (Calbiochem; 1:50), CNPase (Millipore; 1:250), MBP (Covance; 1:250), PDGFRα (BD Pharmingen; 1:100), NG2 (Millipore; 1:100), GFAP (Dako; 1:2000), Iba1 (Wako; 1:250), NeuN (Millipore; 1:250), SMI-32 (Covance; 1:1000) Ubiquitin (Millipore; 1:250), Caspr (from Bergles’ lab; 1:1500), Nav1.6 (from Bergles’ lab; 1:100), DsRed (Clontech;1:250), Tuj1 (Millipore, 1:1000), NeuN (Millipore (1:1000), ALDH1L1 (Neuromab/UC Davis, 1:10), and Iba1 (Wako, 1:500).
Lactate uptake assay in oligodendroglioma and astrocytoma cell lines
MO3.13 oligodendroglioma and U87 astrocytoma cell lines are cultured as described in previous reports.44,45 Lactate uptake assay was completedas described previously46 with only small modifications. In brief, cells were incubated with 0.5 μCi/mL L-[1-14C] lactic acid (Perkin-Elmer, Boston MA, USA) in HEPES-buffered, Earl’s balanced salt solution (HEBSS) buffer, pH 6.0, containing150mM NaCl, 5mM KCl, 1mM KH2PO4, 0.2mM CaCl2.2H2O, 3.3mM MOPS, 10mM HEPES, 1mM MgSO4.7H2O. After incubation, uptake was stopped by quickly chilling the cultures to 4 °C. Cells were washedwith ice-cold HEPES buffer, homogenized in 0.1N aOH and 0.1% Triton X100, and centrifuged at 13000rpm for 10 minutes. Radioactivity was measured byscintillation counting and corrected by protein amount.
Immunohistochemistry, histology, light and electron microscopy
Mice were anesthetized with isoflurane/oxygen and perfused transcardially with 1X PBS followed by 4% paraformaldehyde in PBS (for light microscopy [LM]) or 4% paraformaldehyde/2.5 % glutaraldehyde in PBS (for electron microscopy [EM]), tissue collected, and either cryoprotected in graded concentrations of sucrose and sectioned at 20 μm on a Leica CM1900 cryostat (for LM) or embedded in Epon resin after postfixing in osmium tetroxide (for EM).
To assess neuropathology by light microscopy, tissue sections were stained with hematoxylin and eosin (H&E), Eriochrome staining, Bielschowsky silver staining, or immunohistochemistry (IHC). For lectin staining of endothelial cells, biotinylated Lycopersicon esculentum lectin (1:200 dilution; B-1175; Vector Laboratories, Burlingame, CA, USA) was incubated with sections for 1 hour. As a secondary antibody, sections were incubated in Streptavidin-488 (1:100 dilution; B-1175; Vector Laboratories, Burlingame, CA, USA). For IHC of MCT1, tissue slices were pre-treated with sodium citrate buffer (10mM Sodium Citrate, 0.05% Tween 20, pH 6.0) for antigen retrieval (other primary antibodies did not require antigen retrieval) prior to 1 hour incubation at room temperature in blocking buffer (0.3% BSA, 5% Skim milk, and 0.3% Triton-X 100 in PBS). Primary antibodies were incubated overnight at 4°C, washed and then incubated for 2 hours at room temperature in anti-mouse or anti-rabbit IgG Alexa-fluor secondary antibodies (Invitrogen; 1:200). Photomicrographs were taken on Zeiss LSM510 Meta confocal microscopy or Zeiss Image Z1 fluorescent microscopy. Co-labeled cells with either immunostaining or transgenic reporters were manually counted in Axiovision from digital images taken by fluorescent microscopy. For EM, 1 mm thick sections were stained for toluidine blue and examined under light microscopy with 100X oil-immersion objective. 70 nm thin sections were obtained and stained for citrate/uranyl acetate. For quantification of axon degeneration in the optic nerves of MCT1 heterozygous mice and mice treated with lenti-MBP-shRNA, 3 and 10 7000x electron micrographs, respectively, were acquired for each optic nerve using a Zeiss Libra transmission electron microscope. Total number of axons and degenerating axons, as defined by degenerating myelin or dark axons, on each electron micrograph were counted and percentage axonal degeneration calculated. All quantification was completed by an investigator blinded to the genotype or treatment group.
Production of cell cultures
Oligodendrocyte cultures were produced from PND 2–3 mouse cortical tissues of PLP eGFP × NG2-tdTomato double transgenic mice. In brief, oligodendrocyte progenitor cells (OPC) were isolated by FACS and maintained in OPC culture medium (SATO medium containing PDGFα) for 4 days. OPC were further differentiated into mature oligodendroglia in the differentiation media (SATO media containing T3 without PDGFα).
Primary astrocyte cultures were produced from PND 2–3 mouse pups. Cortices were dissected out and dissociated with papain and subsequently cultured on collagen-coated T75 flask in DMEM containing 10 % fetal bovine serum (FBS). At DIV14 astroglial cells were seeded into collagen-coated 6-well plates at a concentration of 7×10⁵ cells/well.
Organotypic or cortical spinal cord cultures were produced from PND 7 Sprague-Dawley rat pups or MCT1 tdTomato reporter mice, as described previously.47
Anti-sense oligonucleotides or MCT1i treatment in organotypic spinal cord cultures
One week after plating organotypic spinal cord cultures, 5 μM MCT1 ASO (IDT) or various doses of MCT1i was added to media for 3 weeks. Sections were either visualized with propidium iodide (PI, 7.5μM, 2 hrs, Sigma) or fixed with 4% paraformaldehyde, and immunostained with the neuronal marker SMI-32 (Covance, 1:1000). Large, ventral horn SMI-32-positive neurons were counted by an investigator blinded to the treatment condition.
MCT1i and glucose deprivation in organotypic spinal cord cultures
Two weeks after collection, cultures were pre-treated with MCT1i27 or DMSO for 24 hrs, incubated in propidium iodide for 2 hours, and then photographed on a Nikon epifluorescence scope (Pre-treatment). Sections were then washed, incubated with glucose-free or normal buffer ± MCT1i for 2 hrs, allowed to recover for 2 hrs, re-incubated with PI for 2 hours, and photographed images quantified by fluorescent intensity (Post-treatment). To examine motoneuron loss, sections were returned to normal media for two weeks, fixed in 4% paraformaldehyde, and immunostained with SMI-32 (Covance, 1:1000). To study cellular localization of PI, sections were immediately fixed in 4% paraformaldehyde and then processed for immunocytochemistry with primary antibodies. Secondary antibodies used for detection were AlexaFluor 488-conjugated goat anti-rabbit, anti-mouse, or anti-chicken antibodies (Invitrogen, 1:1000).
Organotypic spinal cord cultures treated with bicuculline or glutamate
For bicuculline (BIC) experiment, spinal cord slice cultures (2 weeks post-culture) were treated with 100uM BIC (or vehicle) in the presence or absence of 1mM MCT1i for 3 days. To measure cell death, cultures were incubated with PI and then photographed on a Nikon epifluorescence scope. For glutamate experiment, spinal cord cultures were incubated with MCT1i (or DMSO vehicle for controls) for 24 hours, followed by media with or without 250uM glutamate buffer for 60 minute. PI staining was performed before and after the glutamate treatment to visualize dead cells. For quantification, fluorescent intensities of pre-treatment sections measured by Image J software for the dorsal horn in BIC treated sections, and total spinal cord in glutamate treated sections, were subtracted from post-treatment sections. All values were normalized to untreated control sections.
Production of lentiviral constructs
Based on pre-designed ON-TARGETplus SMARTPool siRNA sequences (Dharmacon), DNA oligos that contain MCT1-shRNA sequences were synthesized and directly subcloned into pSuper vector (Oligoengine, Inc.). The sense and antisense oligo sequences for the most efficient MCT1-shRNA were as follows: 5′-GATCCCC GTATCATGCTTTACGATTATTCAAGAGATAATCGTAAAGCATGATACTTTTTTC-3′ 5′-TCGAGAAAAAAGTATCATGCTTTACGATTATCTCTTGAATAATCGTAAAGCATGATACGGG-3′ DNA fragments spanning the H-1 promoter and the shRNA sequences in pSuper construct were amplified by PCR and subcloned into FUGW-CMV to produce Lenti-shRNA. Fragments spanning MBP promoter, shRNA, and IRES-EGFP sequences were subcloned into FUGW-CMV to produce Lenti-MBP-shRNA. MCT1 shRNA was subcloned into the HpaI and XhoI restriction sites of pSico (Addgene) to produce Cre-inducible lentivirus. Lentiviral constucts, including control GFP constructs, were produced in HEK 293 T cells using the FUGW-CMV/Δ8.9/VSVG system.
MCT1-shRNA Lentivirus injected into spinal cord
Unilateral injections of LV-MCT1shRNA (n = 10) or LV-GFP (n = 8) were performed in C57BL6 wild-type mice at 100 days-of-age at C4, C5, and C6, delivering 1.7 × 10⁵ PFU for LV-GFP or 1.8 × 10⁵ PFU for LV-MCT1shRNA per mouse. Briefly, the transverse processes of C4 to C6 were removed, the dura removed, and three 1 μl injections of lentivirus or media were injected with a 34 gauge Hamilton syringe needle. Animals were sacrificed after 4 weeks by transcardial perfusion with 4% paraformaldehyde. Spinal cord sections were cryoprotected, sectioned on a cryostat, and immunostained for neurofilaments (SMI-32), oligodendrocyte-lineage cells (Olig2), microglia (Iba1), or astrocytes (GFAP), as described above. Large (diameter greater than 20 um) neurofilament-containing neurons in the ventral spinal cord were counted from every third section that localized GFP to the ventral horns on both the virus- and media-injected halves of the spinal cord (mean number of sections counted 11.9 for shRNA group and 12 for GFP group). For each animal, the mean number of motoneurons per section from the virus-injected spinal cord hemisection was divided by the mean number of motoneurons per section from the contralateral media-injected motor neurons per section.
Generation of MCT1 heterozygote null mice
MCT1 heterozygote null mice were generated by targeted homologous recombination to replace a 640 base pair sequence of the MCT1 gene starting at the translation initiation codon and containing exon 1 as well as part of the first intron with the LacZ gene sequence fused with a neomycin (Neo) resistance gene sequence and put in frame with the MCT1 promoter (S. Lengacher et al., manuscript in preparation). Successful recombination event and proper insertion of the LacZ/Neo sequence in the targeted locus was controlled by Southern blot on DNA from embryonic stem cells previously electroporated with the targeted vector and selected with gancyclovir and G418. Genotyping of animals was performed by PCR with appropriate set of primers.
MCT1 shRNA driven by MBP promoter injected into rat optic nerves
Sixty day old Sprague Dawley rats were anesthetized with 2 % isofluorane, an incision placed in the scalp overlying the orbital ridge, the skin overlying the orbital ridge retracted, and a conjunctival suture placed to provide traction to the globe. The optic nerve was localized, a window cut in the overlying dura, the nerve pierced with a pulled micropipette, and each nerve infused with 3 μl of either lenti-MBP-shRNA or lenti-MBP-GFP (2.4 × 10¹¹ virus particles (VP)/ml). After 4 weeks, the rats were transcardially perfused with 4% paraformaldehyde and the optic nerves from the globe to the optic chiasm carefully dissected. The optic nerve near the injection site was post-fixed in 4% paraformaldeyde, cryoprotected in 25% sucrose and cut on a cryostat. These nerve segments were later immunostained with Olig2, GFAP, and SMI32. Optic nerve distal to the injection was post-fixed in 4% paraformaldehyde/2.5% glutaraldehyde for 3 days and then processed for EM as described above.
Cre-dependent MCT1 shRNA Lentivirus injected into corpus callosum
Cre-inducible MCT1 shRNA lentivirus was injected bilaterally into the corpus callosum of PLP-CreER,36 MCT1 tdTomato reporter, and wild-type mice at approximately 60 days of age. Mice were anesthetized with ketamine and xylazine, placed in a stereotaxic device, and the corpus callosum injected bilaterally with 2 μl lentivirus (2.6 × 10¹¹ VP/ml), as previously described.48 After 1 week, mice were injected intraperitoneally with 1 mg tamoxifen for 5 consecutive days to induce Cre recombination of nucleus-integrated virus. Mice were sacrificed 4 weeks later by transcardial perfusion with 4% paraformaldehyde. Sections were cryoprotected, sectioned on a cryostat, and immunostained for neurofilaments (SMI-32) and green fluorescent protein (GFP), as described above.
Western blotting of human autopsy samples, primary cells and mouse tissues
Autopsy samples were obtained from the Johns Hopkins University Brain Resource Center and the Johns Hopkins ALS Tissue Bank. Human or mouse samples were homogenized in TBS with 0.1% SDS, 1% triton and 10% glycerol, primary cultures were lysed as described previously.49 Western blotting and densitometry was performed using the enhanced chemilluminescence (ECL) system (GE Healthcare) and NIH Image J.
Statistics
In-vitro ASO and MCT1i experiments were analyzed using one-way ANOVA followed by Tukey-Kramer post hoc test. Western blots, real-time RT PCR, and in-vivo LV-MCT1shRNA quantifications were analyzed using unpaired Student’s t-tests. Quantification of axon degeneration in lentivirus injections of optic nerve was evaluated with a Mann Whitney test.
Supplementary Material
Acknowledgments
We thank C. Coccia, S. Vidensky, I. Shats, L. Chakravarti, Y. Ayukawa, L. Mamedova for technical support; E. Potter for oligodendrocyte cultures, C. Cooke for EM, and S. Kang and D. Bergles for providing BAC MOBP-eGFP and CNP BacTrap mice, Caspr and Nav1.6 antibodies. Autopsy specimens were provided by the Johns Hopkins ALS Tissue Bank and the Johns Hopkins University Brain Resource Center supported by NIH grants P50AG05146 and PO1NS16375. Support was provided by the Muscular Dystrophy Association (B.M.M. and Youngjin L.), NIH-NS33958 (J.D.R.), P2ALS (J.D.R.), Packard Center for ALS (J.D.R.), Human Frontier Science Program-RG118/1998-B (L.P.), Swiss Fonds National de Recherche Scientifique-31003A-125063 (L.P.), Swiss National Science Foundation (FNRS)-3100AO-108336/1 (P.J.M.), Biaggi and Puccini Foundations (P.J.M). We dedicate this manuscript to Dr. John W. Griffin who passed away while this manuscript was under revision. We are forever grateful for his contributions to this manuscript and mentorship to many of the authors on this paper.
Footnotes
Author Contributions
All of the authors contributed to the design of the experiments. MCT1 BAC Reporter experiments were designed and performed by Youngjin L., L.J., and P-W.Z. MCT-ASO, MCT1i, and human Western blot experiments were designed and performed by B.M.M., Yun.L., A.T., Yiting.L., and J.D.R. Lentiviral experiments were designed and performed by Youngjin L., B.M.M., Yun L., and J.D.R. The MCT1 heterozygote null mice were produced by S.L., L.P., and P.M, and analyzed by Youngjin L. EM work completed by M.H.F., Youngjin L., B.M.M., and J.D.R. Optic nerve lentiviral injections performed by P.N.H. The manuscript and figures were prepared by B.M.M. and J.D.R. with input from co-authors.
Competing interests statement: Authors have no competing interests.
References
- 1.Trapp BD, et al. Axonal transection in the lesions of multiple sclerosis. N Engl J Med. 1998;338:278–285. doi: 10.1056/NEJM199801293380502. [DOI] [PubMed] [Google Scholar]
- 2.Garbern JY, et al. Patients lacking the major CNS myelin protein, proteolipid protein 1, develop length-dependent axonal degeneration in the absence of demyelination and inflammation. Brain. 2002;125:551–561. doi: 10.1093/brain/awf043. [DOI] [PubMed] [Google Scholar]
- 3.Griffiths I, et al. Axonal swellings and degeneration in mice lacking the major proteolipid of myelin. Science. 1998;280:1610–1613. doi: 10.1126/science.280.5369.1610. [DOI] [PubMed] [Google Scholar]
- 4.Lappe-Siefke C, et al. Disruption of Cnp1 uncouples oligodendroglial functions in axonal support and myelination. Nat Genet. 2003;33:366–374. doi: 10.1038/ng1095. [DOI] [PubMed] [Google Scholar]
- 5.Funfschilling U, et al. Glycolytic oligodendrocytes maintain myelin and long-term axonal integrity. Nature. 2012;485:517–521. doi: 10.1038/nature11007. [DOI] [PMC free article] [PubMed] [Google Scholar]
- 6.Pierre K, Pellerin L. Monocarboxylate transporters in the central nervous system: distribution, regulation and function. J Neurochem. 2005;94:1–14. doi: 10.1111/j.1471-4159.2005.03168.x. [DOI] [PubMed] [Google Scholar]
- 7.Koehler-Stec EM, Simpson IA, Vannucci SJ, Landschulz KT, Landschulz WH. Monocarboxylate transporter expression in mouse brain. Am J Physiol. 1998;275:E516–524. doi: 10.1152/ajpendo.1998.275.3.E516. [DOI] [PubMed] [Google Scholar]
- 8.Pierre K, Pellerin L, Debernardi R, Riederer BM, Magistretti PJ. Cell-specific localization of monocarboxylate transporters, MCT1 and MCT2, in the adult mouse brain revealed by double immunohistochemical labeling and confocal microscopy. Neuroscience. 2000;100:617–627. doi: 10.1016/s0306-4522(00)00294-3. [DOI] [PubMed] [Google Scholar]
- 9.Halestrap AP, Price NT. The proton-linked monocarboxylate transporter (MCT) family: structure, function and regulation. Biochem J. 1999;343(Pt 2):281–299. [PMC free article] [PubMed] [Google Scholar]
- 10.Rinholm JE, et al. Regulation of oligodendrocyte development and myelination by glucose and lactate. J Neurosci. 2011;31:538–548. doi: 10.1523/JNEUROSCI.3516-10.2011. [DOI] [PMC free article] [PubMed] [Google Scholar]
- 11.Pellerin L, Magistretti PJ. Glutamate uptake into astrocytes stimulates aerobic glycolysis: a mechanism coupling neuronal activity to glucose utilization. Proc Natl Acad Sci U S A. 1994;91:10625–10629. doi: 10.1073/pnas.91.22.10625. [DOI] [PMC free article] [PubMed] [Google Scholar]
- 12.Walz W, Mukerji S. Lactate production and release in cultured astrocytes. Neurosci Lett. 1988;86:296–300. doi: 10.1016/0304-3940(88)90499-5. [DOI] [PubMed] [Google Scholar]
- 13.Pellerin L, et al. Evidence supporting the existence of an activity-dependent astrocyte-neuron lactate shuttle. Dev Neurosci. 1998;20:291–299. doi: 10.1159/000017324. [DOI] [PubMed] [Google Scholar]
- 14.Berthet C, et al. Neuroprotective role of lactate after cerebral ischemia. J Cereb Blood Flow Metab. 2009;29:1780–1789. doi: 10.1038/jcbfm.2009.97. [DOI] [PubMed] [Google Scholar]
- 15.Suzuki A, et al. Astrocyte-neuron lactate transport is required for long-term memory formation. Cell. 2011;144:810–823. doi: 10.1016/j.cell.2011.02.018. [DOI] [PMC free article] [PubMed] [Google Scholar]
- 16.Benarroch EE. Oligodendrocytes: Susceptibility to injury and involvement in neurologic disease. Neurology. 2009;72:1779–1785. doi: 10.1212/WNL.0b013e3181a6b123. [DOI] [PubMed] [Google Scholar]
- 17.Yamanaka K, et al. Astrocytes as determinants of disease progression in inherited amyotrophic lateral sclerosis. Nat Neurosci. 2008;11:251–253. doi: 10.1038/nn2047. [DOI] [PMC free article] [PubMed] [Google Scholar]
- 18.Kang SH, Fukaya M, Yang JK, Rothstein JD, Bergles DE. NG2+ CNS glial progenitors remain committed to the oligodendrocyte lineage in postnatal life and following neurodegeneration. Neuron. 2010;68:668–681. doi: 10.1016/j.neuron.2010.09.009. [DOI] [PMC free article] [PubMed] [Google Scholar]
- 19.Pellerin L, Pellegri G, Martin JL, Magistretti PJ. Expression of monocarboxylate transporter mRNAs in mouse brain: support for a distinct role of lactate as an energy substrate for the neonatal vs. adult brain. Proc Natl Acad Sci U S A. 1998;95:3990–3995. doi: 10.1073/pnas.95.7.3990. [DOI] [PMC free article] [PubMed] [Google Scholar]
- 20.Chiry O, et al. Expression of the monocarboxylate transporter MCT1 in the adult human brain cortex. Brain Res. 2006;1070:65–70. doi: 10.1016/j.brainres.2005.11.064. [DOI] [PubMed] [Google Scholar]
- 21.Gerhart DZ, Enerson BE, Zhdankina OY, Leino RL, Drewes LR. Expression of monocarboxylate transporter MCT1 by brain endothelium and glia in adult and suckling rats. Am J Physiol. 1997;273:E207–213. doi: 10.1152/ajpendo.1997.273.1.E207. [DOI] [PubMed] [Google Scholar]
- 22.Regan MR, et al. Variations in promoter activity reveal a differential expression and physiology of glutamate transporters by glia in the developing and mature CNS. J Neurosci. 2007;27:6607–6619. doi: 10.1523/JNEUROSCI.0790-07.2007. [DOI] [PMC free article] [PubMed] [Google Scholar]
- 23.Zhou Q, Wang S, Anderson DJ. Identification of a novel family of oligodendrocyte lineage-specific basic helix-loop-helix transcription factors. Neuron. 2000;25:331–343. doi: 10.1016/s0896-6273(00)80898-3. [DOI] [PubMed] [Google Scholar]
- 24.Hanu R, McKenna M, O’Neill A, Resneck WG, Bloch RJ. Monocarboxylic acid transporters, MCT1 and MCT2, in cortical astrocytes in vitro and in vivo. Am J Physiol Cell Physiol. 2000;278:C921–930. doi: 10.1152/ajpcell.2000.278.5.C921. [DOI] [PubMed] [Google Scholar]
- 25.Pellerin L, Bergersen LH, Halestrap AP, Pierre K. Cellular and subcellular distribution of monocarboxylate transporters in cultured brain cells and in the adult brain. J Neurosci Res. 2005;79:55–64. doi: 10.1002/jnr.20307. [DOI] [PubMed] [Google Scholar]
- 26.Bergersen L, Rafiki A, Ottersen OP. Immunogold cytochemistry identifies specialized membrane domains for monocarboxylate transport in the central nervous system. Neurochem Res. 2002;27:89–96. doi: 10.1023/a:1014806723147. [DOI] [PubMed] [Google Scholar]
- 27.Murray CM, et al. Monocarboxylate transporter MCT1 is a target for immunosuppression. Nat Chem Biol. 2005;1:371–376. doi: 10.1038/nchembio744. [DOI] [PubMed] [Google Scholar]
- 28.Suh SW, et al. Astrocyte glycogen sustains neuronal activity during hypoglycemia: studies with the glycogen phosphorylase inhibitor CP-316,819 ([R-R*,S*]-5-chloro-N-[2-hydroxy-3-(methoxymethylamino)-3-oxo-1-(phenylmet hyl)propyl]-1H-indole-2-carboxamide) J Pharmacol Exp Ther. 2007;321:45–50. doi: 10.1124/jpet.106.115550. [DOI] [PubMed] [Google Scholar]
- 29.Heyer EJ, Nowak LM, Macdonald RL. Membrane depolarization and prolongation of calcium-dependent action potentials of mouse neurons in cell culture by two convulsants: bicuculline and penicillin. Brain Res. 1982;232:41–56. doi: 10.1016/0006-8993(82)90609-6. [DOI] [PubMed] [Google Scholar]
- 30.Mayer ML, Westbrook GL. Mixed-agonist action of excitatory amino acids on mouse spinal cord neurones under voltage clamp. J Physiol. 1984;354:29–53. doi: 10.1113/jphysiol.1984.sp015360. [DOI] [PMC free article] [PubMed] [Google Scholar]
- 31.Edgar JM, et al. Early ultrastructural defects of axons and axon-glia junctions in mice lacking expression of Cnp1. Glia. 2009;57:1815–1824. doi: 10.1002/glia.20893. [DOI] [PubMed] [Google Scholar]
- 32.Morrison BM, Shu IW, Wilcox AL, Gordon JW, Morrison JH. Early and selective pathology of light chain neurofilament in the spinal cord and sciatic nerve of G86R mutant superoxide dismutase transgenic mice. Exp Neurol. 2000;165:207–220. doi: 10.1006/exnr.2000.7457. [DOI] [PubMed] [Google Scholar]
- 33.Kusaka H, Hirano A. Fine structure of anterior horns in patients without amyotrophic lateral sclerosis. J Neuropathol Exp Neurol. 1985;44:430–438. doi: 10.1097/00005072-198507000-00006. [DOI] [PubMed] [Google Scholar]
- 34.Tekkok SB, Brown AM, Westenbroek R, Pellerin L, Ransom BR. Transfer of glycogen-derived lactate from astrocytes to axons via specific monocarboxylate transporters supports mouse optic nerve activity. J Neurosci Res. 2005;81:644–652. doi: 10.1002/jnr.20573. [DOI] [PubMed] [Google Scholar]
- 35.Ventura A, et al. Cre-lox-regulated conditional RNA interference from transgenes. Proc Natl Acad Sci U S A. 2004;101:10380–10385. doi: 10.1073/pnas.0403954101. [DOI] [PMC free article] [PubMed] [Google Scholar]
- 36.Doerflinger NH, Macklin WB, Popko B. Inducible site-specific recombination in myelinating cells. Genesis. 2003;35:63–72. doi: 10.1002/gene.10154. [DOI] [PubMed] [Google Scholar]
- 37.Kirk P, et al. CD147 is tightly associated with lactate transporters MCT1 and MCT4 and facilitates their cell surface expression. EMBO J. 2000;19:3896–3904. doi: 10.1093/emboj/19.15.3896. [DOI] [PMC free article] [PubMed] [Google Scholar]
- 38.Sanchez-Abarca LI, Tabernero A, Medina JM. Oligodendrocytes use lactate as a source of energy and as a precursor of lipids. Glia. 2001;36:321–329. doi: 10.1002/glia.1119. [DOI] [PubMed] [Google Scholar]
- 39.Rinholm JE, et al. Regulation of oligodendrocyte development and myelination by glucose and lactate. J Neurosci. 2011;31:538–548. doi: 10.1523/JNEUROSCI.3516-10.2011. [DOI] [PMC free article] [PubMed] [Google Scholar]
- 40.Seilhean D, et al. Accumulation of TDP-43 and alpha-actin in an amyotrophic lateral sclerosis patient with the K17I ANG mutation. Acta Neuropathol. 2009;118:561–573. doi: 10.1007/s00401-009-0545-9. [DOI] [PubMed] [Google Scholar]
- 41.Brenner M, Kisseberth WC, Su Y, Besnard F, Messing A. GFAP promoter directs astrocyte-specific expression in transgenic mice. J Neurosci. 1994;14:1030–1037. doi: 10.1523/JNEUROSCI.14-03-01030.1994. [DOI] [PMC free article] [PubMed] [Google Scholar]
- 42.Yang Y, et al. Molecular comparison of GLT1+ and ALDH1L1+ astrocytes in vivo in astroglial reporter mice. Glia. 2011;59:200–207. doi: 10.1002/glia.21089. [DOI] [PMC free article] [PubMed] [Google Scholar]
- 43.Doyle JP, et al. Application of a translational profiling approach for the comparative analysis of CNS cell types. Cell. 2008;135:749–762. doi: 10.1016/j.cell.2008.10.029. [DOI] [PMC free article] [PubMed] [Google Scholar]
- 44.Buntinx M, et al. Characterization of three human oligodendroglial cell lines as a model to study oligodendrocyte injury: morphology and oligodendrocyte-specific gene expression. J Neurocytol. 2003;32:25–38. doi: 10.1023/a:1027324230923. [DOI] [PubMed] [Google Scholar]
- 45.You F, Osawa Y, Hayashi S, Nakashima S. Immediate early gene IEX-1 induces astrocytic differentiation of U87-MG human glioma cells. J Cell Biochem. 2007;100:256–265. doi: 10.1002/jcb.21082. [DOI] [PubMed] [Google Scholar]
- 46.Maekawa F, Minehira K, Kadomatsu K, Pellerin L. Basal and stimulated lactate fluxes in primary cultures of astrocytes are differentially controlled by distinct proteins. J Neurochem. 2008;107:789–798. doi: 10.1111/j.1471-4159.2008.05650.x. [DOI] [PubMed] [Google Scholar]
- 47.Rothstein JD, Jin L, Dykes-Hoberg M, Kuncl RW. Chronic inhibition of glutamate uptake produces a model of slow neurotoxicity. Proc Natl Acad Sci U S A. 1993;90:6591–6595. doi: 10.1073/pnas.90.14.6591. [DOI] [PMC free article] [PubMed] [Google Scholar]
- 48.McIver SR, et al. Lentiviral transduction of murine oligodendrocytes in vivo. J Neurosci Res. 2005;82:397–403. doi: 10.1002/jnr.20626. [DOI] [PubMed] [Google Scholar]
- 49.Yang Y, Gozen O, Vidensky S, Robinson MB, Rothstein JD. Epigenetic regulation of neuron-dependent induction of astroglial synaptic protein GLT1. Glia. 2010;58:277–286. doi: 10.1002/glia.20922. [DOI] [PMC free article] [PubMed] [Google Scholar]
Associated Data
This section collects any data citations, data availability statements, or supplementary materials included in this article.