Abstract
Magnetic resonance imaging of pediatric brain provides valuable information for early brain development studies. Automated brain extraction is challenging due to the small brain size and dynamic change of tissue contrast in the developing brains. In this paper, we propose a novel Learning Algorithm for Brain Extraction and Labeling (LABEL) specially for the pediatric MR brain images. The idea is to perform multiple complementary brain extractions on a given testing image by using a meta-algorithm, including BET and BSE, where the parameters of each run of the meta-algorithm are effectively learned from the training data. Also, the representative subjects are selected as exemplars and used to guide brain extraction of new subjects in different age groups. We further develop a level-set based fusion method to combine multiple brain extractions together with a closed smooth surface for obtaining the final extraction. The proposed method has been extensively evaluated in subjects of three representative age groups, such as neonate (less than 2 months), infant (1–2 years), and child (5–18 years). Experimental results show that, with 45 subjects for training (15 neonates, 15 infant, and 15 children), the proposed method can produce more accurate brain extraction results on 246 testing subjects (75 neonates, 126 infants, and 45 children), i.e., at average Jaccard Index of 0.953, compared to those by BET (0.918), BSE (0.902), ROBEX (0.901), GCUT (0.856), and other fusion methods such as Majority Voting (0.919) and STAPLE (0.941). Along with the largely-improved computational efficiency, the proposed method demonstrates its ability of automated brain extraction for pediatric MR images in a large age range.
Keywords: Meta-algorithm, Skull stripping, Brain extraction, Label fusion, Level-set, Affinity propagation, Infant brain analysis
1 Introduction
Brain extraction, also known as skull stripping or intracranial segmentation, aims to remove non-brain tissues (e.g., skull, scalp, and dura (Smith, 2002)) and retain brain parenchyema from magnetic resonance (MR) images. It has become a standard procedure to preprocess brain MR images, which is essential for subsequent image analysis, such as brain tissue segmentation, registration, volumetric measurement, and cortical surface reconstruction. Generally, an extracted brain contains gray matter (GM), white matter (WM), internal cerebrospinal fluid (CSF), and CSF proximate to the brain (Eskildsen et al., 2011). Accurate brain extraction is crucial since wrongly-removed brain tissues cannot be recovered in the subsequent processing steps, and the unremoved non-brain tissue (especially the dura) could cause overestimation of the local brain volume or cortical thickness. To this end, a number of automated brain extraction methods have been developed, as briefly summarized in Table 1, such as using morphological operations (Chiverton et al., 2007; Park and Lee, 2009), deformable models (Smith, 2002), level-sets (Zhuang et al., 2006), graph cuts (Sadananthan et al., 2010), label fusion (Eskildsen et al., 2011; Leung et al., 2010a), and hybrid approaches (Iglesias et al., 2011; Rehm et al., 2004; Rex et al., 2004; Ségonne et al., 2004; Shattuck and Leahy, 2001). Large databases were also used for evaluation of brain extraction in the recent studies, such as 1084 subjects used in (Carass et al., 2011), 860 subjects in (Eskildsen et al., 2011), and 839 in (Leung et al., 2010a). Images in these datasets were mainly acquired from healthy or diseased adult subjects, and T1 images were generally used for brain extraction since it can provide better tissue contrast for the adult brains.
Table 1.
A brief summary of recent automated brain extraction methods.
| Studies | Methods | Sample sizes | Diagnostic groups | Image acquisition |
|---|---|---|---|---|
| Shattuck et al. (2001) | Brain Surface Extractor (BSE) | 20 | Healthy adult subjects | T1 images from 1.5T scanner |
| Smith et al. (2002) | Brain Extraction Tool (BET) | 45 | Healthy adult subjects | T1, T2 and proton-density (PD) images from 1.5T and 3T scanners |
| Segonne et al. (2004) | Hybrid Watershed Algorithm (HWA) | 43 | Healthy and diseased adult subjects | T1 images from 1.5T scanner |
| Rehm et al. (2004) | Minneapolis Consensus Strip (McStrip) | 38 | Healthy and ataxic subjects | T1 images from 1.5T scanner |
| Rex et al. (2004) | Brain Extraction Meta-Algorithm (BEMA) | 135 | Healthy and schizophrenia adult subjects | T1 images |
| Zhuang et al. (2006) | Model-based Level Set (MLS) | 49 | Pediatric (29) and adult (20) subjects | T1 images |
| Chiverton et al. (2007) | Statistical Morphology Skull Stripper (SMSS) | 20 | Infant (6) and adult (14) subjects | T1, T2 images |
| Park and Lee (2009) | Region growing | 56 | Healthy adult subjects | T1 images from 1.5T scanner |
| Sadananthan et al. (2010) | Graph Cuts (GCUT) | 68 | Healthy adult subjects | T1 images from 1.5T and 3T scanners |
| Iglesias et al. (2011) | Discriminative and generative models (ROBEX) | 137 | Healthy and diseased adult subjects | T1 images from 1.5T and 4T scanners |
| Carass et al. (2011) | Simple Paradigm for Extra-Cerebral Tissue Removal (SPECTRE) | 1084 | Normal and aging adult subjects | T1 images from 1.5T scanners |
| Eskildsen et al. (2011) | Nonlocal segmentation (BEaST) | 860 | Pediatric (10) and adult (850) subjects | T1 images from 1.5T scanners |
| Leung et al. (2011) | Multi-Atlas Propagation and Segmentation (MAPS) | 839 | Healthy and diseased adult subjects | T1 images from 1.5T (682) and 3T (157) scanners |
Brain extraction on pediatric (infant and neonate) MR images is important as the emerging research interest of brain development in normal children as well as neurodevelopmental disorders. However, neonatal brain is small, with a little bit more than one-quarter of adult brain, and develops rapidly as a function of age (Knickmeyer et al., 2008). Thus, brain extraction for the pediatric subjects is challenging, since their brain/nonbrain boundary is relatively narrower than adults. Moreover, their brain size, shape, and MR signals change dramatically across different age groups, which require a special brain extraction model for the pediatric subjects. In the literature, very few studies have been focused on brain extraction for the pediatric subjects. As briefed in Table 1, there are only 6 infants (10 months) used for evaluation of a morphological operation based brain extraction method (Chiverton et al., 2007); 29 pediatric subjects for a level-set based brain extraction method (Zhuang et al., 2006), and 10 pediatric subjects (5–18 years) for a label fusion based brain extraction method (Eskildsen et al., 2011).
It is worth noting that the existing brain extraction methods usually perform a single run of brain extraction on the given image, and their results may fully depend on the parameters used, which could vary largely across different subjects. On the other hand, different methods may have varied performances, e.g., some may be good at removing nonbrain tissues while others good at retaining brain tissues. Specifically, Brain Surface Extractor (BSE), which combines morphological operation with edge detection (Shattuck and Leahy, 2001; Shattuck et al., 2009), may erroneously remove extra brain tissues, as reported in (Fennema-Notestine et al., 2006). Brain Extraction Tool (BET), which uses a deformable surface model to locate the brain boundaries based on local voxel intensity and surface smoothness (Smith, 2002), may retain extra non-brain tissues, as reported in (Lee et al., 2003; Ségonne et al., 2004). Thus, in general, when applied to a large cohort of images with varying scanning parameters, diagnosis types, such methods may favor only a portion of images and thus need a tremendous amount of human intervention to adjust the parameters or manual editing of the brain extraction results. Moreover, even with optimized parameters, one method might fail to produce satisfactory results for all age groups.
In contrast to the single-run methods, multiple-segmentations-based methods perform multiple segmentations (i.e., brain extractions) on the testing subject and then fuse the results together to form the final result. These methods have been successfully applied to tissue segmentation (Weisenfeld and Warfield, 2009) and region of interest (ROI) localization (Leung et al., 2010b). The success of these methods is based on the fact that the isolated errors may occur randomly in the individual segmentations, but can be remedied with respect to each other for producing the improved result. For example, a meta-algorithm was first proposed in (Rex et al., 2004), namely Brain Extraction Meta-Algorithm (BEMA), which employed 4 individual algorithms for brain extraction and fused the 4 candidate extraction results with the optimal Boolean combination learned from a set of training data. However, the limited number of candidate extractions (i.e., 4) and the insufficient use of prior knowledge may hinder its performance. Multi-Atlas Propagation and Segmentation (MAPS) method (Leung et al., 2010a) nonlinearly registered 19 of 681 best-matched templates from the training library to the given testing subject, and the resulted 19 candidate extraction results were fused using shape-based averaging technique. On the other hand, BEaST was developed (Eskildsen et al., 2011) based as a patch-based method, in which the label (belonging to brain or background) of each given voxel in the testing image was determined by labels of 20 corresponding patches in the template library according to their respective patch similarities. With this method, the processing time was improved to less than 30 minutes per subject. However, the performance of the above methods may be compromised when applied to the pediatric subjects, since they were (1) optimized and evaluated only on the adult data, (2) not adaptive to different image properties at different pediatric age groups, and (3) computationally expensive when involving the use of non-rigid template-to-subject registrations.
In this study, we propose a novel Learning Algorithm for Brain Extraction and Labeling (LABEL) specially for the pediatric subjects. The idea is to perform multiple brain exactions by using a meta-algorithm, and then fuse the resulted labels into a final outcome. By doing so, first, the complementary brain extraction results can be fused together to improve the quality of final result; second, the proposed method is computationally efficient since the time-consuming template-to-subject registration will be avoided by using just the affine registration.
The framework of LABEL method consists of (1) coarse brain localization, (2) parameter learning and exemplar selection, and (3) brain extraction and fusion. Specifically, we employ two freely available individual brain extraction algorithms (BET and BSE) in the form of meta-algorithm to produce multiple complementary brain extractions for a given testing subject. Parameter-performance maps are then learned from the training subjects and further propagated to the testing subject to improve the brain extraction. Finally, we develop a level-set based label fusion to combine multiple candidate extractions together with a closed smooth surface, for obtaining the final result. In this way, errors in the voxel-wise label fusion methods (e.g., by simple majority voting) can be greatly eliminated.
The proposed method, LABEL, has been extensively evaluated on MRI scans acquired from three age groups, i.e., newborn, infant, and child groups, covering the major anatomical patterns of pediatric subjects. The overlap rates between the automated extraction results by the proposed method and the semi-automated extraction results by human rater are computed for performance evaluation. Also, other methods, such as BET, BSE, GCUT, and ROBEX, are included for comparison. Moreover, the proposed level-set based label fusion is compared with other widely-used label fusion methods, such as majority voting and STAPLE. All these results show that the proposed method produces the best brain extraction results in the pediatric populations.
2 Materials and Method
2.1 Subjects and MRI Acquisition
To demonstrate the anatomical variability within pediatric subjects, 3 datasets are employed in this paper, namely neonate (less than 2 months), infant (1–2 years), and child (5–18 years) groups.
The newborn and infant data used in this paper are a part of a large ongoing study of early brain development in normal children in the University of North Carolina (UNC) at Chapel Hill [18]. The experimental protocols were approved by the institutional review board of the UNC School of Medicine. The parents were recruited from the UNC hospitals, and written informed consent forms were obtained. The presence of abnormalities on fetal ultrasound, or major medical or psychotic illness in the mother, was used as the exclusion criteria. The infants (neonates) were free of congenital anomalies, metabolic disease, and focal lesions. None of the subjects was sedated for MRI. Before the subjects were imaged, they were fed, swaddled, and fitted with ear protection. T1-weighted MR brain images were collected using a 3T Siemens scanner. 160 sagittal slices were obtained with parameters: TR=1900ms, TE=4.38ms, Flip Angle=7°, and resolution=1×1×1mm3. For T2-weighted images, 70 transverse slices were acquired with turbo spin-echo (TSE) sequences: TR=7380 ms, TE=119 ms, Flip Angle=150°, and resolution=1.256 × 1.256 × 1.95 mm3. Data with motion artifacts was discarded and a rescan was made when possible. In this paper, 90 MRI scans from neonatal subjects and 141 MRI scans from infant subjects are used. The demographic information is summarized in Table 2.
Table 2.
The demographics of pediatric subjects used in 3 age-groups.
| Datasets | |||
|---|---|---|---|
| Neonate | Infant | Child | |
| Number of Subjects (training, testing) | 90 (15, 75) | 141 (15, 126) | 60 (15, 45) |
| MR Strength (T) | 3 | 3 | 1.5 |
| MRI Modality | T2 | T1 | T1 |
| Postnatal Age | 0.8±0.3 (0.3–2.0) months | 1.6±0.5 (0.9–2.4) years | 11.1±3.5 (5.9–18.1) years |
| Gender (male, %) | 45 (60%) | 70 (56%) | 19 (42%) |
Pediatric data is obtained from the NIH Pediatric Database (NIHPD) (Evans et al., 2008). This dataset is publicly available at www.nih-pediatricmri.org. We randomly downloaded images of 60 subjects with ages ranging from 5 to 18 years old. These images were acquired at multiple centers with 1.5T scanners.
We choose 15 random subjects from each of the 3 age groups to build the template library. In total, our template library consists of 45 subjects, and the rest serves as the testing data, which includes 75 neonatal, 126 infant, and 45 child subjects (Table 2).
For preprocessing, all images are resampled into isotropic voxel of 1×1×1 mm3. Bias field is estimated with N3 algorithm (Sled et al., 1998) to correct intensity inhomogeneity in all MR images separately.
2.2 Proposed Method
The proposed LABEL framework consists of three major steps, as illustrated in Fig. 1. The first step is called as coarse brain localization, where all subjects are normalized onto a common space, and then an initialization mask is generated from the training data to roughly localize the brain region in the new testing subject. The second step is on parameter learning and exemplar selection. Specifically, parameters for each individual brain extraction algorithm (BET and BSE) are uniformly sampled and exhaustively combined, to learn the parameter-performance map for each training subject. To further reduce the scale of the template library and achieve higher computational efficiency, a number of representative subjects are selected as exemplars to represent the whole training set. Then, a parameter-performance map is generated for each exemplar by averaging from the parameter-performance maps of all training subjects in the same class, according to their contribution to that exemplar. The third step is brain extraction and fusion. In application, each testing subject is compared with all exemplars to find its best matched one, and then the combination of parameters corresponding to that selected exemplar is employed to conduct multiple brain extractions on the testing subject. All candidate extractions are then fused together into a final result with our proposed level-set based segmentation algorithm. The brain extraction result can be warped back to the native space if needed. Details for these three steps are given in the following subsections.
Figure 1.
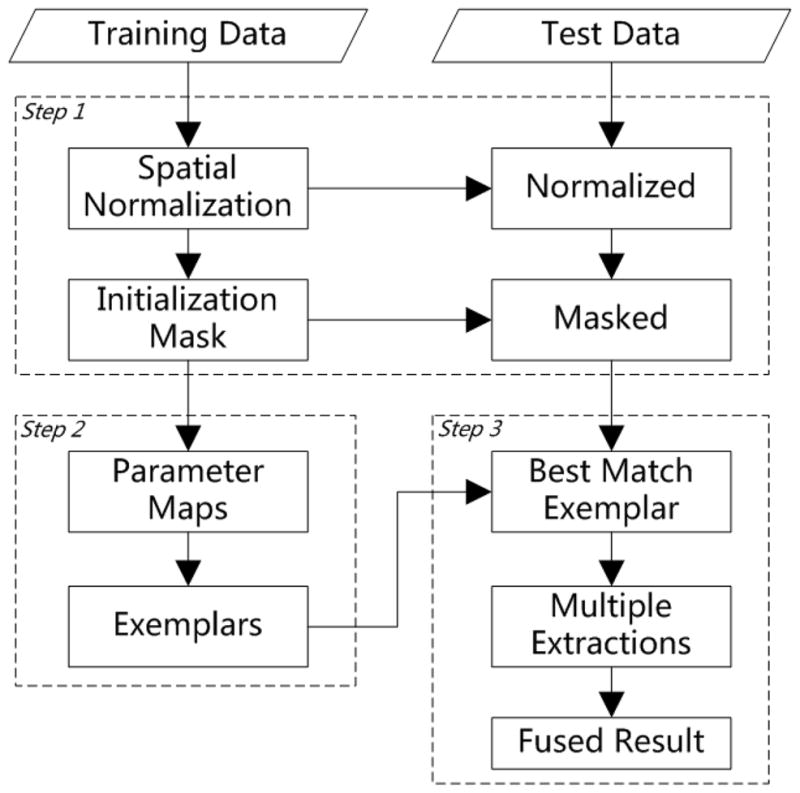
A conceptual diagram illustrating the three main steps involved in the proposed method, namely coarse brain localization, parameter learning and exemplar selection, and brain extraction and fusion.
2.2.1 Step 1: Coarse Brain Localization
This step is to use generate both intensity model and initialization mask from the training data. The intensity model will be used to spatially normalize a testing subject onto the common space, while the initialization mask will be applied to the aligned testing subject for roughly localizing its brain region.
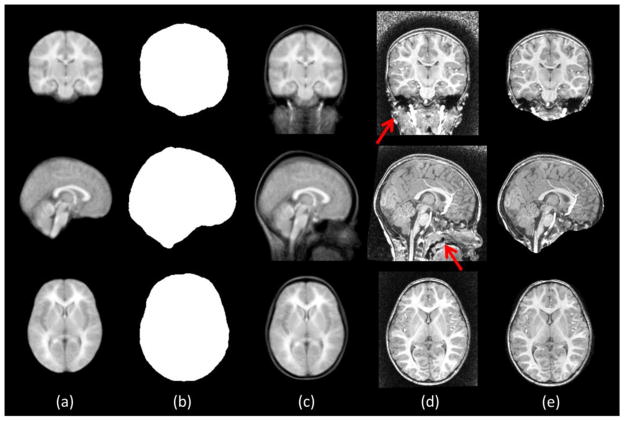
Specifically, each training subject is associated with two images: a with-skull image and a brain-extracted image by semi-automated method with manual edition. First, all the brain-extracted images of training subjects are affine aligned (by FLIRT using the cross correlation as cost; FSL: http://www.fmrib.ox.ac.uk/fsl/) to a widely-used population template, namely ICBM152 (Mazziotta et al., 2001), for spatial normalization. The union of all aligned brain-extracted images (Fig. 2a) is used as an initialization brain mask, which is further dilated for a few voxels, dmask, outward to avoid possible false removal of brain tissues (Fig. 2b). The estimated affine transformations are also used to bring the respective with-skull images onto the common space. Then, the average with-skull image (Fig. 2c) will be used as an intensity template for spatial normalization of the (with-skull) testing image (Fig. 2d). Finally, the initialization mask can be applied to the testing image (Fig. 2e). By doing this, all non-brain tissues with a certain distance away from the brain can be removed in the testing image completely (e.g., neck) or partially (e.g., brain stem).
Figure 2.
Illustration of intermediate results of coarse brain localization. From left to right: averaged brain-extracted image from the training data (a), initialization mask (b), averaged with-skull image from training data (c), a testing image from an 2-year-old subject after affine alignment (d), and the testing image applied with initialization mask (e). The red arrows indicate some non-brain tissues, which pose challenges to individual brain extraction algorithms and are totally or partially removed by using the initialization mask.
2.2.2 Step 2: Parameter Learning and Exemplar Selection
Parameter Learning
BET and BSE are employed in our meta-algorithm because they are publicly available, have good performance when parameters are fine-tuned, and are computationally fast. However, their performance is sensitive and varies largely across different parameter settings. Thus, we propose to learn parameter-performance maps of BET and BSE for all combinations of their parameters on each training subject. When applied to the testing subject, the learned performance map will provide a list of effective parameter combinations for better brain extractions.
BET in FMRIB Software Library version 4.1.4 (http://www.fmrib.ox.ac.uk/fsl/)
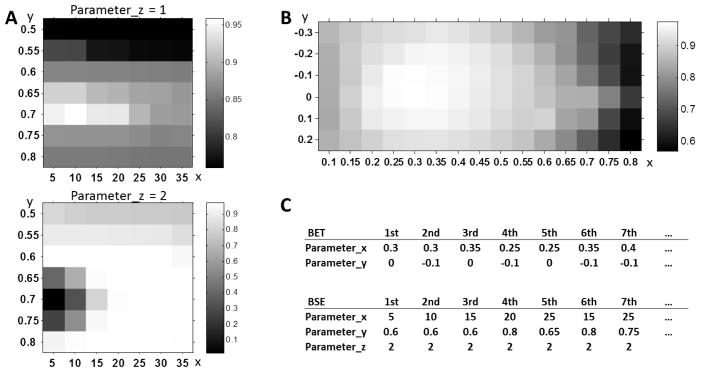
BET uses a deformable surface model to locate the brain boundaries based on the local voxel intensity and surface smoothness (Smith, 2002). We choose to investigate the fractional intensity threshold and vertical gradient options in BET. As larger fractional intensity threshold returns a smaller brain region, we vary it between 0.1 and 0.8 (with increment of 0.05). Similarly, positive vertical gradient returns a larger brain outline at bottom, and smaller (negative) returns a larger brain outline at top. Therefore, we vary this parameter between −0.3 and 0.2 (with increment of 0.1). Other parameters are set by default.
BSE in BrainSuite version 11a (http://www.loni.ucla.edu/Software/BrainSuite)
BSE first employs anisotropic diffusion filtering to smooth the noisy regions in a given image and then detect the brain edge with a 2D Marr-Hildreth operator. Brain is then extracted from the edge map by using a sequence of morphological processing steps (Shattuck et al., 2001). We choose to investigate the diffusion constant, diffusion iterations, and edge detection constant as shown in Table 3. We use the option ‘-n 5’ for 5 diffusion iterations and ‘-p’ for post-processing dilation of the final brain mask, as suggested in (Shattuck et al., 2009). Other parameters are set by default.
Table 3.
The respective parameters and parameter-sampling strategies used for BET and BSE in the proposed meta-algorithm.
| Methods | Parameters | Default | Sampling | Effects of larger value |
|---|---|---|---|---|
| BET | -f (fractional intensity threshold) | 0.5 | 0.1:0.05:0.8 | Smaller brain outline |
| -g (vertical gradient) | 0 | −0.3:0.1:0.2 | Larger brain outline at bottom | |
| BSE | -d (diffusion constant) | 25 | 5:5:35 | Blur across larger intensity differences |
| -s (edge detection constant) | 0.62 | 0.5:0.05:0.8 | Detect only wider edges | |
| -r (erosion size) | 1 | 1, 2 | Break wider connections |
We uniformly sample the parameters of the two algorithms (Table 3) and then apply all parameter combinations to each training subject for producing multiple brain extractions. For each brain extraction, its accuracy is quantified by the overlap rate of its extraction result with the semi-automated extraction result from a human rater. The overlap rate is measured using Jaccard Index JI = |A ∩ B|/|A ∪ B|, where A is the automated extraction result and B is the semi-automated extraction result. Thus, two parameter-performance maps can be formed for each training subject, i.e., a 15×6 map for BET (Fig. 3B) and a 7×7×2 map for BSE (Fig. 3A), where each element represents the overlap rate with respect to a specific set of parameters used.
Figure 3.
Illustration of parameter-performance maps of BSE (A) and BET (B) on an exemplar. In (A), x-axis and y-axis represent the two parameters (i.e., -d and -s) in BSE, and top and bottom figures represent the two assignments of the third parameter (i.e., -r). In (B), x-axis and y-axis represent the two parameters (i.e., -f and -g) in BET. Parameter combinations are sorted in descending order based on their corresponding performances, respectively (C).
Exemplar Selection
We propose to choose a small number of subjects to represent the entire training data. By doing so, the exhaustive template-subject comparisons can be substantially reduced and thus increase the overall computational efficiency. We use a recently developed message-passing-based algorithm, called as affinity propagation (AP) (Frey and Dueck, 2007), to determine a subset of training subjects, called as exemplars, for representing the whole training data.
First, all scans of training data are affine aligned onto a common space as described in Step 1. Intensity similarity is then computed for each pair of training data by using cross correlation, and the results on all possible pairs form an N by N similarity matrix S, where N is the number of subjects in the training data. The similarity matrix is the input of AP algorithm and the output is an updated contribution matrix where a certain number of exemplars are automatically identified and contributions from other subjects to each exemplar are listed. The self-similarity values of the matrix (i.e., diagonal elements) are also called as preferences, which would have influence on the number of selected exemplars. For example, higher preference Sk,k would increase the probability of the subject k to be selected as an exemplar. In our case, all subjects are given the same probability by initializing the preferences as the median of all off-diagonal entries of similarities Si,j,i ≠ j. Once the preference is defined, AP is able to determine the most suitable number of exemplars based on the structure of the given similarity matrix.
A final contribution matrix E is obtained after iterations of AP. The contribution of subject i choosing k as its exemplar is given by Ei,k, where the larger value means the higher contribution.
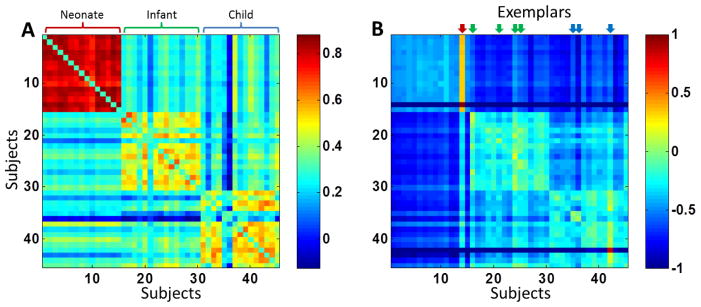
Results are illustrated in Fig 4. Fig. 4(A) shows the original similarity matrix S of N = 45 subjects, and Fig. 4(B) shows the contribution matrix E. In Fig. 4(B), 8 subjects are selected as exemplars, as indicated by vertical arrows on the top. In each column of each exemplar in E, contributions are given from other subjects to that exemplar.
Figure 4.
Illustration of affinity propagation (AP) for selecting exemplars from 45 training subjects. (A) is the original pairwise similarity matrix S. (B) is the updated contribution matrix E, in which 8 subjects (1 from neonate, 4 from infant, and 3 from child groups) were selected as exemplars as indicated by the arrows on the top.
For each exemplar, its final parameter map (Fig. 3) is defined as the average over all parameter maps of training data, weighted by their contributions to that exemplar.
2.2.3 Step 3: Brain Extraction and Fusion
Brain Extraction
Testing subjects are first affine aligned onto the common space and further applied with the initialization mask (Fig. 1). Then, the best-matched exemplar is located by comparing the intensity similarity (defined as cross correlation) between the testing subject and all exemplars. Thus, top M effective parameter combinations can be chosen from the parameter-performance maps of BET and BSE (Fig. 3C), so that M instances of brain extractions will be conducted on the testing subject. In particular, to obtain complementary results, we use half extractions from BET and another half from BSE. Note that more instances of individual brain extractions will bring higher computational cost, although the accuracy might be improved.
Label Fusion
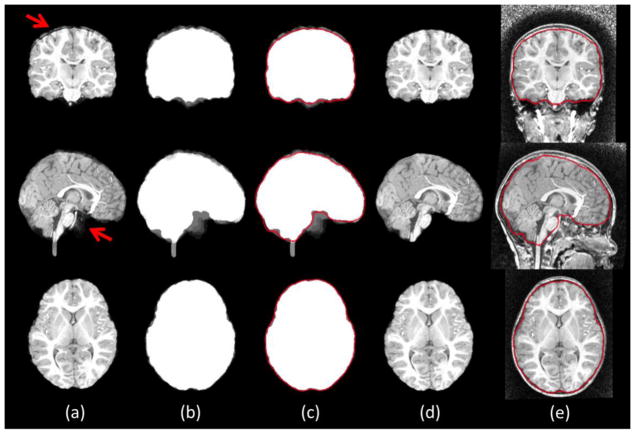
When multiple candidate extractions are available, the next question is how to fuse them together. Majority voting is a widely used technique, which picks the majority label at each voxel from all available candidates. However, majority voting often produce isolated false extractions and sometimes also the unsmooth boundary in the extracted brain region (Rohlfing and Maurer, 2007). To address this issue, we model the brain as a closed entity with a smooth closed surface and thus use a level-set method (Chan and Vese, 2001) to find the brain boundaries from the average label map of the multiple brain extraction results, as shown in Fig. 5.
Figure 5.
Illustration of the level-set based label fusion on the subject used in Fig. 2. Intermediate results are shown as averaged candidate extractions (a), averaged label maps (b), level-set based brain boundary (red) (c), final extraction result (d), and superimposed brain boundary on the original with-skull image (e).
The basic principle of the Heaviside function H in the level-set method is to define a region with value 1 for the inside region and value 0 for the outside region. We employ a level set φ to define brain region as M1 = H (φ) and non-brain region as M2 = 1 − H (φ), respectively. The energy F can thus be defined as:
where u0 is the average label map, the first term is the smoothness term, and the last two terms are the data fitting terms. The level set φ(x, y, z) is a signed distance function, where its value is the distance between the point (x, y, z) and its nearest point (x′, y′, z′) on the zero-level-set, and it takes negative values outside the zero-level-set and positive values inside the zero-level-set. c1 is the mean intensity inside of surface, and c2 is the mean intensity outside of surface. μ, λ1, λ2 are the control parameters and set as μ = 0.003×255×255, λ1 = 1, and λ2 = 1 (Chan and Vese, 2001). δ is the derivative of the Heaviside function H. We minimize F with respect to φ by the calculus of variations, and thus obtain the final level set surface which separates the brain from background.
For final brain region, we define it as the region interior to the l -th level set, i.e., M1 = {(x, y, z)|φ(x, y, z)≥l}. We choose a negative value of l to reduce the risk of cutting brain tissues, similar with the final region dilation step recommended in many studies (Leung et al., 2010a; Shattuck et al., 2001). It is worth noting that this parameter could also be learned from the training data, by uniformly sampling the parameter values and picking the one with the best overlap with the semiautomated extractions by human rater (see details in experiment section). Finally, by applying the estimated level-set boundary (Fig. 5c) onto the testing subject, the brain extraction results can be obtained (Fig. 5d).
2.3 Performance Assessment
2.3.1 Semi-automated Brain Extraction
Manually segmenting the whole brain image is time-consuming, which typically requires 6–8 hours per brain (Eskildsen et al., 2011). In practice, automatic tools are generally first used to provide an estimate of the brain region, followed by manual edition by human raters.
Specifically, we employ the “segmentation” module in SPM package (SPM8, http://www.fil.ion.ucl.ac.uk/spm/) to separate brain into brain tissues and background by using age-specific tissue probability maps of subjects (Ashburner and Friston, 2005; Shi et al., 2011). Default parameter setting is used. Then, the non-background results are combined as an initial binary segmentation and further edited manually by the human rater with ITK-SNAP (Yushkevich et al., 2006), to remove the remaining non-brain tissues and also to include the wrongly-removed brain regions. We follow the definition of brain mask defined in (Eskildsen et al., 2011), where gray matter, white matter, ventricular CSF, CSF in deep sulci and along the surface, and brain stem are included into the brain region. The manual editing process takes about 30 minutes in average for each subject. Jaccard Index for intra-rater reliability is 0.987±0.005, calculated from 30 images (10 from each of 3 age-groups) performed twice by the rater. All semi-automatic extractions are further reviewed by another rater to ensure the correctness of brain extraction results.
2.3.2 Comparison with Other Methods
Results of the proposed method are compared with semi-automated extractions for evaluation. Other automated methods are also employed for evaluation, such as BET, BSE, ROBEX (Iglesias et al., 2011), and GCUT (Sadananthan et al., 2010). The later two are the two recently developed brain extraction methods and their software packages are available publicly. Majority voting and STAPLE (Warfield et al., 2004) are alternately used to fuse the candidate extractions from the proposed pipeline, to compare with the proposed level-set based label fusion method. Detailed evaluations are provided below.
LABEL
We use 45 subjects (15 neonates, 15 infants, and 15 children) as training data and the rest 246 subjects (75 neonates, 126 infants, and 45 children) as testing data. The algorithm parameters, such as brain mask dilation size dmask, level of level-set function l, and number of extractions M, are then optimized by experiments using the training data. Usually, although 45 training subjects seem not a lot, actually a small portion of training data is considered sufficient for parameter selection of a wider dataset (Leung et al., 2010a).
BET and BSE
BET and BSE are applied to the 15 subjects of each age group separately with all combinations of algorithm parameters as listed in Table 2. By averaging across subjects, the parameter combination corresponding to the best performance in each age group is taken, which is then applied to the same age group of the testing data.
ROBEX
ROBEX combines a discriminative and a generative model to achieve the final brain extraction result (Iglesias et al., 2011). The former is a Random Forest classifier trained to detect the brain boundary, and the latter a point distribution model to explore the contour with the highest likelihood. Then the contour is refined by using graph cuts. ROBEX is designed to work with no parameter, and is available at http://nmr.mgh.harvard.edu/~iglesias/ROBEX.
GCUT
GCUT is a graph cut based brain extraction method (Sadananthan et al., 2010). It has two parameters, with a threshold parameter T representing the percentage of WM intensity to obtain preliminary mask, and an intensity parameter k controlling the contribution of voxel intensities in deciding cut positions. We vary T between 32 and 40 (with increment of 1), and k between 1 and 3 (with increment of 0.1). Best combinations are determined in each age group of training data. GCUT is available for download from authors’ website (http://www.ntu.edu.sg/home/zvitali/software.html).
Other Fusion Methods
For the M candidate extractions from the proposed meta-algorithm, majority voting and STAPLE are alternatively used to fuse them together as final results, respectively. In particular, for each voxel, there are M extractions presenting M votes for label 0 (for non-brain tissue) or label 1 (for brain tissue). Majority voting method counts the number of votes for each of the 2 labels, and chooses the one with more votes as the final label. STAPLE utilizes an expectation-maximization (EM) approach to simultaneously estimate a reference standard segmentation and the performance of individual segmentations, measured by the sensitivity and specificity of the segmentation (Warfield et al., 2004). Software is available at http://www.nitrc.org/projects/staple.
2.3.3 Quantitative Evaluation Metrics
We measure the similarity between the automated and semi-automated extractions with Jaccard Index. We also measure the extraction error with false positive rate, defined as Fpr = FP/(FP + TN), and false negative rate, defined as Fnr = FN/(TP + FN) where TP is the set of true positive voxels, TN is the true negative, FP is the false positive, and FN is the false negative.
2.3.4 Quantitative Analysis using Projection Maps
To visualize the location of extraction errors in automated algorithms, we generate the projection maps for the false positive and negative voxels, respectively. Specifically, the 3D false positive (or negative) maps of all testing data were first averaged, and then projected onto the sagittal, coronal, and axial directions. The mean projection map illustrates the major locations of false voxels and can be used to compare between different methods to analyze their performance difference. The voxel value in each 2D projection map indicates the average number of false voxels that pass through a projection ray in the direction perpendicular to the 2D projection plane.
3 Experimental Results
3.1 Parameter Selection
A number of experiments are performed to optimize parameters for the proposed method. In the experiment, 21 of 45 subjects in the training data (7 for each age group) are used to construct the template library, initialization mask, exemplars, and parameter-performance maps. The rest 24 subjects (8 for each age-group) are used to serve as testing data, for optimizing the parameters for the dilation size in initialization mask dmask, level-set parameter l, and number of extractions M.
3.1.1 Dilation Size of Initialization Mask
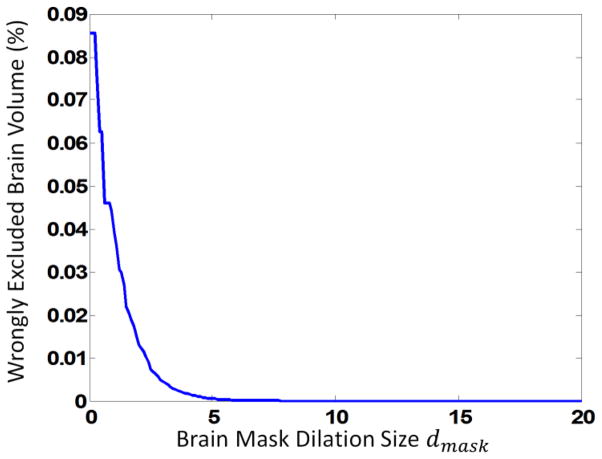
In coarse brain localization step, an initialization mask is generated to preprocess images by removing non-brain tissues with a certain distance to brain. To avoid removing brain tissues in the testing images due to non-perfect alignment, the mask is dilated outward for dmask voxels to contain more brain regions. An important requirement is that the mask should be large enough to include all brain tissues in the aligned testing images (thus needing a larger dmask), and at the same time to exclude more non-brain tissues (thus needing a smaller dmask).
The with-skull images of the 24 subjects are then affine aligned onto the with-skull template. The aligned images are further applied with the initialization mask, with dmask varying from 0 to 20 voxels, to remove the non-brain tissues. We calculate the ratio of wrongly-excluded brain volume to the total brain volume for all subjects, with the results shown in Fig. 6. As we can see, the wrongly-excluded brain volume decreases as the dilation size becomes larger. Finally, we choose dmask = 8 in this paper for achieving a low probability of wrongly excluding brain tissues when applied to the testing subjects.
Figure 6.
Parameter selection of initialization mask. The ratio of wrongly-excluded brain to the whole brain is shown as a function of dilation size. Results of 24 subjects were averaged.
3.1.2 Number of Extractions
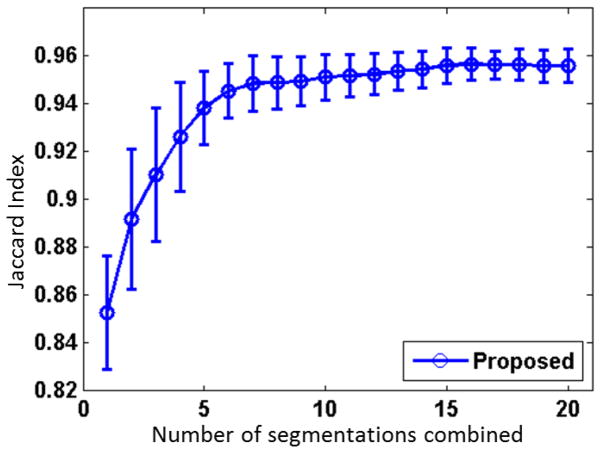
Totally M candidate extractions are fused to obtain the final result (as detailed in Step 3 of methodology section). To optimize the number M, we apply the proposed method to each of the 24 subjects and generate 20 extractions, in which 10 extractions are from BET and the other 10 from BSE. Of note, the 20 extractions are in the order of their corresponding performance value in the exemplar parameter map. The label fusion methods are applied to the extractions with the number M varying from 1 to 20. As can be observed from Fig. 7, the fusion results are generally improved with the increase of the number of extractions and become stable when using more than 16 extractions. Moreover, results are more consistent as the standard deviation is generally reducing with more extractions. This trend is agreed with MAPS (Leung et al., 2010a), in which 19 were considered as the optimal balanced number of extractions. Similarly, 20 were used in BEaST (Eskildsen et al., 2011). In this paper, we choose M = 16.
Figure 7.
Averaged Jaccard index as a function of the number of brain extractions from 24 subjects.
3.1.3 Selection of Level Set Parameter
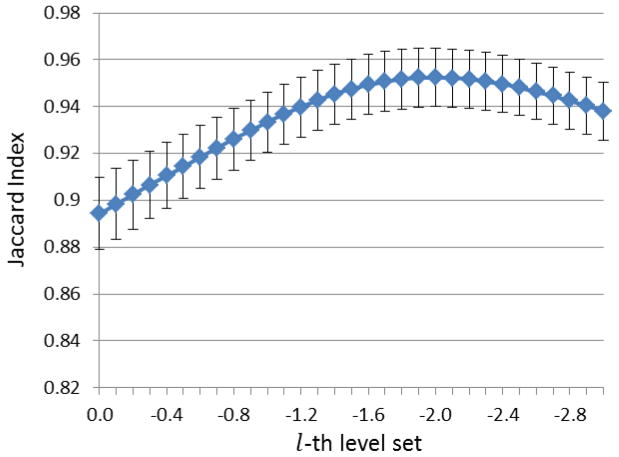
We apply the proposed method to the 24 subjects and generate 16 brain extractions for each subject. Then, for each subject, the level-set fusion approach is performed on the average label map of the 16 extractions, to locate the brain boundary. The resulting level-set extraction is compared with semi-automated extractions using Jaccard Index. We choose to investigate the value of level-set function l from 0 to −3, in decrement of 0.1, where larger absolute value means that the level-set boundary includes more brain region. The resulted performance curve is shown in Fig. 8. The parameter has peak at l = −2.0, which is thus selected as the optimal value for defining the inside l -th level-set as the final brain region.
Figure 8.
Parameter selection for the level set approach on 24 subjects. X-axis is the selected value of level-set function, where negative value means level-set boundary includes more brain regions. Y-axis is the overlap rate between the ground-truth and the automated skull-stripping using the respective parameter. Vertical lines mean the standard deviation of the measurements.
Note that the two parameters M and l are related. We can iteratively fix one parameter and optimize the other. In this study, we use M = 16 and l = −2.0.
3.2 Validation
3.2.1 Proposed method
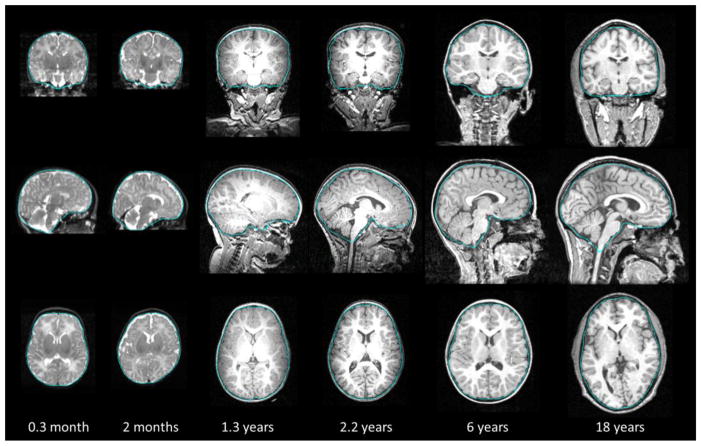
Fig. 9 shows typical examples of brain extraction results of the proposed method. Brain boundaries are described using blue curves and overlaid in the original with-skull images, shown in coronal, sagittal, and axial views from top to bottom. Two subjects from neonatal group are shown in the left two columns, which were scanned at postnatal age of 0.3 month and 2 months, respectively. T2 images are provided since T2 provides better tissue contrast at neonatal stage and is thus preferred in subsequent image processing such as tissue segmentation. Middle two columns show the two subjects from infant groups with postnatal age of 1.3 years and 2.2 years, respectively. As can be seen in the figure, the infant subjects generally have less percentage of CSF than that of adults, and thus the space between brain and skull is narrower, posing challenges to brain extraction. A 6-year-old subject and an 18-year-old subject are shown in the right two columns. Structural appearance of these images was more adult-like.
Figure 9.
Typical brain extraction results on 6 subjects. From top to bottom: the coronal, sagittal, and axial views of each subject are provided. Blue curves are the extracted brain boundaries by the proposed method, overlaid on the original with-skull images. The postnatal age of each subject is provided in the bottom for reference.
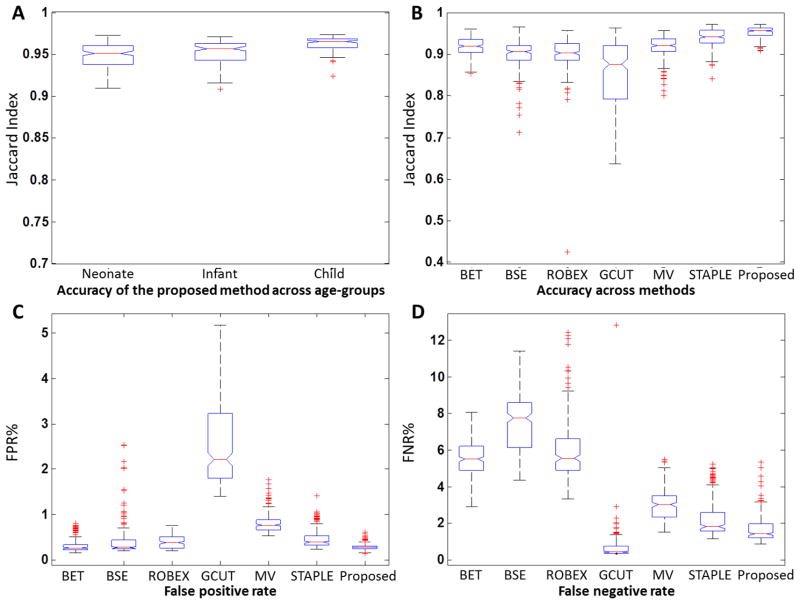
Fig. 10A shows the brain extraction accuracy within the neonate, infant, and child groups, respectively. Average Jaccard Indices of each of the 3 age groups are 0.948, 0.952, and 0.962, respectively. The accuracy on child group is significantly higher than each of other two groups (p<0.001, two-sample t-test). This may be because (1) the individual algorithms in pipeline were originally developed for adults and thus perform better in nearly adult brains (child group), and (2) larger external CSF spaces are presented in child brains that may ease the problem of identifying the non-brain tissues.
Figure 10.
Boxplot of brain extraction accuracy, false positive rate, and false negative rate. (A) Accuracy of the proposed method on three age-groups measured using Jaccard Index. (B) Accuracy of BET, BSE, ROBEX, GCUT, Majority Voting (MV), STAPLE, and the proposed method on all 246 testing subjects measured using Jaccard Index. (C) False positive rate and false negative rate (D) for all methods on all 246 testing subjects.
3.2.2 Comparison to Other Methods
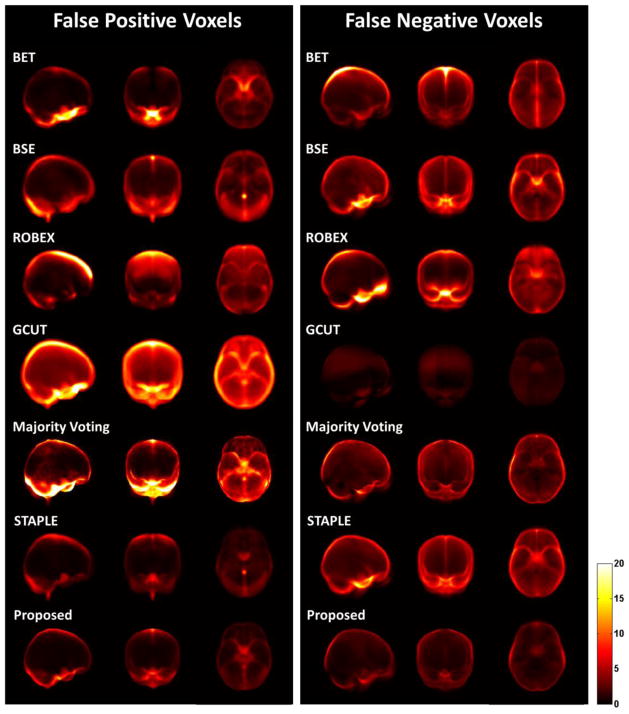
Fig. 10B–D shows the accuracy, FPRs, and FNRs of all methods on 246 testing subjects. To visualize the location of extraction errors, we generate the projection maps for the false positive and false negative voxels as shown in Fig. 11. BET preforms slightly better than that of BSE (p<0.001, paired t-test), but they both tend to over-segment images, thus showing well-removed non-brain tissues (low FPR) and relatively large wrongly-removed brain (high FNR). ROBEX performs similarly with BSE, showing no significant difference in accuracy but lower FPR and higher FNR. GCUT, however, usually under-segments images and keeps a large amount of non-brain tissues in the final result and thus has large FPR and very low FNR, which leads to the lowest average accuracy. STAPLE has better performance than that of majority voting (p<0.001, paired t-test), in all measures such as accuracy, FPR, and FNR. The proposed method significantly outperforms all other methods in accuracy (p<0.001, paired t-test), with balanced FPR and FNR generally.
Figure 11.
Projection maps of false positives (left panel) and false negatives (right panel) for the brain extractions obtained by BET, BSE, ROBEX, GCUT, Majority Voting, STAPLE, and the proposed method on 246 testing subjects. From left to right in each panel shows the sagittal, coronal, and axial views. Brighter value indicates higher false positives (or negatives).
Table 4 further details the accuracy, FPR and FNR produced by all methods in the three age groups. It can be observed that the proposed method outperforms other methods (p<0.001, paired t-test) in all 3 age groups by achieving an average Jaccard Index of 0.948 in neonatal group, 0.952 in infant group, and 0.962 in child group. BET and BSE have the lowest FPR in child and infant group, respectively, at the cost of high FNR. ROBEX performs much better in child group than in neonate and infant groups. GCUT has the lowest FNR in all three age groups at the cost of the highest FPR.
Table 4.
Mean Jaccard indices, false positive rates (FPR), and false negative rates FNR) by BET, BSE, ROBEX, GCUT, Majority-Voting based fusion, STAPLE based fusion, and the proposed method.
| Neonate | Infant | Child | |||||||
|---|---|---|---|---|---|---|---|---|---|
| Method | Jaccard Index | FPR% | FNR% | Jaccard Index | FPR% | FNR% | Jaccard Index | FPR% | FNR% |
| BET | 0.920±0.021 | 0.62±0.21 | 3.44±1.07 | 0.908±0.020 | 0.23±0.06 | 6.83±0.96 | 0.944±0.007 | 0.07±0.03 | 5.05±0.48 |
| BSE | 0.884±0.032 | 0.68±0.34 | 7.36±1.36 | 0.904±0.018 | 0.13±0.04 | 9.24±0.96 | 0.924±0.068 | 0.78±0.61 | 2.73±0.28 |
| ROBEX | 0.886±0.062 | 0.25±0.09 | 9.72±3.33 | 0.896±0.021 | 0.56±0.13 | 4.67±0.92 | 0.942±0.009 | 0.20±0.09 | 4.39±0.85 |
| GCUT | 0.916±0.047 | 1.08±0.46 | 1.34±1.46 | 0.801±0.064 | 3.85±0.78 | 0.45±0.38 | 0.907±0.033 | 1.36±0.31 | 0.17±0.08 |
| Majority Voting | 0.911±0.016 | 0.95±0.17 | 2.46±0.75 | 0.926±0.022 | 0.64±0.12 | 3.93±0.68 | 0.911±0.040 | 1.09±0.31 | 1.27±0.40 |
| STPALE | 0.934±0.026 | 0.31±0.18 | 4.52±1.17 | 0.945±0.017 | 0.37±0.09 | 1.51±0.47 | 0.943±0.019 | 0.97±0.26 | 0.52±0.32 |
| Proposed | 0.948±0.015 | 0.15±0.06 | 2.05±1.05 | 0.952±0.014 | 0.31±0.06 | 1.67±0.58 | 0.962±0.010 | 0.37±0.08 | 1.06±0.29 |
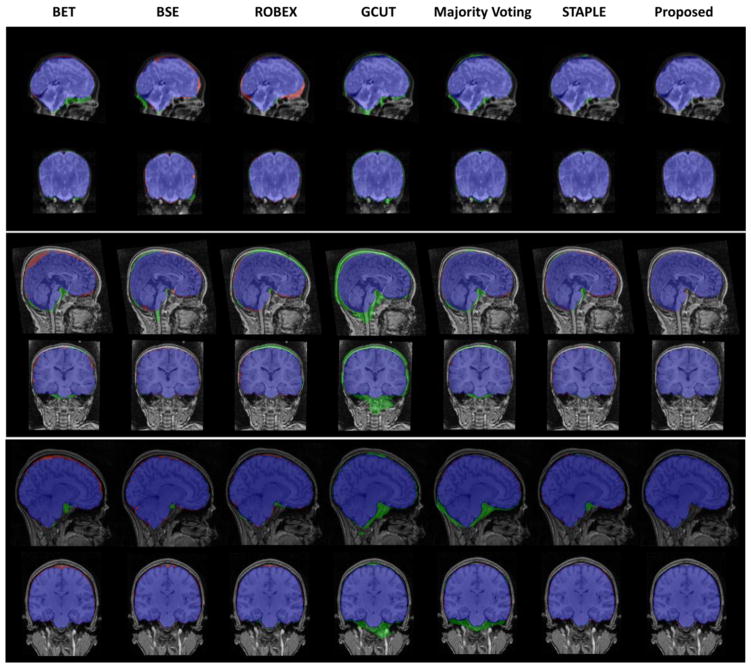
Fig. 12 shows typical results using BET, BSE, ROBEX, GCUT, and fusion methods including majority voting (MV) and STAPLE, as well as the proposed method. BET is likely to remove a portion of brain while remain extra non-brain tissues near brain stem. Red in Fig. 12 denotes false negative voxels, and green denotes false positive voxels. BSE and ROBEX behave similarly with BET in neonate and child groups, while keep extra dura on the top of the head in infant subjects. GCUT typically keeps more non-brain tissues. Majority voting generally has non-brain tissues on the top of the head and near the brain stem, which is remedied largely in STAPLE. The proposed method provides consistent and robust brain extractions on all three age groups.
Figure 12.
Typical results using BET, BSE, ROBEX, GCUT, Majority Voting, STAPLE, and the proposed method in neonatal (top), infant (middle) and child (bottom) groups. Sagittal and coronal views are shown. Blue voxels are the voxels consistent with the semi-automated extractions. Green voxels are the residual non-brain tissues (false positives) and red voxels are the wrongly-removed brain regions (false negatives).
3.2.3 Computation Time
All programs are run in a Linux environment on a standard PC using a single thread on an Inter® Xeon® CPU (E5630 1.6 GHz). Input image size is 256×256×256 and resolution is 1×1×1 mm3. In the testing stage, it takes about 10 minutes for brain extraction of a subject, in which 3 minutes are used for spatial normalization, 5 minutes for multiple brain extractions, and 2 minutes for label fusion. In the training stage, it takes about 4 hours to process 45 training data, in which 2 hours are used for spatial normalization and 2 hours for learning the parameter maps and selecting the exemplars. Note that most computations in the training stage are subject-specific and can be paralleled for achieving less computational time on a computer cluster.
4 Discussion
We have presented a novel learning algorithm for brain extraction. Our contribution is three-fold. First, we have introduced the use of exemplars to effectively represent the whole training library, thus largely reducing the size of templates to match during the application stage. Second, we have proposed to propagate the parameter settings learned from training templates to subject for creating multiple extractions, without requiring nonlinear registration between them. Third, we have developed a level-set based label fusion method to overcome both boundary discontinuity and isolated errors in the voxel-wise label fusion methods. Experimental results have showed that our proposed method can substantially improve the accuracy and robustness of brain extraction. Also, the proposed framework is not limited to BET and BSE; instead, it can be extended for inclusion of other brain extraction algorithms.
We have proposed to preprocess the input image by spatial normalization and then applying the brain initialization mask for coarse brain extraction. This approach reduces 80% of the entire stereotaxic space (for 256×256×256 images used in this paper). It also yields improvement for the individual extractors, i.e., BET and BSE. Therefore, this step also improves the performance of meta-extraction, where we apply multiple extractions by using the individual algorithms. The preprocessing was also proved useful in other brain extraction methods (Eskildsen et al., 2011; Rex et al., 2004; Sadananthan et al., 2010).
The proposed method has generated a unified model for the 3 age groups. For example, the template library consists of 8 exemplars, including 1 for neonate, 4 for infant, and 3 for child subjects. In the application, each testing subject is compared with exemplars to select the best-matched exemplar (using cross correlation as adopted in (Leung et al., 2010a)) and then use its respective parameter setting for brain extraction. Generally, age-matched exemplar can provide better reference for brain extraction of the respective testing subject. Actually, in our experiments, most testing subjects are assigned to the age-matched exemplars, except one infant subject is assigned with child exemplar (JI = 0.936) and two child subjects assigned with infant exemplars (JI = 0.950,0.961), which all achieve slightly below-average performance.
Label fusion methods have been used for generating the final result. Majority voting is popularly used but simple, and STAPLE has shown improvement over majority voting. The proposed level-set based fusion method models the brain boundary by a smooth closed surface, which can thus generate visually appealing results and also outperform other fusion methods. This is consistent with the observations in (Leung et al., 2010a), i.e., shape-based fusion methods generally provide better results for brain extraction.
MR imaging is getting increased attention for early brain development studies, which creates a pressing need of automated image processing. To our best knowledge, this paper presents a brain extraction framework for the pediatric subjects from birth to 18 years old at the first time. The proposed method has been extensively evaluated on the neonate, infant, and child groups and yielded the best performance over the other comparison methods. In the literature, 6 infants (10-month-old) was evaluated in (Chiverton et al., 2007) with Jaccard Index of 0.87, 29 pediatric subjects was employed in (Zhuang et al., 2006) with Jaccard Index of 0.95, and 10 pediatric subjects (5–18 years) was used in (Eskildsen et al., 2011) with Jaccard Index of 0.963. The proposed method yields superior performance in infants, and comparable results in child subjects. Meanwhile, the proposed method is computationally efficient. Our template library first includes 45 subjects and is then reduced to a compact set of only 8 exemplars. As a comparison to other label fusion methods, 681 templates were used in MAPS (Leung et al., 2010a) and 80 in BEaST (Eskildsen et al., 2011). Also, the nonlinear registration is not required in our framework. Altogether, the proposed method has the average processing time of about 10 minutes for a testing subject.
Our performance evaluation results on the existing algorithms are also consistent with previous findings. ROBEX and GCUT are employed as comparison methods in this paper, since recent label fusion methods, such as MAPS and BEaST, are not publicly available yet. Note that ROBEX uses training images and shapes from adult subjects to construct the discriminative and generative models, which will inevitably affect its performance on pediatric subjects. Similarly, GUCT uses intensity thresholding to generate initial mask and graph cut to remove narrow connections, which may not adapt to different tissue contrasts in the pediatric subjects, especially for neonates and infants. Child subjects have more adult-like structural appearance, and thus ROBEX and GCUT achieve the average Jaccard Index of 0.942 and 0.907 in child subjects in this paper, which are comparable to their best performance on adults as reported for ROBEX as Jaccard Index of 0.934 in (Iglesias et al., 2011) and for GCUT as Jaccard Index of 0.91 in (Sadananthan et al., 2010).
In conclusion, we have developed a novel learning-based brain extraction meta-algorithm, namely LABEL, for the pediatric subjects. We employ multiple-segmentations-and-fusion strategy to achieve high accuracy by combining complementary extractions via automatic learning of parameter settings. The proposed method has been extensively evaluated on 75 neonatal, 126 infant, and 45 child subjects, achieving better performance than any other methods such as BET, BSE, ROBEX, GCUT, and fusion techniques such as using the majority voting and STAPLE. More importantly, we have integrated the proposed method into a Linux-based standalone software package, namely Infant Brain Extraction and Analysis Toolbox (iBEAT), which is publicly available at http://www.nitrc.org/projects/ibeat.
Footnotes
Publisher's Disclaimer: This is a PDF file of an unedited manuscript that has been accepted for publication. As a service to our customers we are providing this early version of the manuscript. The manuscript will undergo copyediting, typesetting, and review of the resulting proof before it is published in its final citable form. Please note that during the production process errors may be discovered which could affect the content, and all legal disclaimers that apply to the journal pertain.
References
- Ashburner J, Friston KJ. Unified segmentation. NeuroImage. 2005;26:839–851. doi: 10.1016/j.neuroimage.2005.02.018. [DOI] [PubMed] [Google Scholar]
- Carass A, Cuzzocreo J, Wheeler MB, Bazin PL, Resnick SM, Prince JL. Simple paradigm for extra-cerebral tissue removal: algorithm and analysis. NeuroImage. 2011;56:1982–1992. doi: 10.1016/j.neuroimage.2011.03.045. [DOI] [PMC free article] [PubMed] [Google Scholar]
- Chan TF, Vese LA. Active contours without edges. IEEE Transactions on image processing. 2001;10:266–277. doi: 10.1109/83.902291. [DOI] [PubMed] [Google Scholar]
- Chiverton J, Wells K, Lewis E, Chen C, Podda B, Johnson D. Statistical morphological skull stripping of adult and infant MRI data. Computers in biology and medicine. 2007;37:342–357. doi: 10.1016/j.compbiomed.2006.04.001. [DOI] [PubMed] [Google Scholar]
- Eskildsen SF, Coupe P, Fonov V, Manjon JV, Leung KK, Guizard N, Wassef SN, Ostergaard LR, Collins DL. BEaST: Brain extraction based on nonlocal segmentation technique. NeuroImage. 2011;59:2362–2372. doi: 10.1016/j.neuroimage.2011.09.012. [DOI] [PubMed] [Google Scholar]
- Evans A, Lee L, Kim S, Fukuda H, Kawashima R, He Y, Jiang T, Kim J, Chen Z, Im K. Human Cortical Anatomical Networks Assessed by Structural MRI. Brain Imaging and Behavior. 2008;2:289–299. [Google Scholar]
- Fennema-Notestine C, Ozyurt IB, Clark CP, Morris S, Bischoff-Grethe A, Bondi MW, Jernigan TL, Fischl B, Segonne F, Shattuck DW. Quantitative evaluation of automated skull-stripping methods applied to contemporary and legacy images: effects of diagnosis, bias correction, and slice location. Human Brain Mapping. 2006;27:99–113. doi: 10.1002/hbm.20161. [DOI] [PMC free article] [PubMed] [Google Scholar]
- Frey BJ, Dueck D. Clustering by passing messages between data points. Science. 2007;315:972–976. doi: 10.1126/science.1136800. [DOI] [PubMed] [Google Scholar]
- Iglesias JE, Liu CY, Thompson PM, Tu Z. Robust brain extraction across datasets and comparison with publicly available methods. IEEE transactions on medical imaging. 2011;30:1617–1634. doi: 10.1109/TMI.2011.2138152. [DOI] [PubMed] [Google Scholar]
- Knickmeyer RC, Gouttard S, Kang C, Evans D, Wilber K, Smith JK, Hamer RM, Lin W, Gerig G, Gilmore JH. A structural MRI study of human brain development from birth to 2 years. Journal of Neuroscience. 2008;28:12176–12182. doi: 10.1523/JNEUROSCI.3479-08.2008. [DOI] [PMC free article] [PubMed] [Google Scholar]
- Lee JM, Yoon U, Nam SH, Kim JH, Kim IY, Kim SI. Evaluation of automated and semi-automated skull-stripping algorithms using similarity index and segmentation error. Computers in biology and medicine. 2003;33:495–507. doi: 10.1016/s0010-4825(03)00022-2. [DOI] [PubMed] [Google Scholar]
- Leung KK, Barnes J, Modat M, Ridgway GR, Bartlett JW, Fox NC, Ourselin S. Brain MAPS: An automated, accurate and robust brain extraction technique using a template library. NeuroImage. 2010a;55:1091–1108. doi: 10.1016/j.neuroimage.2010.12.067. [DOI] [PMC free article] [PubMed] [Google Scholar]
- Leung KK, Barnes J, Ridgway GR, Bartlett JW, Clarkson MJ, Macdonald K, Schuff N, Fox NC, Ourselin S. Automated cross-sectional and longitudinal hippocampal volume measurement in mild cognitive impairment and Alzheimer’s disease. NeuroImage. 2010b;51:1345–1359. doi: 10.1016/j.neuroimage.2010.03.018. [DOI] [PMC free article] [PubMed] [Google Scholar]
- Mazziotta J, Toga A, Evans A, Fox P, Lancaster J, Zilles K, Woods R, Paus T, Simpson G, Pike B, Holmes C, Collins L, Thompson P, MacDonald D, Iacoboni M, Schormann T, Amunts K, Palomero-Gallagher N, Geyer S, Parsons L, Narr K, Kabani N, Le Goualher G, Boomsma D, Cannon T, Kawashima R, Mazoyer B. A probabilistic atlas and reference system for the human brain: International Consortium for Brain Mapping (ICBM) Philos Trans R Soc Lond B Biol Sci. 2001;356:1293–1322. doi: 10.1098/rstb.2001.0915. [DOI] [PMC free article] [PubMed] [Google Scholar]
- Park JG, Lee C. Skull stripping based on region growing for magnetic resonance brain images. NeuroImage. 2009;47:1394–1407. doi: 10.1016/j.neuroimage.2009.04.047. [DOI] [PubMed] [Google Scholar]
- Rehm K, Schaper K, Anderson J, Woods R, Stoltzner S, Rottenberg D. Putting our heads together: a consensus approach to brain/non-brain segmentation in T1-weighted MR volumes. NeuroImage. 2004;22:1262–1270. doi: 10.1016/j.neuroimage.2004.03.011. [DOI] [PubMed] [Google Scholar]
- Rex DE, Shattuck DW, Woods RP, Narr KL, Luders E, Rehm K, Stolzner SE, Rottenberg DA, Toga AW. A meta-algorithm for brain extraction in MRI. NeuroImage. 2004;23:625–637. doi: 10.1016/j.neuroimage.2004.06.019. [DOI] [PubMed] [Google Scholar]
- Rohlfing T, Maurer CR. Shape-based averaging. Image Processing, IEEE Transactions on. 2007;16:153–161. doi: 10.1109/tip.2006.884936. [DOI] [PubMed] [Google Scholar]
- Sadananthan SA, Zheng W, Chee MW, Zagorodnov V. Skull stripping using graph cuts. NeuroImage. 2010;49:225–239. doi: 10.1016/j.neuroimage.2009.08.050. [DOI] [PubMed] [Google Scholar]
- Ségonne F, Dale AM, Busa E, Glessner M, Salat D, Hahn HK, Fischl B. A hybrid approach to the skull stripping problem in MRI. NeuroImage. 2004;22:1060–1075. doi: 10.1016/j.neuroimage.2004.03.032. [DOI] [PubMed] [Google Scholar]
- Shattuck DW, Leahy RM. Automated graph-based analysis and correction of cortical volume topology. IEEE transactions on medical imaging. 2001;20:1167–1177. doi: 10.1109/42.963819. [DOI] [PubMed] [Google Scholar]
- Shattuck DW, Prasad G, Mirza M, Narr KL, Toga AW. Online resource for validation of brain segmentation methods. NeuroImage. 2009;45:431–439. doi: 10.1016/j.neuroimage.2008.10.066. [DOI] [PMC free article] [PubMed] [Google Scholar]
- Shattuck DW, Sandor-Leahy SR, Schaper KA, Rottenberg DA, Leahy RM. Magnetic resonance image tissue classification using a partial volume model. NeuroImage. 2001;13:856–876. doi: 10.1006/nimg.2000.0730. [DOI] [PubMed] [Google Scholar]
- Shi F, Yap PT, Wu G, Jia H, Gilmore JH, Lin W, Shen D. Infant Brain Atlases from Neonates to 1- and 2-Year-Olds. PLoS ONE. 2011;6:e18746. doi: 10.1371/journal.pone.0018746. [DOI] [PMC free article] [PubMed] [Google Scholar]
- Sled JG, Zijdenbos AP, Evans AC. A nonparametric method for automatic correction of intensity nonuniformity in MRI data. IEEE transactions on medical imaging. 1998;17:87–97. doi: 10.1109/42.668698. [DOI] [PubMed] [Google Scholar]
- Smith SM. Fast robust automated brain extraction. Human Brain Mapping. 2002;17:143–155. doi: 10.1002/hbm.10062. [DOI] [PMC free article] [PubMed] [Google Scholar]
- Warfield SK, Zou KH, Wells WM. Simultaneous truth and performance level estimation (STAPLE): an algorithm for the validation of image segmentation. IEEE transactions on medical imaging. 2004;23:903–921. doi: 10.1109/TMI.2004.828354. [DOI] [PMC free article] [PubMed] [Google Scholar]
- Weisenfeld NI, Warfield SK. Automatic segmentation of newborn brain MRI. NeuroImage. 2009;47:564–572. doi: 10.1016/j.neuroimage.2009.04.068. [DOI] [PMC free article] [PubMed] [Google Scholar]
- Yushkevich PA, Piven J, Hazlett HC, Smith RG, Ho S, Gee JC, Gerig G. User-guided 3D active contour segmentation of anatomical structures: Significantly improved efficiency and reliability. NeuroImage. 2006;31:1116–1128. doi: 10.1016/j.neuroimage.2006.01.015. [DOI] [PubMed] [Google Scholar]
- Zhuang AH, Valentino DJ, Toga AW. Skull-stripping magnetic resonance brain images using a model-based level set. NeuroImage. 2006;32:79–92. doi: 10.1016/j.neuroimage.2006.03.019. [DOI] [PubMed] [Google Scholar]


